Food production has implications for the environment, one of which is energy use (Canning et al., 2010). For example, diesel fuel is used for tractors and haying equipment on farms, and electricity is used in food manufacturing plants and in grocery stores to run refrigerators and freezers. Not only are some energy sources limited, but burning fossil fuels (coal, petroleum products, and natural gas) to produce energy emits carbon dioxide, a contributor to climate change (IPCC, 2014).
Coupled with concerns about reducing energy usage are health concerns stemming from the dietary choices made by many Americans. It is well known that the average American diet is not in line with the recommendations found in the Dietary Guidelines for Americans (DGA), issued by the U.S. Department of Agriculture (USDA) and the U.S. Department of Health and Human Services (Krebs-Smith et al., 2010; USDA and HHS, 2015). Some have questioned whether healthier diets would be less energy intensive than the current American diet. To this end, we compare two alternative, healthy diets to the current American diet. One diet meets the complete set of the DGA recommendations, and the other meets caloric and nutrient targets only. We find that food system energy usage could be reduced if Americans shifted to these healthier dietary patterns.
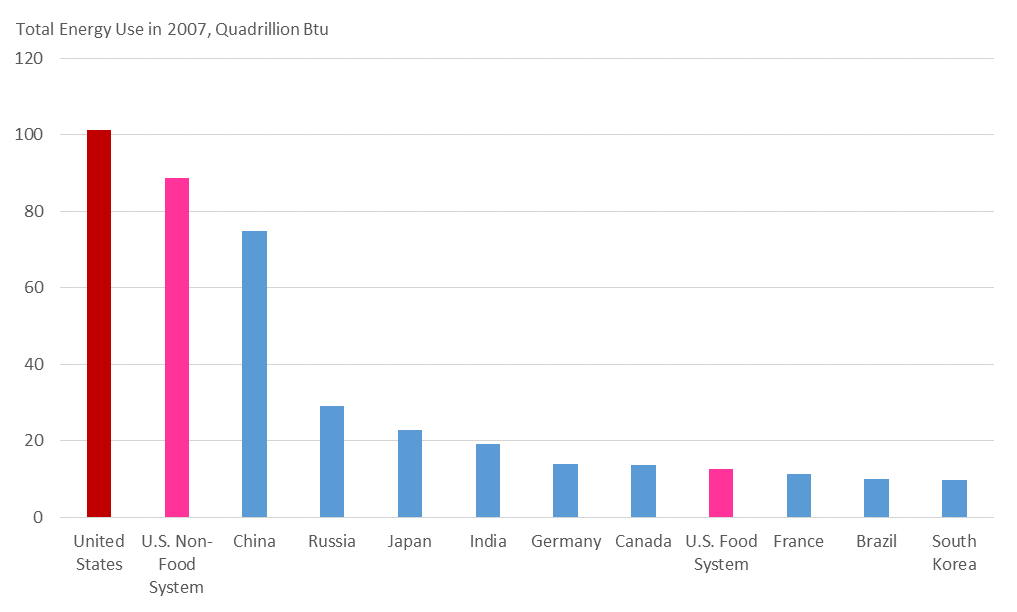
Note: Energy includes fossil fuels (coal, natural gas, and
petroleum products), nuclear power, and renewable fuels
such as solar, wind, and hydroelectricity.
Source: Authors’ calculations (U.S. food system) and
DOE-EIA (2016) (National energy budgets).
In 2007, the United States used 101.3 quadrillion British thermal units (Btu) of energy (fossil fuel, nuclear power, and renewable energy)—more than any other country’s total energy usage that year (DOE-EIA, 2016). Of that total, we estimate that the U.S. food system required 12.5 quadrillion Btu—12.3% of the national energy budget that year. This amount exceeded the total energy used—including for nonfood uses—by France, Brazil, or South Korea.
We first developed a dataset called the Food Environment Data System (FEDS) and an accompanying Environmental Input-Output (EIO) model (FEDS-EIO) to assess the energy used throughout the U.S. food system. This dataset and model relied heavily on the 2007 benchmark data from the Bureau of Economic Analysis (2017) and the State Energy Data System from the U.S. Energy Information Administration (2015b). These data describe the interactions and transactions throughout the economy needed to estimate the amount of energy used directly and indirectly by the U.S. food system. The 2007 benchmark data are the latest data of sufficient detail to allow us to link energy use to American diets.
Of the 12.5 quadrillion total Btu used by the food system, 7.8 quadrillion Btu were used by producers who grew the crops, raised the livestock, processed the agricultural commodities into foods and beverages, shipped the foods and beverages to stores, and sold the foods in grocery stores and restaurants, as well as by other businesses that supported these producers, such as chemical and packaging manufacturers. The direct and indirect energy used to provide consumers with the foods and beverages they demand is called diet-related energy use.
The remaining 4.7 quadrillion Btu attributed to the food system was used at the household level in kitchens and for food-related transportation. That is, energy used directly to drive to the grocery store and to power refrigerators, stoves, and other kitchen appliances and indirectly to build those appliances. Energy for household kitchen operations and household transportation cannot be allocated to specific food items (that is, we cannot predict how this energy use is linked to different parts of the diet or how food preparation and shopping trips will change with different diets) and was excluded from the healthy diet analysis that follows.
We used USDA’s Food and Nutrient Database for Dietary Studies to link the food and beverage items reported as consumed in the 2007–08 National Health and Nutrition Examination Survey (NHANES) to commodity purchases as represented in the FEDS dataset (CDC, 2013a). NHANES is a nationally representative survey designed to assess the health and nutritional status of Americans and is released in two-year cycles. The dietary data are collected through interviews in which respondents recall what they ate in the past 24 hours (CDC, 2013b). The linked NHANES/FEDS dataset allowed us to measure the direct and indirect energy used to produce and market the foods and beverages reported in NHANES, what we refer to as the Baseline Diet.
Consider a bunch of broccoli, for example. Energy is used to produce the fertilizers applied in the field, run the sprinkler irrigation system at the farm where the broccoli is harvested, transport the broccoli from the farm to the grocery store, and refrigerate the broccoli in the store. This and all other energy that went into growing and getting the broccoli to the consumer, constitutes diet-related energy use for this food item. We used the energy estimates for each food and beverage item represented in current American diets to calculate the energy footprint of the Baseline Diet.
To assign the thousands of foods reported in NHANES to a broader food group for reporting purposes, we relied on USDA’s food code classification system, which groups multi-ingredient foods into categories based on a representative ingredient in the food item (USDA-ARS, 2010, Appendix B). Meatloaf, for example, is categorized in the meat, poultry, and fish group, and multi-ingredient bakery products such as blueberry pie and peanut butter cookies are categorized in the grains group.
Using these groupings, the largest contributor to calories in the Baseline Diet is grain products at 35%; the next highest groups were meat, poultry, and fish at 19%, and sugar, sweets, and beverages at 15%. The Baseline Diet is not consistent with DGA recommendations. On average, Americans under consume dairy products, fruits, vegetables, and whole grains and overconsume solid fats and added sugars.
What if, instead of this Baseline Diet, Americans chose a set of foods that were in line with the DGA? What impact would alternative diets have on energy use in the U.S. food system? To address these questions, we focused on two hypothetical healthy diets: one designed to minimize changes from the Baseline Diet and a second designed to minimize energy usage. We then used the linked dataset to calculate the energy footprints of the two diet scenarios.
For the first diet, called the Realistic Healthy Diet, we used an optimization model to minimize the difference between current consumption and a diet that meets caloric and nutrition targets, plus USDA Food Patterns recommendations, all of which are outlined in the 2010 DGA. The USDA Food Patterns recommend consumption amounts by food group at 12 caloric levels that serve as examples of how to follow the DGA (USDA-ARS, 2014). These food-based guidelines allow for individual choices of food items and are intended to meet nutritional needs, if the nutrient-dense forms of food are consumed (Britten et al., 2012). We include the nutrient targets for completeness since the most nutrient-dense foods are not typically chosen by Americans (Britten et al., 2012). We also imposed a cost constraint requiring that the wholesale cost of the Realistic Healthy Diet be the same as or less than that of the Baseline Diet.
The Realistic Healthy Diet is the shortest and least disruptive route to eating healthfully. Statistically, it is most representative of current American diets that meet the DGA because of the model’s construction. Not only does the Realistic Healthy Diet conform to DGA, but it also contains many of the same food items consumed in the Baseline Diet. For example, fluid milk, bananas, and tortillas are popular food items in both diets, but the quantities of the food items vary.
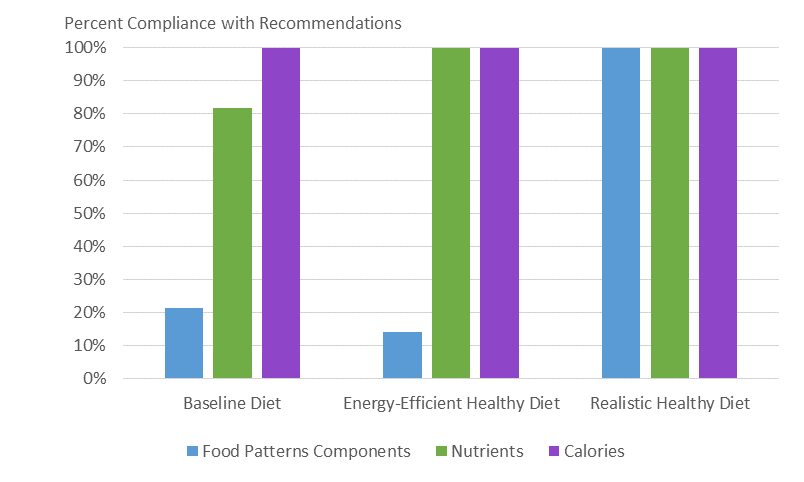
Note: 100% = 14 Food Patterns components, 33 nutrients,
and 1 calorie recommendation from the Dietary Guidelines for
Americans, 2010 (see Appendices 5, 6, and 7 in USDA and
HHS, 2010).
The second hypothetical diet, called the Energy-Efficient Healthy Diet, minimized the amount of diet-related energy used to produce foods and beverages in the diet and relaxed the constraints to only include the 33 nutrient targets and a calorie target from the DGA (USDA and HHS, 2010, Appendices 5 and 6). Without the USDA Food Patterns constraints, there is no requirement to consume from each of the food groups (for example, specific quantities of vegetables and fruit per day). Instead, any combination of food items can be chosen if the caloric and nutrient targets are met, without regard to the magnitude of the change from the Baseline Diet, variety of foods, or palatability.
This diet provides a perspective on the outer bounds of the intersection between healthy food choices and diet-related energy efficiency by delivering nutrients and calories in the most energy-efficient way possible. However, it falls short in terms of variety of food items. While the Baseline Diet has 4,067 unique food items and the Realistic Healthy Diet has 2,541, the Energy-Efficient Healthy Diet has only 85. With the relatively limited number of food items and without the Food Patterns components requiring dietary diversity, the Energy Efficient Healthy Diet would likely not be palatable for most Americans, but is relevant because it shows the largest possible energy reduction while still providing a nutritionally adequate diet for Americans.
Our analysis was carried out prior to release of the 2015–2020 DGA. To examine whether the new guidelines change the study’s key findings, we re-ran the Realistic Healthy Diet model using the new guidelines. The findings did not change appreciably in terms of overall energy requirements. The nutrient and caloric targets used for the Energy-Efficient Healthy Diet are nearly the same in the 2010 and 2015–2020 guidelines. We conclude that our findings remain relevant to the updated guidelines.
In both the Realistic Healthy Diet and the Energy-Efficient Healthy Diet, the proportion of calories from dairy products and from legumes, nuts, and seeds increased compared with the Baseline Diet, while the proportion of calories from meat, poultry, and fish and from grain products decreased.
In the Realistic Healthy Diet, daily calories from grain products are reduced from 724 in the Baseline Diet to 665 but are still the largest contributor to total caloric intake at 31%. Dairy products are ranked second (18%), and vegetables are ranked third (14%). Meat, poultry, and fish also account for 14% of calories in the Realistic Healthy Diet, and sugar, sweets, and beverages account for 5%. Calories from fruits and vegetables—two food groups that are under consumed compared to DGA recommendations—both increased.
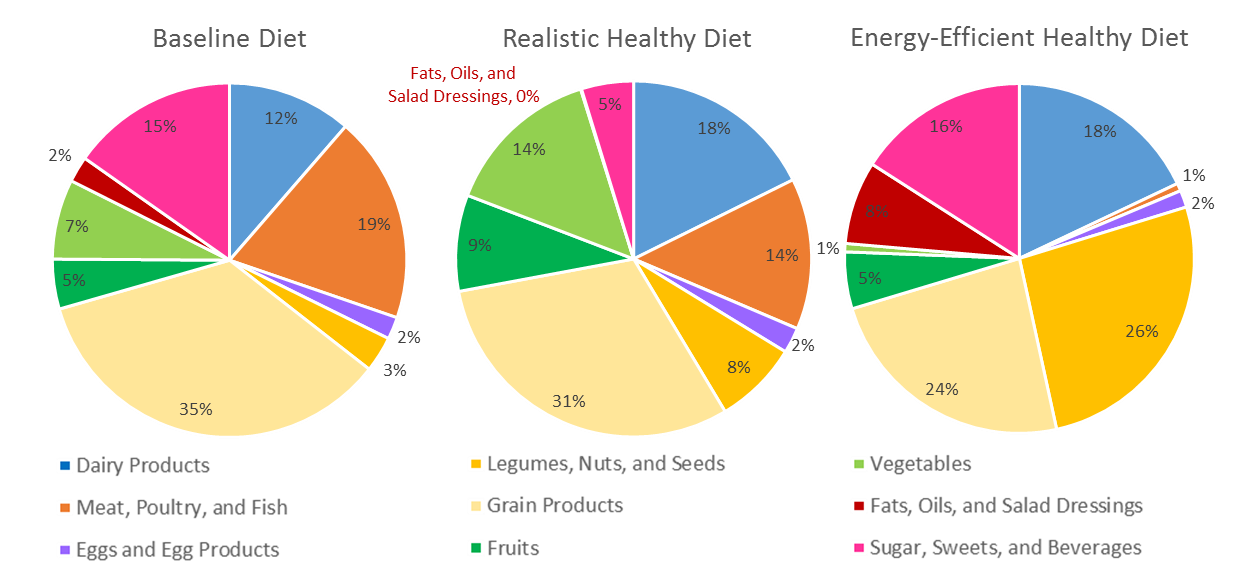
Source: Authors’ calculations.
In the Energy-Efficient Healthy Diet, legumes, nuts, and seeds account for the largest share of total caloric intake, 26% (versus 3% in the Baseline Diet), followed by grain products at 24% and dairy products at 18%. The sugar, sweets, and beverages group accounted for 16% of calories, about the same as that in the Baseline Diet. However, sugar, sweets, soft drinks, and alcoholic beverages are eliminated in the Energy-Efficient Healthy Diet and, instead, most of the calories in this category come from fruit drinks and instant teas and coffees.
In the Energy-Efficient Healthy Diet, the calorie-sparse food groups of fruits and vegetables—along with meat, poultry, and fish—account for a combined total of 7% of calories, indicating that other food groups are providing many of the nutrients commonly provided by these food categories. In the same diet, meat, poultry, and fish decrease to just 1% of total calories because the model did not choose any meat or poultry items. However, this diet includes other animal-based products such as fish and seafood, dairy, and eggs, which enable it to be categorized as “pescatarian.”
Source: Authors’ calculations.
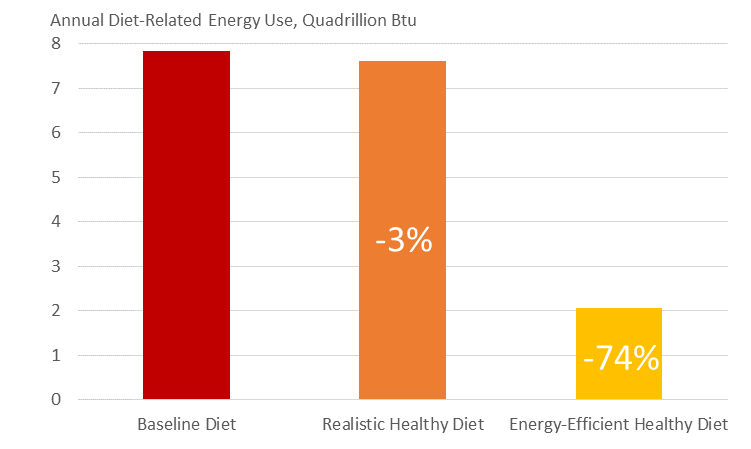
In both of the healthy diet scenarios, diet-related energy use is reduced relative to the Baseline Diet. In the Realistic Healthy Diet, diet-related energy use falls by 3%; under the Energy-Efficient Healthy Diet, it drops by 74%. To put this in context, suppose the Realistic Healthy Diet became the new average American diet. If all foods and beverages were produced the same way both before and after this change, the 3% reduction in diet-related energy use under the Realistic Healthy Diet would be equivalent to taking 3.7 million vehicles off the road in the United States annually (DOE-EIA, 2015a; DOT-FHWA, 2015; University of Michigan, 2016). Alternatively, if Americans shifted to the Energy-Efficient Healthy Diet, the diet-related energy savings would be equivalent to taking 90 million vehicles off U.S. roads each year.
The wholesale cost of the Realistic Healthy Diet was the same as the Baseline Diet, while the wholesale cost of the Energy Efficient Healthy Diet was 73% lower than that of the Baseline Diet. Although reduced costs were not an objective in the design of the diets, findings show a high correlation between the cost of the diets and the amount of diet-related energy used to produce the foods and beverages in those diets.
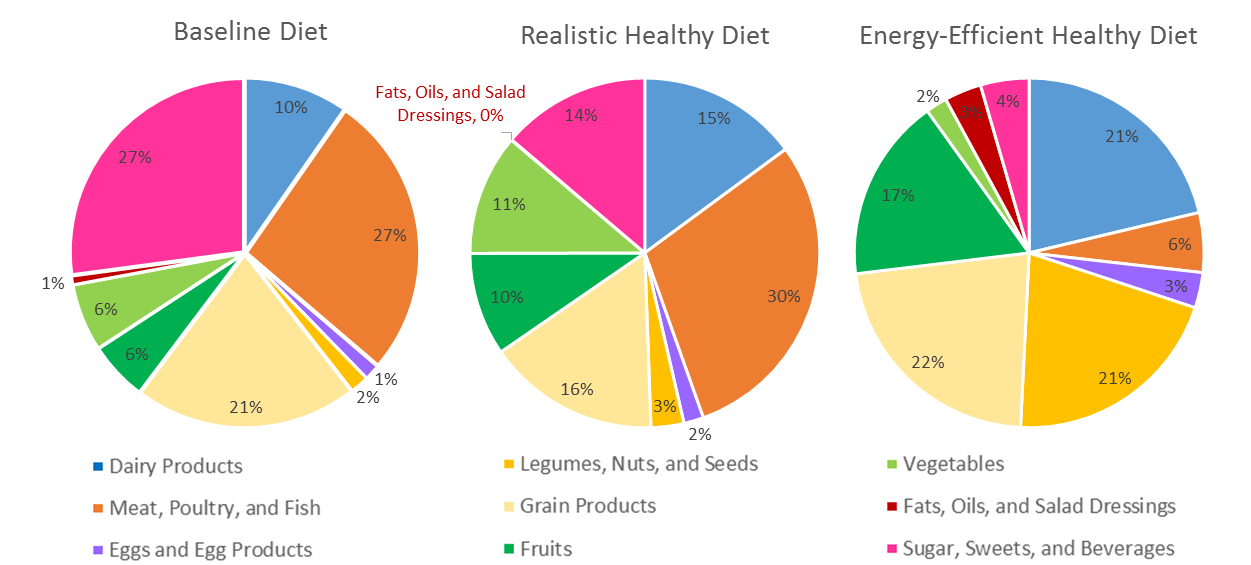
In the Baseline Diet, the meat, poultry, and fish and the sugar, sweets, and beverages categories both account for 27% of diet-related energy usage, followed by grain products at 21%. Together, these three food categories account for a total of 5.8 quadrillion Btu. If all foods and beverages were produced the same way in the three diet scenarios, these three food categories would account for 4.5 quadrillion Btu, or 59% of energy use, in the Realistic Healthy Diet and 0.7 quadrillion Btu, or 32% of energy use, in the Energy-Efficient Healthy Diet.
Source: Authors’ calculations.
In the alternative diets, energy savings would come from shifts in the amounts and types of food items being chosen by the models, each with a different energy intensity. The change in Btu by food group largely mirrors the direction of the change in calories, although not necessarily the magnitude. For example, the shares of calories from fruits and vegetables increase to 9% and 14%, respectively, in the Realistic Healthy Diet; their shares of Btu also increase, but to 10% and 11%, respectively.
In the Energy-Efficient Healthy Diet, grain products contribute 22% to Btu, followed closely by dairy products and legumes, nuts, and seeds at 21% of Btu each; the meat, poultry, and fish and the sugar, sweets, and beverages categories contribute just 6% and 4%, respectively, to diet-related energy usage.
In addition to the changing amounts of foods in each food group, the mix of food items within each group also changes in the healthy diet scenarios. For example, milk and cheese were two popular items in the dairy products category consumed in the Baseline Diet. However, producing 1 pound of whole milk cheese requires 10 pounds of whole milk, contributing to a Btu per gram ratio approximately 12 times higher for cheese than for milk. Thus, cheese is less desirable in a model that requires minimum energy. So, even while daily calories from the dairy products category increase from 235 in the Baseline Diet to 380 in the Energy Efficient Healthy Diet, energy use falls from 76 trillion to 44 trillion Btu. There is a less energy-intensive mix of dairy products in this diet than in the Baseline Diet; cheese, creams, and milk desserts such as ice cream in the Baseline Diet are replaced by an increase in milk and milk drinks.
The findings from this analysis suggest that there can be a synergy between energy use in the food system and nutrition. By eating healthier, America’s energy footprint associated with dietary patterns could be reduced. In both healthy diets analyzed—the Realistic Healthy Diet and the Energy-Efficient Healthy Diet—diet-related energy use fell compared to the energy use associated with current U.S. eating patterns. And the average wholesale cost of the diets was the same as or less than that of the Baseline Diet.
There are many ways to measure dietary quality (Wirt and Collins, 2009), but we chose to focus on the DGA since they “form the basis for nutrition policy in Federal food, education, and information programs” (USDA and HHS, 2010, p. 2). In practice, there are many ways to follow the DGA, and this paper does not intend to prescribe an ideal diet. Rather, the intention is to present hypothetical healthy diets consistent with current nutrition science embodied in the DGA and explore the impacts of these consumption patterns on energy use in the food system.
The Realistic Healthy Diet is policy relevant because it is expected to be the most representative diet if an increasing number of Americans followed the recommendations in the DGA due to the maximum likelihood properties of the model that generates this diet. The Realistic Healthy Diet is the best statistical representation of current American diets that are already aligned with the DGA (Canning et al., 2017, Appendix C). Additionally, the Realistic Healthy Diet costs the same as the Baseline Diet and also includes many of the same food items that Americans are currently choosing. Because of the behavioral and psychological obstacles to improving food choices (Guthrie, Mancino, and Lin, 2015), we consider a healthy diet that is most similar (or least disruptive) to be more realistic than a major deviation from current food choices. The result of making minimal changes from current consumption patterns to meet the DGA is a 3% reduction in diet-related energy use in the Realistic Healthy Diet. To maximize energy savings, dietary shifts would need to be more drastic.
The Energy-Efficient Healthy Diet informs our understanding of the potential for energy savings. The optimization model that produced this diet calculates the lowest energy requirement of the current food system to produce a sufficient quantity and variety of foods that would provide a nutritionally adequate diet for Americans. The result is a 74% decrease in diet-related energy use due to a large decrease in the variety of foods and beverages and a shift toward nutrient-dense “super foods,” compared to the Baseline Diet.
Our two diet scenarios provide evidence that energy reductions and nutrition can be complementary goals. Hybrids of these two healthy diets may be more palatable than the Energy-Efficient Healthy Diet and achieve diet-related energy reductions between 3% and 74%. On the other hand, other healthy diets may use more energy than current average diets. For example, other dietary scenarios use more diet-related energy than the Baseline Diet (Canning et al., 2017, Appendix C).
Previous research examining environmental impacts of meeting the 2010 DGA have produced mixed results. Tom et al. (2015) look at a dietary scenario in which calories and Food Patterns align with the DGA recommendations and find that energy increases by 38% relative to their baseline diet. Heller and Keoleian (2015) observe a 1% overall decrease in greenhouse gas emissions using the same diet scenario. Both of these studies define their baseline diets differently and conduct a process-based life-cycle assessment using existing data from the literature.
Our approach of using EIO analysis to characterize food system energy use, NHANES data for our Baseline Diet, and a mathematical modeling approach to define diet scenarios by food items differs considerably from these two studies. However, we find the most consequential difference in our results compared to the other papers (Heller and Keoleian, 2015; Tom et al., 2015) is that we account for the cost of the diets. When examining a suite of diets that meet all or a subset of the recommendations of the 2010 DGA, adding a cost constraint encourages a reduction in energy (Canning et al., 2017, Appendix C). Additionally, dietary cost is an important consideration in food choices. By preventing the food budgets from exceeding the cost of our Baseline Diet, our dietary scenarios are more realistic.
It is important to note that this analysis focuses only on diet-related energy use. The EIO model also assumes that the same production practices used to supply the foods and beverages consumed in the Baseline Diet were used to produce the foods in the two healthy diet scenarios. It is possible that large shifts in the quantities of foods demanded could lead to changes in how and where they are produced and to changes in the energy used per unit of output. The use of other natural resources such as water and land may also adjust with large changes to the American diet, which is an area of future research.
Britten, P., L.E. Cleveland, K.L. Koegel, K.J. Kuczynski, and S.M. Nickols-Richardson. 2012. “Impact of Typical Rather than Nutrient-Dense Food Choices in the US Department of Agriculture Food Patterns.” Journal of the Academy of Nutrition and Dietetics 112(10):1560–1569.
Canning, P., A. Charles, S. Huang, K.R. Polenske, and A. Waters. 2010. Energy Use in the U.S. Food System. Washington, D.C.: U.S. Department of Agriculture, Economic Research Service, Economic Research Report 94, March.
Canning, P., S. Rehkamp, A. Waters, and H. Etemadnia. 2017. The Role of Fossil Fuels in the U.S. Food System and the American Diet. Washington, D.C.: U.S. Department of Agriculture, Economic Research Service, Economic Research Report 224, January.
Centers for Disease Control and Prevention (CDC). 2013a. National Health and Nutrition Examination Survey, 2007–2008 Data Documentation, Codebook, and Frequencies. Available online: http://wwwn.cdc.gov/Nchs/Nhanes/2007-2008/DR1IFF_E.htm
Centers for Disease Control and Prevention (CDC). 2013b. NHANES 2007–2008 Dietary Data. Available online: http://wwwn.cdc.gov/Nchs/Nhanes/Search/DataPage.aspx?Component=Dietary &CycleBeginYear=2007
Guthrie, J., L. Mancino, and C.T.J. Lin. 2015. “Nudging Consumers toward Better Food Choices: Policy Approaches to Changing Food Consumption Behaviors.” Psychology & Marketing 32(5):501–511.
Heller, M.C., and G.A. Keoleian. 2015. “Greenhouse Gas Emission Estimates of U.S. Dietary Choices and Food Loss.” Journal of Industrial Ecology 19(3):391–401.
Intergovernmental Panel on Climate Change (IPCC). 2014. Climate Change 2014: Synthesis Report. Contribution of Working Groups I, II and III to the Fifth Assessment Report of the Intergovernmental Panel on Climate Change [Core Writing Team, R.K. Pachauri, and L.A. Meyer (eds.)]. Geneva, Switzerland.
Krebs-Smith, S.M., P.M. Guenther, A.F. Subar, S.I. Kirkpatrick, and K.W. Dodd. 2010. “Americans Do Not Meet Federal Dietary Recommendations.” Journal of Nutrition 140(10):1832–1838.
Tom, M.S., P.S. Fischbeck, and C.T. Hendrickson. 2015. “Energy Use, Blue Water Footprint, and Greenhouse Gas Emissions for Current Food Consumption Patterns and Dietary Recommendations in the US.” Environment Systems and Decisions 36(1):92–103.
University of Michigan, Transportation Research Institute. 2016. Monthly Monitoring of Vehicle Fuel Economy and Emissions. Available online: http://www.umich.edu/~umtriswt/EDI_sales-weighted-mpg.html
U.S. Department of Agriculture, Agricultural Research Service (USDA-ARS). 2010. USDA Food and Nutrient Database for Dietary Studies, 4.1. Beltsville, MD. Available online: https://www.ars.usda.gov/northeast-area/beltsville-md/beltsville-human-nutrition-research-center/food-surveys-research-group/docs/fndds-download-databases/
U.S. Department of Agriculture, Agricultural Research Service (USDA-ARS). 2014. FPED 2007-2008: Food Patterns Equivalents for Foods in the WWEIA, NHANES 2007–08. Available online: http://www.ars.usda.gov/Services/docs.htm?docid=23869
U.S. Department of Agriculture and U.S. Department of Health and Human Services (USDA and HHS). 2010. Dietary Guidelines for Americans, 2010. 7th Edition. Washington, D.C.
U.S. Department of Agriculture and U.S. Department of Health and Human Services (USDA and HHS). 2015. 2015–2020 Dietary Guidelines for Americans. 8th Edition. Washington, D.C.
U.S. Department of Commerce, Bureau of Economic Analysis (DOC-BEA). 2017. Input-Output Accounts Data. Available online: http://www.bea.gov/industry/io_annual.htm
U.S. Department of Energy, Energy Information Administration (DOE-EIA). 2015a. Energy Units and Calculators Explained. Available online: http://www.eia.gov/Energyexplained/?page=about_energy_units
U.S. Department of Energy, Energy Information Administration (DOE-EIA). 2015b. State Energy Data System. Available online: http://www.eia.gov/state/seds/
U.S. Department of Energy, Energy Information Administration (DOE-EIA). 2016. International Energy Statistics: Total Primary Energy Consumption. Available online: http://www.eia.gov/cfapps/ipdbproject/
U.S. Department of Transportation, Federal Highway Administration (DOT-FHWA). 2015. Average Annual Miles per Driver by Age Group. Available online: https://www.fhwa.dot.gov/ohim/onh00.bar8.htm
Wirt, A., and C. Collins. 2009. “Diet Quality – What Is It and Does It Matter?” Public Health Nutrition 12(12):2473–2492.
Link to published research: https://www.ers.usda.gov/publications/pub-details/?pubid=82193

