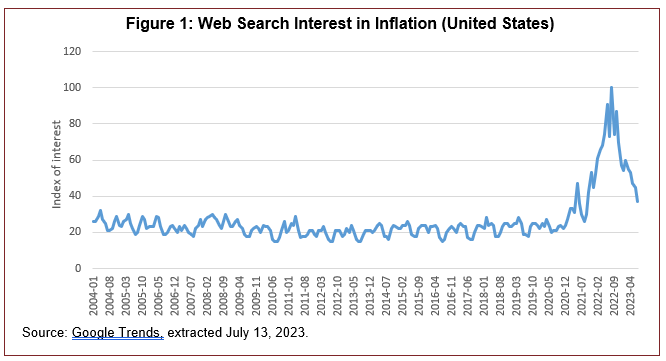
Several world events recently created upward price pressures not seen since the oil price shocks of more than 40 years ago. Among the causes of the recent price changes, the war in Ukraine, expansionary monetary policy, and the pandemic are frequently cited in the media. As measured by Google Trends (a measure of web searches), people were more interested in inflation during the past year than at any time over the past 19 years (Figure 1). The public generally hears about changes in price levels as measured by the consumer price index (CPI).
The CPI is estimated by the Bureau of Labor Statistics (BLS) on a monthly basis by gathering thousands of prices across metropolitan areas in the United States. According to the BLS (https://www.bls.gov/opub/hom/cpi/archive/20230221/home.htm), the CPI is “used to adjust income eligibility levels for government assistance, federal tax brackets, federally mandated cost-of living increases, private sector wage and salary increases, poverty measures, and consumer and commercial rent escalations.” Included in this list of important programs is the Supplemental Nutrition Assistance Program (SNAP), which is designed to help people with lower incomes access food. The CPI is also critical in formulating the Federal Reserve’s monetary policy. The Federal Reserve has a target for inflation and takes steps to cool the economy when inflation is above the target, primarily through actions that influence interest rates. When the Federal Reserve moves to increase interest rates, borrowing costs rise for households and businesses as well as for federal, state, and local governments. Over a dozen states index the minimum wage to CPI (Kamper and Hickey, 2022). Thus, the CPI and how it is estimated affect the lives of nearly all Americans.
The CPI is also called the CPI-U (U is for urban) because it measures inflation only in urban areas of thecountry. A related measure of inflation is core CPI; both CPI-U and core CPI receive tremendous policy attention. The CPI-U focuses on the full basket of goods for urban consumers. The core CPI is based on the CPI-U but drops food and energy items from the index computation, reasoning that these categories of consumption exhibit more price volatility than other items consumers purchase. Another important measure is the CPI-W, which focuses on costs faced by urban households in clerical or wage-earning occupations and is therefore, like core CPI, also a subset of the data collected for CPI-U. Importantly, CPI-W informs Social Security inflation adjustments.
Unfortunately, rural price indices areas are simply not developed or reported in official US statistics (BLS, 2023). There are practical reasons for this omission. First, US rural areas are geographically vast and the selection of consumer goods in rural stores is typically more limited than what can be found in metropolitan areas, making it difficult to construct an index with identical goods across rural and urban areas. Second is the phenomenon of outshopping. Many rural consumers take trips to shop in metropolitan areas, so some items that can be found in rural stores may not necessarily be purchased there, except occasionally, and for convenience. For example, consumers who live in a rural area may buy a large supply of paper towels at a discount retailer during a trip to the city and only purchase locally if they underestimated how much they would need before their next trip. With outshopping, an item that is identical in physical form may have another characteristic—convenience—meaning that the consumer is paying for a different bundle of goods when shopping in the home community. Rural people may face prices that are very similar to those paid by people in the nearest large metro area if they do a lot of outshopping in that area. A phenomenon that is similar to outshopping, but with high growth in recent years, is online shopping, which has become more feasible in rural areas due to increased access to high-speed internet. Given that shipping costs paid by the buyer areoften the same across the United States, onlineshopping can equalize prices for urban and rural consumers. Considering these issues, it is clearly an empirical question as to whether rural and urban consumers face different prices. Answering the question requires consideration of outshopping and online shopping in the chosen approach.
The attention to core CPI begs another question. Readers are likely aware that rural housing is famously less expensive than urban housing (Mueller, Brooks, and Pacas, 2022). Rural wages also tend to be lower than urban wages (Marré, 2017). Given that housing and service wages might cost less in rural areas, logically one can assume food and energy take up a larger share of the rural consumer’s budget than is the case for urban consumers. Further, given rural distances to jobs, services, and shopping, rural consumers may purchase greater volumes of energy for transport than similar consumers living in urbanized places. Thus, policy based on core CPI may misinterpret what is happening in rural areas by de-emphasizing changes in prices of items that are more important to rural consumers than to urban consumers. Finally, because self-employment rates are higher in rural areas than in metropolitan areas (SCORE, 2021), CPI-W may not reflect rural conditions.Poverty rates are about 4% higher in nonmetropolitan areas of the United States than in metropolitan areas (US Department of Agriculture, 2023). People living in rural areas also tend to be older than their metropolitan counterparts (Cohen and Greaney, 2023), so rural areas have a greater proportion of the population eligible for Social Security benefits and income supplements. Thus, a lack of accurate measures of rural prices may lead to welfare and Social Security support levels that are poorly matched relative to people in similar circumstances living in metropolitan areas. Further, if the rural cost of living istruly lower, then it might make sense to publicize the factbroadly as a means of encouraging rural investment and making American businesses more efficient.
To better understand relative prices in urban and rural areas, we sought items that are available in a standardized form nationally, priced with some discretion by vendors at the local level, and able to be collected via automated web-based searches. Another desired characteristic is the lack of storability, reducing the possibility of outshopping or online shopping. We draw inspiration from the Big Mac Index, which appears in dozens of studies comparing international currency valuations (Loveridge and Paredes, 2018). Rather than focus on the McDonald’s Big Mac here, because our interest is in rural areas, we selected the Subway 6-inch sandwich (specifically the BLT). Possibly due to lower up-front costs of establishing a location (no hot food fryers or grills, no milkshake machines, smaller seating areas, usually no drive-through, often located inside convenience stores, typically less square footage), Subway has thousands more outlets nationally than McDonald’s (according to Zinsmeister, 2023, 20,576 versus 13,667 in 2022), translating into more rural observations than would be possible with a focus on McDonald’s. (An automated web
search of physical addresses showed that Subway has 3,029 rural stores versus 812 for McDonald’s.)
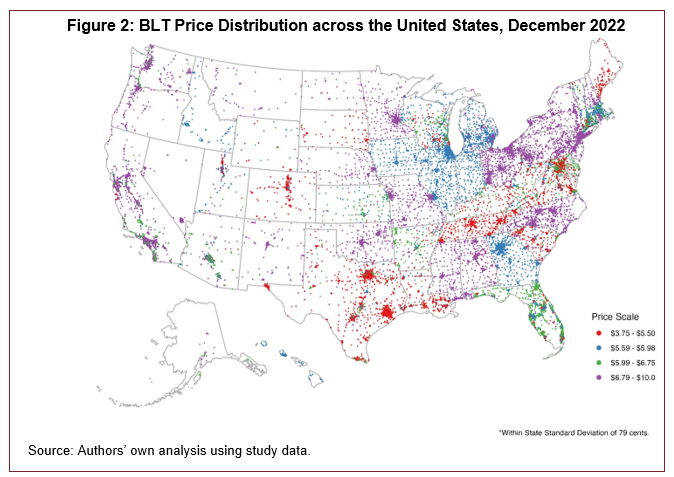
To explore differences across rural and urban areas, we assembled Subway 6-inch BLT sandwich prices in December 2022, near the time when national interest in inflation was at its peak (see Figure 1). Data were collected using Octoparse v8.5.8, software designed to facilitate automated collection of web-based data. Figure 2 shows the price distribution of Subway’s BLT 6-inchsandwich across the United States in December
with each dot representing the price at a store at that location. One immediately sees the effect of state-level conditions on prices. While prices vary within each state, with the average state-level standard deviation at 79 cents, we observe sharp distinctions across price bands at many state borders. One explanation is that state-level policies—such as minimum wage, sales taxes, and regulations affecting the difficulty of doing business—make a difference in the cost of this item and warrant further exploration. Alternatively, management may have different state strategies. The highest prices are in the northeast and on the west coast, but also (surprisingly) in Mississippi and Alabama. Alaska’s prices are also among the highest, which helps to validate Alaska’s higher SNAP support levels..
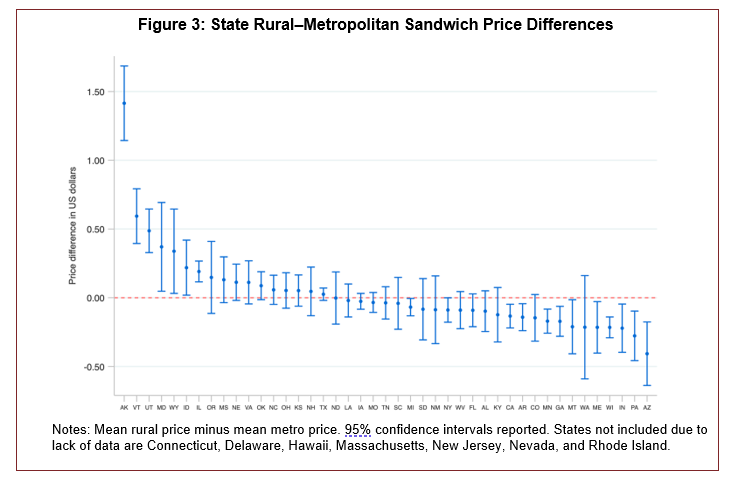
Analysis by map is limiting in that one must define price bands, which can obscure smaller differences. To more closely explore price differences across metro and nonmetro areas, we produced Figure 3, which compares within-state average prices across metro and nonmetro areas using the same definition of metro employed by BLS in CPI computations. In Figure 3, the dot above each state is the average difference, while the band above and below the dot displays the 95% confidence interval for the difference. Figure 3 shows that in severalstates, the average rural price is statistically higher thanit is in metro areas of the same state, while in many others, rural prices are statistically lower.
More work is needed to better understand how and why prices vary across states and why some rural areas appear to be relatively expensive in spite of the fact that land and labor costs are typically lower in rural areas. State policies, labor market conditions, and economies of scale are considerations for future work. The information provided here clearly demonstrates that a one-size-fits-all policy across the nation’s geography may not be appropriate for the various federal programs based on CPI. Providing too little support in a high-cost area may lead to extreme poverty, impacting physical and mental health and making it difficult for those needing assistance to recover (many support programs are intended to be temporary). Poor information can result in misallocation of federal and other resources and potential for increased human suffering. Regular measurement of regional and rural differences in price levels could also help businesses find lower-cost locations as they expand, creating opportunities for greater efficiency in the US economy.
Bureau of Labor Statistics. 2023. “Consumer Expenditures and Income: Sample Design.” Available online: https://www.bls.gov/opub/hom/cex/design.htm [Accessed July 26, 2023].
Cohen, S.A., and M.L. Greaney. 2023. “Aging in Rural Communities.” Current Epidemiology Reports 10(1):1–16.
Kamper, D., and S. Martinez Hickey. 2022, September 6. “Tying Minimum-Wage Increases to Inflation, as 13 States Do, Will Lift Up Low-Wage Workers and Their Families across the Country.” Economic Policy Institute. Available online: https://www.epi.org/blog/tying-minimum-wage-increases-to-inflation-as-12-states-do-will-lift-up- low-wage-workers-and-their-families-across-the-country/
Loveridge, S., and D. Paredes. 2018. “Are Rural Costs of Living Lower? Evidence from a Big Mac Index Approach.” International Regional Science Review 41(3)364–382.
Marré, A. 2017. “Urban Areas Offer Higher Earnings for Workers with More Education.” Amber Waves. Available online: https://www.ers.usda.gov/amber-waves/2017/july/urban-areas-offer-higher-earnings-for-workers-with-more- education/
Mueller, J.T., M.M. Brooks, and J.D. Pacas. 2022. “Cost of Living Variation, Nonmetropolitan America, and Implications for the Supplemental Poverty Measure.” Population Research Policy Review 41:1501–1523.
SCORE. 2021, July 29. “Infographic: Rural Entrepreneurship.” Available online: https://www.score.org/resource/infographic/infographic-rural-entrepreneurship%20 [Accessed August 25, 2023].
U.S .Department of Agriculture. 2023. “Rural Poverty & Well-Being.” Washington, DC: USDA Economic Research Service. Available online: https://www.ers.usda.gov/topics/rural-economy-population/rural-poverty-well-being/ [July 27, 2023].
———. 2022, April. Ukraine Agricultural Production and Trade. Washington, DC: USDA Foreign Agricultural Service. Available online: https://www.fas.usda.gov/sites/default/files/2022-04/Ukraine-Factsheet-April2022.pdf
Zinsmeister, L.A. 2023. “The 10 Restaurants with the Most Locations in the U.S.” Nation’s Restaurant News. Available online: https://www.nrn.com/top-500-restaurants/10-restaurants-most-locations-us [Accessed September 14, 2023].

