The Pasture, Rangeland, and Forage (PRF) insurance program is designed to protect ranchers from poor grazing conditions caused by lack of precipitation. Rather than measure grazing conditions directly, the PRF program uses a weighted index of current-period rainfall recorded at nearby weather stations. Insurance payouts occur when the index indicates current rainfall to be below the historical average. The effectiveness of the PRF program depends on the ability of the index to accurately estimate forage availability in a given area.
Despite federal support and an arid climate, many ranchers in the Intermountain West are reluctant to utilize the PRF insurance program, expressing concern over a lack of payouts during periods of poor forage availability. These concerns, if accurate, suggest that the PRF program may not always achieve the goal of helping to cover the replacement cost of feed during times of poor forage conditions (U.S. Department of Agriculture, 2019a).
In the arid regions of the Intermountain West, altitude is a significant determinant of precipitation. Higher altitude weather stations typically record more precipitation than nearby lower altitude stations. Moreover, because weather stations are routinely added (and retired), sharp discontinuities in the local rainfall index can occur that are not necessarily caused by changes in rainfall patterns. If this is the case, the introduction of new weather stations in areas with substantial elevation variation can create problems for the PRF insurance program. In response, the U.S. Department of Agriculture (USDA) may want to reconsider how the program estimates forage availability. In this paper, we provide evidence that the addition of new weather stations at high elevation locations in the Intermountain West may sharply increase the rainfall index and cause a long-term shortfall in PRF insurance payouts.
The Risk Management Agency (RMA) of the USDA introduced PRF insurance as a pilot program in 2007. In 2019, nearly 140 million acres were enrolled in the PRF program (Willis, 2019). However, this amount represents less than 22% of the nearly 650 million acres of land qualifying for PRF insurance in the United States. Current enrollment percentages suggest that the program may continue to grow in importance over time, particularly in arid regions of the United States (Carlson et al., 2017).
The PRF program uses the National Oceanic and Atmospheric Administration’s grid system, which divides the 48 contiguous states into 0.25-degree-latitude by 0.25-degree-longitude grids (these grids are approximately 17 x 17 miles in area at the equator). Any pasture, rangeland, or forage ground within each individual grid qualifies for coverage policies determined by the local weather stations closest to the respective grid. Typically, the closest four to ten weather stations are integrated into the payout calculation (usually within an 18.6 mile radius). Indices cannot be traced back to the reported activity of any individual station (U.S. Department of Agriculture, 2019c) since each weather station’s data is weighted according to its proximity from the center of the specified grid, giving more weight to stations closest to the centroid of that grid.
Insurance payouts are determined by comparing current rainfall index levels within a grid over a given two-month period (e.g., May–June) to a 70-year rolling index average of the historical precipitation for those same two months. If precipitation for the period purchased is below the historical average, the rancher qualifies for a payout. (For more information see Westerhold et al., 2018, as well as the RMA’s PRF website, U.S. Department of Agriculture, 2019b).
Source: U.S. Department of Agriculture (2019b).
Source: NOAA Data Tools: Find a Station, 2019
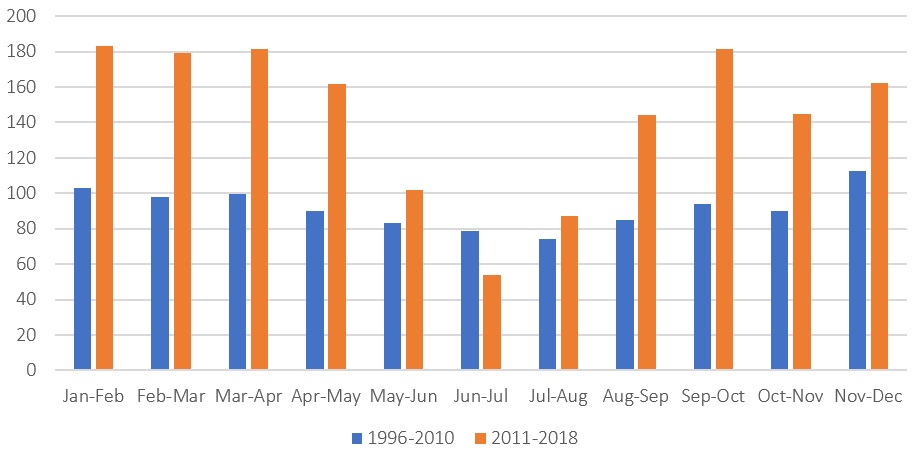
The rainfall patterns and weather station data for grid 26167 (located in northern Utah) suggests a sharp upward change in the level of recorded precipitation around 2011. This upward change corresponds to the introduction of a new weather station in the Raft River Mountains in November 2010. This new station (the George Creek, Utah, station) is located at a relatively high elevation of 9,005 feet. It also lies near the grid 26167 centroid, implying that the station measurements will be heavily weighted in the rainfall index.
Figure 1 shows the change in rainfall patterns after the George Creek station came online. The average measured rainfall index was substantially higher for the years post–George Creek station (2011–2018) compared to prior periods. In Figure 1, we compare the rainfall index in these years to a prior period twice as long (1996–2010). We use a prior period twice as long to avoid small sample problems, but we also note that this result is not sensitive to the length chosen for the prior period.
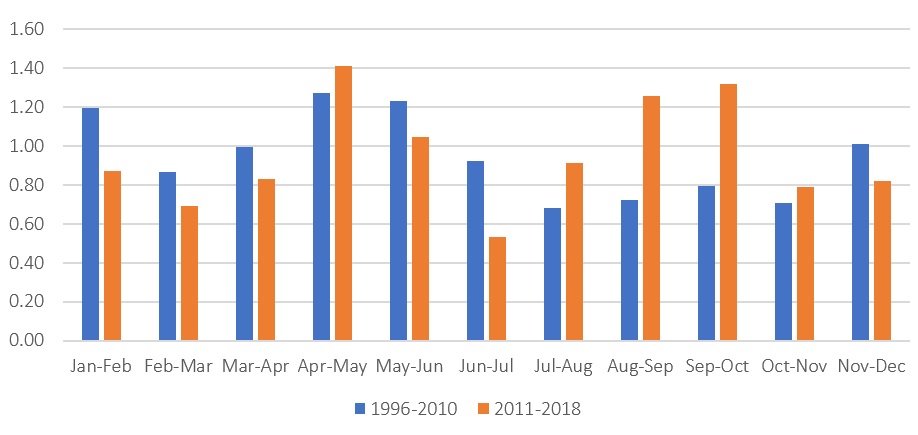
One possibility is that the observed jump in the rainfall index at the time of the new weather station installation is simply a coincidence, and rainfall across the grid was in fact higher than historical averages. If this is the case, then other individual stations should have recorded similar increases in rainfall in the period after the George Creek station came online. To investigate this possibility, we examine measured rainfall pre– and post–George Creek station at the Rosette station, a nearby station in the same grid that operated for the entire period in question. This station is near Park Valley, Utah, and located on the valley floor (5,685 feet).
Figure 2 shows that average precipitation levels from the Rosette station do not display a similar increase in recorded precipitation after the installation of George Creek station. Although the addition of the new station provides a better and more comprehensive picture of actual weather patterns in grid 26167, it also provides an estimate that is not directly comparable to historical measurements. In this case, PRF insurance is less likely to pay out, even under adverse forage conditions, indicating that PRF insurance would be unattractive to producers within that grid.
| Year |
Station Name |
Elevation (feet) | % Change in Elevation |
| Kalispell, MT (elevation, 2,939') |
|||
| 1979 | Hand Creek, MT | 5,032 | +71% |
| 1979 | Noisy Basin, MT | 6,040 | +105% |
| 1980 | Badger Pass, MT | 6,899 | +135% |
| 1981 | Pike Creek, MT | 5,928 | +102% |
| 1981 | Emery Creek, MT | 4,350 | +48% |
| 2011 | Blacktail Mountains, MT | 5,649 | +92% |
| Ashton, ID (elevation, 1,588') |
|||
| 2007 | Grand Targhee, WY | 9,258 | +78% |
| 2009 | West Yellowstone, MT | 6,676 | +28% |
| Afton, WY (elevation, 6,246') |
|||
| 1981 | Snider Basin, WY | 8,061 | +29% |
| 1981 | Blind Bull Summit, WY | 8,648 | +38% |
| 1982 | Salt River Summit, WY | 7,760 | +24% |
| 1983 | Spring Creek Divide, WY | 8,999 | +44% |
| 1983 | Cottonwood Creek, WY | 7,670 | +23% |
| Pinedale, WY (elevation, 7,211') |
|||
| 1979 | Hobbs Park, WY | 10,098 | +40% |
| 1981 | Elkhart Park G.S., WY | 8,648 | +38% |
| 1981 | Townsend Creek, WY | 8,701 | +21% |
| 1948-1979 | 1980-2009 | 2010-2018 | |
| Kalispell, MT, grid 33663 | |||
| Mean index values | 78.40 | 105.49 | 159.90 |
| Percentage change in mean | +34.55% | +51.58% | |
| Ashton, ID, grid 28875 | |||
| Mean index values | 97.33 | 95.04 | 129.69 |
| Percentage Change in mean | -2.35% | +36.46% | |
| Afton, WY, grid 27077 | |||
| Mean index values | 86.61 | 109.11 | 117.77 |
| Percentage change in mean | +25.98% | +7.94% | |
| Pinedale, WY, grid 27381 | |||
| Mean index values | 79.35 | 116.07 | 121.79 |
| Percentage change in mean | +46.27% | +4.93% |
| 1948-1979 | 1980-2009 | 2010-2018 | |
| Cheyenne, NE grid 25308 | |||
| Mean index values | 96.59 | 106.19 | 91.15 |
| Percentage change in mean | +9.94% | -14.17% | |
| Wichita, KS, grid 23823 | |||
| Mean index values | 92.71 | 108.66 | 97.06 |
| Percentage change in mean | +17.19 | -10.67% |
A larger question is whether what we observe in grid 26167 is simply a local phenomenon or if it is indicative of a more widespread pattern. Answering this question requires applying the same analysis to additional grids containing high-altitude stations coming online in recent years. Grids with these properties are present in locations near Kalispell, MT; Ashton, ID; Afton, WY; and Pinedale, WY (grids 33663, 28875, 27077, and 27381, respectively).Table 2. Changes in Average Index Values for Grids with
Table 1 shows the dates that new high-altitude stations were added at our grids of interest and Table 2 reports changes in the average precipitation index levels across these time intervals. In each of these four grids, there appears to be a strong association between the implementation of a new high-altitude weather station (Table 1) and the measured index for that station (Table 2). For instance, higher elevation stations were added near Kalispell in both the 1980s and in the past decade; Kalispell’s average index jumped over both time intervals. Afton and Pinedale added high-altitude stations in the 1980s and experienced index jumps at the same time. Finally, Ashton added new high-elevation stations in the past decade and experienced index jumps during that same time.
As an additional check, we analyze grids that have had new stations added, but in areas with less variation in altitude. Table 3 shows data for grids near Cheyenne, NE, and Wichita, KS, in the same fashion as the previous grids. Table 3 shows how the corresponding index estimates for those grids changed over time. Like the mountainous areas, these plains areas also added new stations over time. Unlike the high-altitude stations, however, these areas did not experience large changes in estimated indices beginning at the time of the new station installations.
Our findings suggest that the accuracy of the current PRF index could be vulnerable to changes in reporting stations in mountainous grids. Specific grids in the Intermountain West may experience issues when a new station’s altitude is out of line with historical stations within that grid. The arid climate of the Intermountain West makes discrepancies in rainfall estimates especially problematic. The difference between 10 and 20 inches of yearly rainfall has a larger impact on total forage than the difference between 40 and 50 inches (Huxman et al. 2004; Pickup, 1995). This means inaccuracies are more likely to occur in areas where PRF insurance could have the biggest impact.
In this section, we suggest policy adjustments that may improve the PRF program in the Intermountain West. These adjustments could be implemented by (i) making adjustments to the existing rainfall index; (ii) using an alternative measure of forage availability that is not based on rainfall; or (iii) reinforcing the rainfall index with a second measurement to test its accuracy.
We first consider modifying the rainfall index itself. While ranchers typically make planning decisions based on observed outcomes over the past several years, the rainfall index is based on a 70-year rolling average—a time period longer than the typical rancher’s planning horizon. Further, an index that has recently added high-altitude stations will take decades to correct itself under the current system. The PRF program could alleviate this problem by reducing the number of years used to calculate the historical average, increasing the rate at which the index responds to changes in weather data collection. Alternatively, the rainfall index could be modified to adjust for differences between the elevation of weather stations and the insured forage area or modified to differentiate between weather stations located in mountainous regions outside normal forage growth areas. These policy prescriptions have the advantage of keeping a relatively easy-to-understand index intact while increasing the effectiveness of the PRF program to pay ranchers in years with lower than average forage availability. An additional advantage is that none of these adjustments would add any burden to the USDA insurance agents who calculate payouts. Agents would only need to plug rainfall data within a grid into a different formula. However, the disadvantage is that neither prescription may entirely eliminate inaccuracies.
Until 2016, the PRF program gave ranchers the option of choosing between the rainfall index and a vegetation index. The vegetation index used satellite data to estimate forage availability. While considered an accurate measure of forage availability, the vegetation index had the drawback of a lack of understanding among ranchers about how the vegetation index worked (Willis, 2019). Reinstating the vegetation index and allowing ranchers the choice between the rainfall index and the vegetation index would allow ranchers in high-altitude regions access to a potentially more accurate measurement and subsequently more accurate insurance payouts. This would require extensive education to work with PRF insurers and ranchers to explain the intricacies of this system and build trust in it.
Finally, the USDA could adopt an insurance system that keeps the simplicity of the rainfall index intact, while still addressing inaccuracies stemming from altitude with a second index. Specifically, payouts could be based on rainfall, but the rainfall index could be tested against the vegetation index. If estimates are different by a predetermined amount, it would trigger an audit by USDA insurers. Forage data could then be approximated through either the vegetation index, averaging the rainfall index of surrounding grids, or collecting county-level data on unirrigated alfalfa yields at harvest. This policy would cost more in terms of program overhead and payouts but would enhance accuracy in rancher payouts.
The preferred policy prescription ultimately depends on the pervasiveness of inaccurate insurance payouts. If the inaccuracy exists for only a select few grids, the current index may already be a sufficiently accurate proxy for forage. However, if the problem proves to be more widespread, it may be worth considering reinstating the vegetation index, either as a choice for producers or as a consistency check to be used by auditors.
We observe a substantial increase in rainfall indices in several grids following the installation of a high-altitude weather station. These observations are highly suggestive of a systematic problem that warrants further research and the attention of policy makers. However, our study is not comprehensive—we examine only a subset of selected grids that appear likely to exhibit problems. Further research using a larger sample of grids will be needed to determine the extent and degree of the problem. Additionally, while we have investigated situations in which the addition of a high-altitude weather station leads to undercompensated producers, the mirror image of the problem could also occur: The removal of a low-altitude weather station could overcompensate producers and put stress on limited federal resources. Additional research could reveal the extent of this problem.
Another suggestion for future research would be to test the grid-level accuracy of rainfall indices against the vegetation index or against observed forage yields. This research could improve the ability of the PRF program to estimate forage production in various regions. Our study suggests that the rainfall index is more robust to the addition and retirement of weather stations in the relatively flat land of the South or Midwest but is less reliable in the topographically diverse Intermountain West. Mitigating potential inaccuracies in estimates of forage availability would allow PRF insurance to better achieve the goal of covering replacement cost of feed for ranchers when lack of rain leads to poor forage conditions.
Carlson, A., C. Walters, K. Brooks, M. Vandeveer, J.D. Volesky, and W. Schacht. 2017. “Risk Implications from the Selection of Rainfall Index Insurance Intervals.” Cornhusker Economics, 934.
Huxman, T. E., M.D. Smith, P.A. Fay, A.K. Knapp, M.R. Shaw, M.E. Loik, and J.F. Weltzin. 2004. “Convergence across Biomes to a Common Rain-Use Efficiency.” Nature 429(6992): 651–654.
Maples, J.G., B.W. Brorsen, and J.T. Biermacher. 2016. “The Rainfall Index Annual Forage Pilot Program as a Risk Management Tool for Cool-Season Forage.” Journal of Agricultural and Applied Economics 48(1): 29–51.
Pickup, G. 1995. “A Simple Model for Predicting Herbage Production from Rainfall in Rangelands and Its Calibration Using Remotely-Sensed Data.” Journal of Arid Environments 30(2): 227–245.
U.S. Department of Agriculture. 2019a. History of the Crop Insurance Program. Washington, DC: U.S. Department of Agriculture, Risk Management Agency. Available online: www.rma.usda.gov/Fact-Sheets/National-Fact-Sheets/Pasture-Rangeland-Forage-Pilot-Insurance-Program.
U.S. Department of Agriculture. 2019b. Pasture, Rangeland, Forage Support Tool. Washington, DC: U.S. Department of Agriculture, Risk Management Agency. Available online: https://prodwebnlb.rma.usda.gov/apps/prf.
U.S. Department of Agriculture. 2019c. Pasture Rangeland, and Forage. Washington, DC: U.S. Department of Agriculture, Risk Management Agency. Available online: https://www.rma.usda.gov/en/News-Room/Frequently-Asked-Questions/Pasture-Rangeland-Forage.
Westerhold, A., C. Walters, K. Brooks, M. Vandeveer, J. Volesky, and W. Schacht. 2018. “Risk Implications from the Selection of Rainfall Index Insurance Intervals.” Agricultural Finance Review 78(5): 514–531.
Willis, B. 2019. The U.S. Department of Agriculture's Pasture, Rangeland, and Forage Insurance Program. AGree Economic and Environmental Risk Coalition. Available online: https://foodandagpolicy.org/wp-content/uploads/sites/4/2019/09/2019-April-Pasture-Rangeland-and-Forage-Insurance-Program.pdf.

