In recent years, more and more consumers have come to value and purchase food products they believe to be sustainable, focusing on healthy eating while minimizing environmental impacts (Grimmelt et al., 2022). As part of this shift in focus, plant-based proteins, including plant-based meat alternatives (PBMAs), have attracted the attention of both consumers and the industry. However, after a period of rapid growth, the plant-based proteins sector now shows signs of slowing. A 2023 report from the Good Food Institute (GFI) found that investments in the sector dropped to $907 million, a 28% decrease from $1.3 billion in 2022, though this was still less severe than the broader decline in global venture funding. Sales patterns have also slowed: From 2021 to 2022, dollar sales increased by just 6%, while unit sales declined by 3%. This trend accelerated in 2023, with dollar sales dropping 2% and unit sales declining 9%, indicating a shift in the sector’s growth trajectory. The PBMA market mirrors this broader market trend, highlighting the need to understand the dynamics driving these changes. This study takes a closer look at the PBMA market during its initial growth phase (pre-2021) and the more recent period of slowed expansion (post-2021).
Why does this matter? This study addresses two important gaps in the literature: (1) the lack of analysis on supply-side dynamics at a disaggregated level and (2) the tendency to overlook the recent slowdown in PBMA market growth, especially after 2020. Previous studies have largely relied on primary data and nonmarket valuation methods to assess consumer preferences for specific PBMAs products (see meta-analysis by Sun, Caputo, and Taylor, 2024). More recent work has used basket-based choice experiments (Caputo, Lusk, and Blaustein‐Rejto, 2025; Neill and Britton, 2024) or scanner data (see, for example, Neuhofer and Lusk, 2022; Cuffey et al., 2023; Zhao et al., 2023) to estimate consumer demand and price elasticities. However, these studies typically do not address broader issues like product diversity, pricing patterns, and consumer shopping baskets using secondary data. Additionally, most scanner data studies are dated, covering only earlier periods (Cuffey et al., 2023; Neuhofer and Lusk, 2022; Zhao et al., 2023) and thus missing recent declines documented by GFI (2023). As a result, the prevailing narrative still portrays PBMAs as a fast‑expanding market, focusing on growth‐phase consumer drivers while neglecting its current stabilization and the implications of slowed expansion. Investigating this latter period is key to understanding how PBMAs might move beyond their niche status and unlock their full environmental and health benefits.
Our study addresses these gaps by using the latest Circana data, spanning 2019–2022. This dataset captures both the high-growth and recent slowdown phases, providing fresh insights into current sales trends, pricing behavior, product diversity, and consumer shopping patterns across key PBMA segments: chicken and beef alternatives, in forms such as patties, nuggets, and fresh and frozen options. More specifically, we examine which subproduct categories contributed most to the market’s deceleration and which continue to expand as well as emerging basket-level purchasing patterns. With these recent data, we can better understand shifts in consumer behavior and the evolving role of plant-based products in today’s diets. For example, consumers show differing preferences across product types; some find PBMA for chicken nuggets less appealing than traditional options, while others prefer plant-based beef alternatives (Vural, Ferriday, and Rogers, 2023). Our analysis also examines pricing and shopping baskets to explore whether PBMAs are viewed as substitutes or complements to meat products, providing insights that can help producers and retailers refine strategies to position PBMAs effectively in the market.
This study is based on two sets of scanner data at the retail and household levels. Each dataset was used to describe different aspects of the PBMA market.
We used retail-level data from Circana to analyze sales trends across various PBMA product categories, including PB beef and PB chicken alternatives, as well as to assess brand performance. The dataset includes weekly records at the retailer marketing area (RMA) level, detailing both retail dollar sales and volume sales (in pounds) at the Universal Product Code (UPC) level. The data cover the period from January 2019 to December 2022.
To prepare the dataset for analysis, we followed a three-step process. First, we excluded RMAs that did not sell PBMAs during the study period, reducing the sample from 601 RMAs to 523 (around 87% of total RMAs) across all U.S. states. The fact that 87% of RMAs sell PBMAs indicates broad market penetration of these products. We excluded the remaining 13% because our subsequent analysis focuses specifically on PBMA sales trends and market dynamics at the RMA level. Second, we filtered out non-PBMA products, leaving 1,762 unique PBMA products (UPCs). Finally, we aggregated the data on a monthly basis to reduce short-term fluctuations, resulting in a dataset with 48 months of sales data.
The final dataset includes monthly sales volume and dollar sales (revenue) data for each UPC across all RMAs. We then calculated product prices using the following formula:
Priceijt=DollarSalesijt/VolumeSalesijt ,
where Priceijt is the average price of UPC i (i=1, …, 1762) in RMA j (j=1, …, 523) in month t (t=1, …, 48) ;
DollarSalesijt is the total sales (in dollars) of UPC i in RMA j in month t;
and VolumeSalesijt is the total sales (in pounds) of UPC i in RMA j in month t .
We employed household scanner data from Circana to analyze grocery shopping patterns and the composition of food baskets that include PBMAs. This dataset captures all food items, quantities, and prices from everyshopping trip made by 127,981 households in 2022. Among these households, only 9,356, accounting for 7.3% of total households, purchased PBMAs at any time in 2022. These 9,356 households generated 46,296 grocery trips. At the household level, 38% recorded only one grocery trip; 16%, 10%, 7%, and 5% recorded two, three, four, and five trips, respectively, while 24% have more than five. Among these 46,296 grocery trip records, we identified 32,788 grocery trips including PBMAs, accounting for 71% of the total trips made by these households.
Our analysis of retail-level data examined the PBMAs sales trends, focusing on the performance of specific product categories such as beef and chicken as well as various brands. To comply with our agreement with the data provider, specific brand names are omitted in the discussion of results.
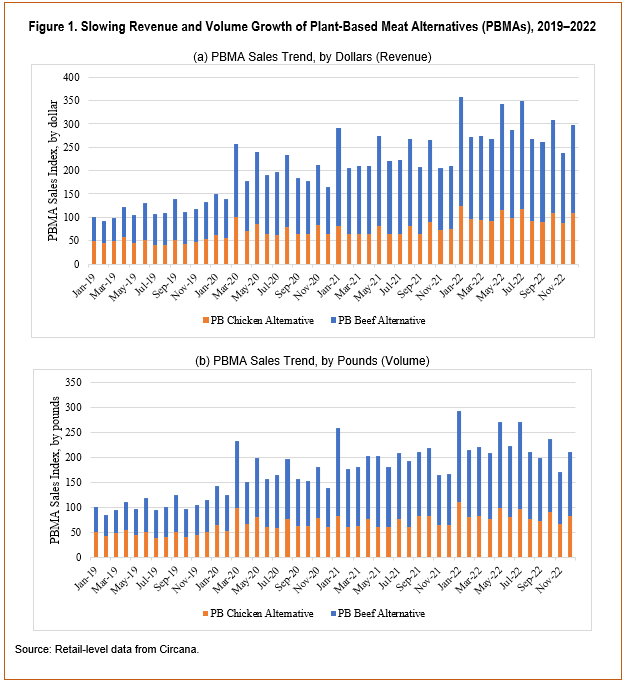
Figure 1 shows that revenue and volume growth trends for PB beef and chicken alternatives from 2019 to 2022. Panel A shows a substantial revenue increase, with PB beef alternatives rising by 85% and PB chicken alternatives rising by 50% between 2019 and 2020. This growth trend extends to sales volume, as depicted in Panel B. From 2019 to 2020, the sales volume of PB beef and chicken alternatives increased by 71% and 48%, respectively, slightly lagging behind revenue growth. Taken together, these figures suggest that growth was mainly driven by increased sales volume rather than price inflation (see the “Price Trends” section for further discussion on price patterns).
Notably, March 2020, which was marked by the onset of the global pandemic, saw a sharp spike in PBMA sales, both in revenue and volume. This pattern aligns with Zhao et al. (2023), who also reported similar sales spikes for both PB and traditional meat products during the pandemic, largely driven by stay-at-home orders (Zhao et al., 2023) and consumer stockpiling of food (Deaton and Deaton, 2020). Yet, although sales declined slightly in the months that followed, the overall growth trajectory remained relatively flat between 2021 and 2022. Compared to the rapid gains in 2019–2020, revenue growth for PB beef and chicken alternatives slowed down beginning in 2021. From 2021 to 2022, PB beef alternatives revenue rose by 41%, and PB chicken by 12%. These increases were significantly lower than the 85% and 50% gains recorded in 2019–2020. The slowdown was even more pronounced in sales volume. Between 2021 and 2022, PB beef and chicken alternatives volume grew by only 21% and 9%, respectively, well below the 71% and 48% growth rates seen in 2019–2020.
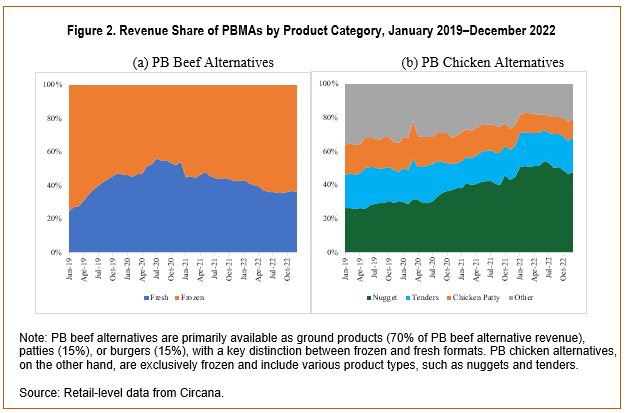
Figure 2 presents an in-depth view of PBMA sales trends within key product categories, showing the revenue and volume shares of PB beef and chicken alternatives from 2019 to 2022 (see Panels A and B). A closer examination of these data that PB beef and chicken alternatives are the primary market drivers. Together, these two categories account for 66% of all PBMA revenues and 69% of all PBMA sales volume in 2022, though significant differences exist in product variety and offerings within each category.
PB beef alternatives lead the market, contributing over 30% of total PBMA sales. This category is heavily concentrated around fresh and frozen patties and ground meat. The share of fresh PB beef rose by 28%, increasing from 25% in January 2019 to 53% by December 2020. However, since 2021, this market share has declined, reaching 41% by the end of 2022. Compared to PB beef alternatives, the PB chicken alternative segment offers a wider product range—including nuggets, tenders, and patties—reflecting a more diversified strategy to meet consumer preferences. PBMA for chicken nuggets led this category, making up 48% of revenues in December 2022, followed by tenders at 20% and patties at 12%. This broader product mix, along with a less concentrated focus on a single product, highlights the evolving nature of the PBMA market as producers innovate and experiment to capture diverse consumer interests.
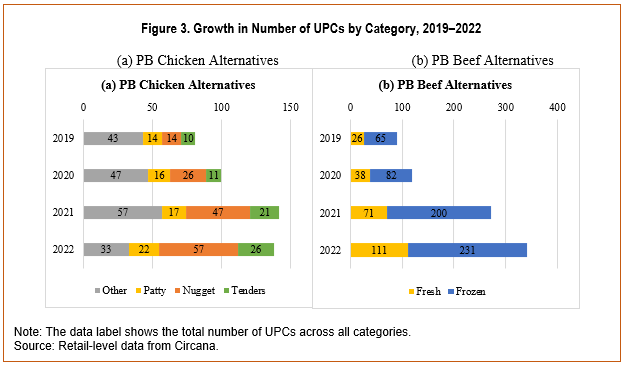
As consumer preferences for PBMAs continue to diversify, companies have responded by broadening their product lines. Figure 3 shows this expansion, measured by the increase in UPCs across various PBMA categories.
In the PB chicken alternative segment, the number of UPCs grew by 75%, rising from 81 in 2019 to 142 in 2021, with 61 new products introduced to the market (Panel A), although four products exited the market in 2022. This growth is most evident in the PBMA for products like PBMA for chicken nuggets, which leads with 43 UPCs, followed by PBMA for chicken tenders with 16 UPCs, and PBMA for chicken patties with eight UPCs. Established brands have driven this growth expanding their product lines as PBMAs gain momentum and align with evolving consumer demand.
While PB chicken alternatives showed significant growth, the PB beef alternative segment expanded even faster (Panel B). Between 2019 to 2022, the number of UPCs in this category increased by 275%, from 91 to 342, with 251 new products entering the market. This expansion is especially pronounced in the frozen PB beef alternative category, which now includes 166 UPCs, compared to 85 UPCs in the fresh PB beef alternative category. The
frozen PB beef alternative segment also displays a greater range of product variations in taste, packaging, ingredients, and nutrition. Fresh PB beef alternatives, on the other hand, remains more limited, with most brands offering only one or two product variations. This difference reflects factors like the entry of new market players and established companies expanding their product lines to include more PBMA for fresh patties and ground beef options.
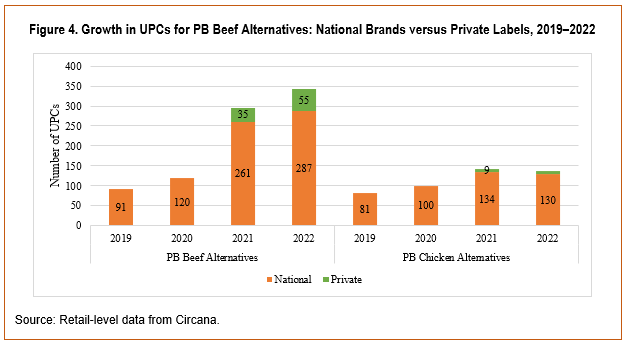
Figure 4 reports the expansion of UPCs in the PB beef alternative category, highlighting the rapid growth of both national and private label brands and their significant role in expanding the variety and availability of PB beef alternatives. National brands experienced substantial growth in 2021, with the number of UPCs rising from 120 in 2020 to 261—an impressive increase of over 110%. During this period, private label PB beef alternatives entered the market, expanding from 35 UPCs in 2021 to 55 in 2022.
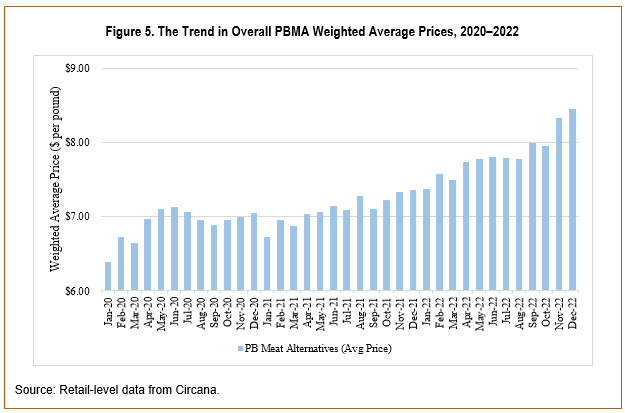
The higher price of plant-based meat alternatives compared to conventional meat is a significant barrier to widespread consumer acceptance (Taylor et al., 2023), presenting an ongoing challenge to the market expansion of plant-based meat alternatives. Figure 5 reports the average price trend of PBMAs from 2020 to 2022, adjusted based on monthly sales volume for each UPC. During this period, the weighted prices of PBMA increased steadily, ranging from $6.12 per pound to $8.45 per pound, illustrating price fluctuations overtime.
Since the price trend shown in Figure 5 reflects actual market prices, a key question is whether the upward trend simply reflects broad-based inflationary pressures or if it represents PBMA-specific price increases. To understand these pricing dynamics, we compared the rate of price changes for PBMAs and animal-based meat between 2020 and 2022. We used USDA (2024) data to measure changes in consumer price indexes of animal-based meat, and applied the following formula to measure the price change rates for PBMAs:
(2) Price Change Ratem=(AvgPricem,year-AvgPricem,year-1)/AvgPricem,year-1 .
This formula measures the percentage change in prices for each month compared to the same month in the previous year, enabling a direct comparison of how prices evolved on a year-over-year basis.
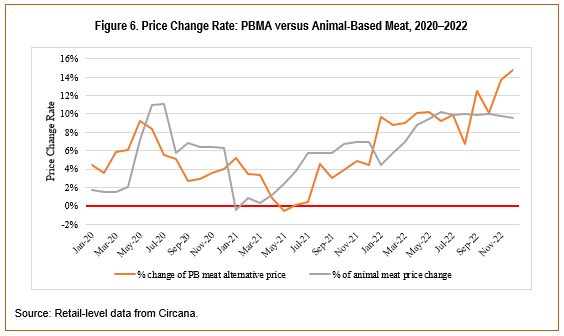
Figure 6 presents the results. Since May 2021, the price increase rates for both PBMAs and animal-based meat have exhibited an upward trend, indicating that prices are rising more rapidly over time. While some differences can be observed, such as PBMA prices remaining consistently positive (except for May 2021) and ranging from 0.1% to 14.8%, and animal-based meat prices fluctuating between 0.3% and 10.2% with a slight decline of -0.5% in January 2021, these variations are relatively minor and reflect broader inflationary trends affecting both categories. Indeed, the similar patterns in price change rates for PBMAs and animalbased meat suggest that PBMA price changes are largely influenced by general food price inflation rather than factors unique to the PBMA sector.
However, since prices are weighted by monthly sales volume, price variability may be influenced by two factors: actual changes in PBMA prices and shifts in consumer preferences. As noted previously, sales trends vary across PBMA categories over time. To better understand these dynamics, we analyzed price trends and rate changes across different PBMA categories (see Figure 7) and observed notable differences across products.
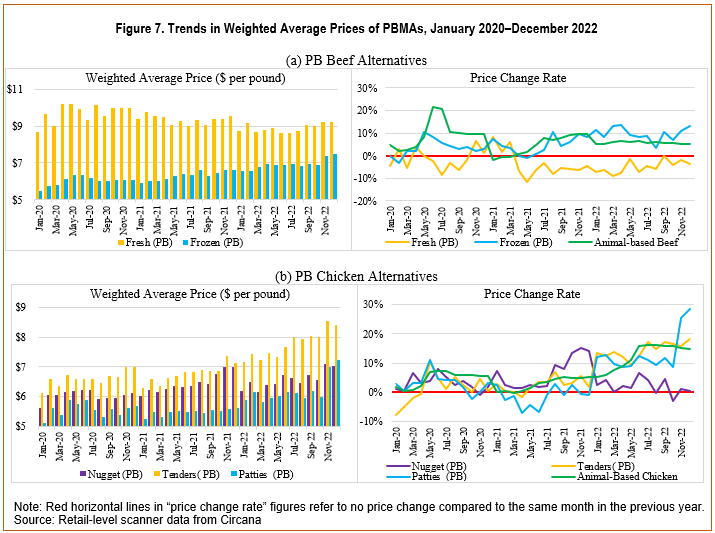
For PB beef alternatives (Figure 7, Panel A), fresh alternatives were priced significantly higher, ranging from $8.61 per pound to $10.46 per pound, compared to frozen alternatives, which ranged from $5.51 per pound to $7.49 per pound. Notably, fresh PB beef alternatives saw price decreases from April 2021 onward, with prices decreasing by -1% to -11%. This suggests that fresh PB beef alternatives have become more affordable over the period. In contrast, frozen PB beef alternatives experienced consistent price increases, ranging from 1% to 14%. When compared to animal-based ground beef (specifically ground beef and beef patties), priced between $2.25 per pound and $5.32 per pound in 2020 (USDA-AMS, 2020b), both fresh and frozen PB beef alternatives were significantly more expensive. In addition, by comparing the price trends of PB beef alternatives and animal-based beef, we find that frozen plant-based beef alternatives actually saw a price decline over our study period, which contrasts with the broader trend of rising food prices. This downward shift likely reflects the entry of other private-label plant-based brands (see Figures 3 and 4). Finally, during the COVID-19 pandemic, the inflation rate for plant-based beef alternatives remained below that of conventional meat, probably because plant-based supply chains were less disrupted than those in livestock-based sectors (Gaan, 2020).
In the PB chicken category (Figure 7, Panel B), tenders led in price, ranging from $5.97 per pound to $8.54 per pound, followed by nuggets ($5.56–$7.08 per pound) and patties ($4.98–$7.22 per pound). For the price-change trend, in 2022, PB chicken tenders and patties alternatives saw significant price hikes of 9%–28% and 9%–18%, respectively, while nugget prices remained stable. When compared to the prices of fresh chicken meat ($0.96–$3.26 per pound), PB chicken alternatives are markedly higher. However, PB chicken alternatives prices are more aligned with those of animal-based prepared chicken meat, reported at $5.86–$6.68 per pound by USDA-AMS (2020a). As shown in Figure 7, Panel B, the price change rates for all types of PB chicken alternatives are comparable to those of animal-based chicken. This suggests that the price increases for PB chicken alternatives are largely driven by general food price inflation.
Taken together, these findings highlight three key points. First, PB chicken alternatives are more expensive than fresh chicken meat, posing affordability challenges despite price parity with prepared chicken meat. Second, for PB beef alternatives, fresh products showed declining prices, improving affordability, while frozen alternatives exhibited steady price growth, making them a more dynamic and stable segment. Finally, frozen PBMAs stand out as a competitive segment due to their convenience and product innovation, positioning them as viable substitutes for traditional frozen meat and a key driver of market growth within the PBMA sector.
Following our analysis of the market outlook for PB beef and chicken alternatives, we shifted our focus to consumer shopping patterns. In the upcoming subsections, we will explore shopping trip behaviors and the related purchases, specifically examining food baskets that include PBMAs.
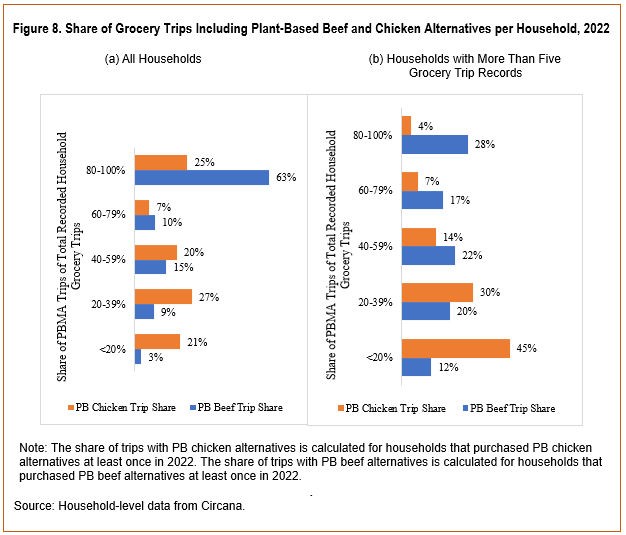
We began our analysis of household-level data by examining whether consumers treat PBMAs as a one-time trial or a regular part of their diet. Focusing on the year 2022, we identified 9,356 households that purchased PBMAs. These households made 32,788 grocery trips with PBMAs in their baskets and 13,508 trips without them. Figure 8, Panel A, shows the distribution of PBMA-inclusive trips across all 9,356 households. To reduce potential skew from households with very few trips, Panel B focuses on the 2,245 households with more than five recorded grocery trips.
The results reveal distinct patterns. In Panel A, a significant portion of households show a high share (80%–100%) of PBMA-included trips, especially for PB beef alternatives. However, 38% of households have only one grocery trip recorded, and 76% have five or fewer trips, which may skew the data. To address this, Panel B focuses on households with more than five grocery trips. Here, 45% of households purchased PB beef alternatives in over 60% of their trips, indicating that PB beef alternative is often a regular choice. On the other hand, 45% of households bought PB chicken alternatives in less than 20% of trips, suggesting that PB chicken alternatives may be more of a trial item than a regular purchase.
These findings align with Cuffey et al. (2023), who identified varied PBMA purchasing patterns across households, with 35%, 31%, 17%, and 17% of consumers classified as one-time, low-intensity, medium-intensity, and high-intensity users, respectively. Combined with our results, these insights suggest that, particularly for PB chicken alternatives, companies will need to implement strategies to encourage repeat purchases and build consumer loyalty.
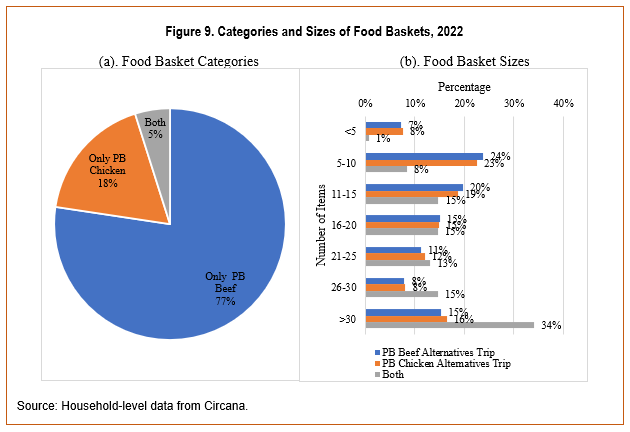
In addition to purchasing frequency, we also examined the contents of food baskets on trips that included PBMAs. We analyzed 32,788 grocery trips from 9,356 households that included PBMAs. As shown in Figure 9 (Panel A), PB beef alternatives were the most common, appearing in 77% of these baskets, while PB chicken alternatives were included only in 18% of them. In 5% of trips, both PB beef and chicken alternatives were purchased together.
Figure 9, Panel B, shows that in 77%–91% of these trips, PBMAs were bought alongside more than 10 other items. The integration of PBMAs into larger food purchases indicates that consumers view them as part of a broader grocery trip rather than standalone products. There could be a few reasons for this pattern. Some households likely have different dietary preferences, with some members choosing PBMAs while others prefer conventional meat (Schnettler et al., 2018; Jung et al., 2024). Another possibility is that conventional meat buyers are trying PBMAs alongside their usual purchases. These patterns suggest an opportunity for companies to market PBMAs as complementary to traditional diets, as noted by Caputo et al. (2024).
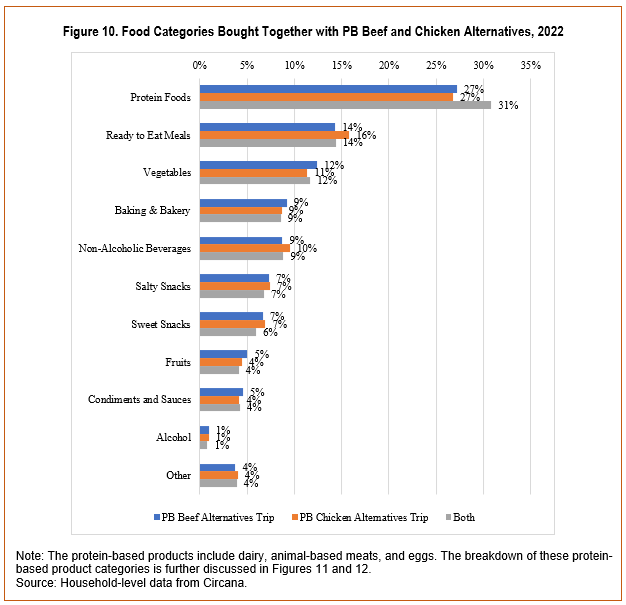
Further examining the contents of PBMA-inclusive baskets, Figure 10 shows that the most commonly purchased food category alongside PB beef and chicken alternatives is “protein-based products,” accounting for 27%–31% of items. Other frequently purchased categories include ready-to-eat meals (14%–16%), vegetables (11%–12%), and bakery products (9%). The significant presence of traditional proteins suggests that consumers are incorporating PBMAs into a diverse, protein-rich diet rather than fully replacing conventional meat.
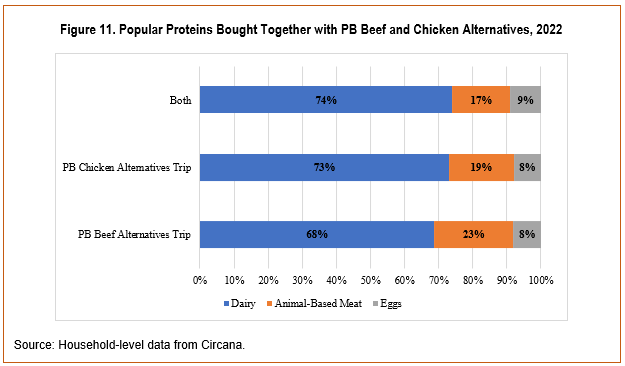
Figure 11 provides further detail on the protein sources frequently purchased with PB beef and chicken alternatives. Dairy products, animal-based meats, and eggs are the most common, with dairy accounting for 68%–74% of all protein selections, followed by animal-based meat (17%–23%) and eggs (8%–9%). Again, thispattern indicates that consumers are not completely substituting traditional animal products with PBMAs. Rather, they are integrating them into their diets. This
aligns with our findings in Figure 8 and Cuffey et al. (2023), which suggests that many consumers see PBMAs as an addition to their diets rather than a replacement, particularly for PB chicken alternatives. For PBMA producers, this integration offers an opportunity to market these products as versatile additions to balanced diets.
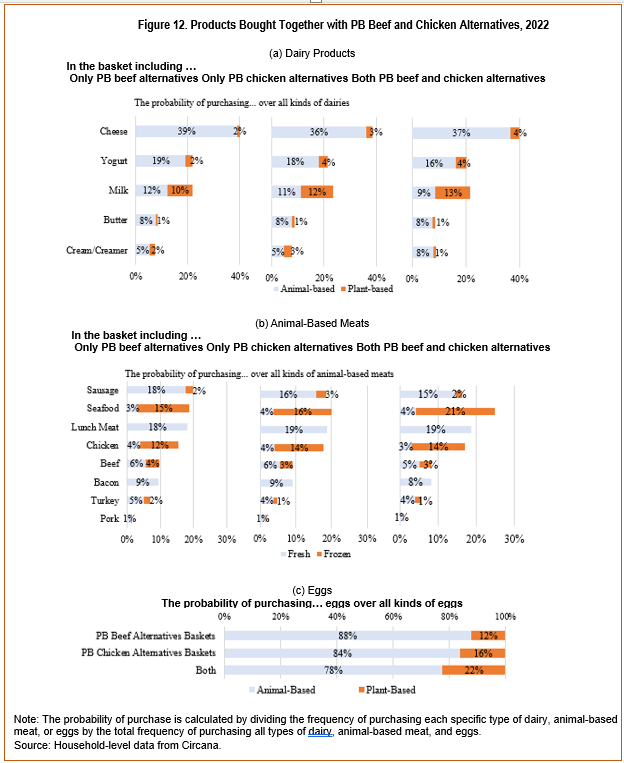
To understand more specific consumption patterns, Figure 12 breaks down the items purchased alongside PB beef and chicken alternatives into three panels: (A) dairy products, (B) animal-based meats, and (C) eggs. Panel A shows that, among dairy products, consumers frequently purchase both animal- and plant-based dairy products. Animal-based cheese is the most popular, making up 36%–39% of total dairy purchases, while PB cheese alternatives appear in only 2%–4% of baskets. Animal-based yogurt (16%–19%) and milk (9%–12%) are also frequently purchased together with PBMAs. Interestingly, PB milk alternatives, appearing in 10%–13% of selections, are more likely to be purchased alongside PBMAs than other PB dairy options, nearly matching the 9%–12% share for animal-based milk. This indicates a growing acceptance of PB milk, suggesting a market opportunity for expanded PB dairy offerings.
Panel B highlights the animal-based meats most often bought with PBMAs, with sausage (17%–20%), seafood (25%–28%), and lunchmeat (18%–19%) leading. Other popular choices include chicken (16%–18%), beef (8%–10%), bacon (8%–9%), turkey (5%–7%), and pork (1%). Fresh (refrigerated) options are generally preferred, except for chicken and seafood, where frozen products are more common. This preference emphasizes a flexitarian approach, where PBMAs are integrated alongside traditional meats and reflects diverse protein consumption preferences among household members. Also, the strong demand for certain fresh products, especially processed fresh meats, highlights a potential market for fresh PBMA options, particularly in categories where fresh items are already well-received, such as sausage, lunchmeat, and bacon. For chicken and seafood, however, frozen products are preferred over fresh options. Producers could leverage this insight to explore new frozen offerings for PB chicken and seafood alternatives, addressing consumer preferences for convenience.
Panel C focuses on egg purchases. Animal-based eggs are far more common, comprising 78%–88% of selections, compared to 12%–22% for plant-based egg alternatives. This disparity highlights the continued dominance of traditional eggs in consumer diets, indicating that plant-based options still face significant competition in this category.
This study uses scanner data and consumer panel data from Circana (2019–2022), to analyze recent trends in the PBMAs market. The results provide some key insights that contributes to the existing literature on PBMAs.
Retail-level scanner data highlight significant growth in sales of PB beef and chicken alternatives during the early stage of market establishment (2019–2021), reflecting strong consumer interest. PB beef alternatives dominated revenue and sales volume, indicating a stronger demand for beef substitutes. Further, the diversification of product offerings, especially in the PB beef alternative segment, demonstrates how producers responded to evolving consumer preferences during this period. However, the late stage of market development (post-2021) saw slower growth across most product categories, with declines in revenue, sales volume, and new product introductions, especially for PB chicken alternatives. This slowdown could stem from various factors, including reduced novelty appeal, shifting consumer priorities toward cost-saving behaviors amid inflationary pressures, and the persistently high prices ofPBMAs compared to conventional meat, particularly for chicken alternatives.
An exception to this trend is the frozen PBMA segment, which showed a sustained market size during the post-2021 period. Our analysis identifies frozen PBMAs as the most promising area for investors. This could be due to their pricing, which more closely aligns with conventional frozen meat, as well as their convenience, longer shelf life, and product innovation, all of which resonate with consumer preferences. These factors position frozen PBMAs as viable substitutes and stress their potential for market growth and investment.
Yet, despite the strong performance of the frozen category, our findings indicate that the overall PBMAmarket faces challenges. Without addressing the cost differential, PBMAs risk remaining niche products for sustainability-focused consumers willing to pay a premium rather than becoming mainstream alternatives to traditional meat.
Household-level panel data reveal patterns in PBMA purchasing behavior. While previous studies (e.g., Cuffey et al., 2023) have reported low repurchase rates among PBMA consumers, our food basket analysis suggests that consumers exhibit flexible consumption patterns and relatively weak attachment to PBMAs. PBMAs are often integrated into larger grocery trips rather than being standalone purchases, positioning them as versatile components of diversified and balanced diets. These findings highlight the complementary role of PBMAs in consumer diets, aligning with recent research by Caputo et al. (2024). Consumers tend to incorporate PBMAs into varied diets rather than fully replacing traditional proteins, or households may exhibit differing dietary preferences, with some members opting for PBMAs and others preferring conventional meat. Recognizing that PBMAs
often form part of a diverse protein strategy, companies can develop marketing approaches that emphasize versatility and seamless integration into everyday meals. In addition, this study reveals that PBMAs are more likely to be consumed alongside processed traditional meat products, as also noted in more recent studies (Caputo, Lusk, and Blaustein‐Rejto, 2025). This finding can inform marketing strategies aimed at consumers who habitually consume processed meat products and can also guide decisions about strategic product placement within grocery stores.
Although this study documents the recent slowdown in sales growth and uncovers key purchasing patterns, further work is needed to determine whether this deceleration reflects difficulties in attracting new consumers or reduced consumption among existing ones. Likewise, it remains to be seen whether the growing share of frozen PBMA products stems from successful entry into new customer segments or shifting preferences among established consumers, distinctions that are important for guiding product innovation and marketing strategies. Finally, examining geographic variation in PBMA sales and shopping baskets could reveal which markets are saturated and which remain underserved.

