The increasing trend of overweight and obese people in the United States emphasizes a need for effective and far-reaching nutrition education programs targeted toward current and future populations at risk. The U.S. government’s commitment, to that end, is reflected in the range of federally funded food assistance and nutrition education programs it offers. The U.S. Department of Agriculture (USDA) alone spends millions of dollars every year on nutrition education programs such as the Expanded Food and Nutrition Education Program (EFNEP); Women, Infants and Children (WIC) Program; and Supplemental Nutrition Assistance Program Education (SNAP-ED). The EFNEP is the only program designed specifically to provide nutrition education, whereas the others combine nutrition education together with nutrition assistance programs (General Accounting Office (GAO), 2004).
The EFNEP, with a history of over four decades and now operating in more than 800 counties of all 50 states, six U.S. territories, and the District of Columbia, serves about half a million adults and youth every year (USDA, 2013a). The program primarily focuses on improving various aspects of nutrition ranging from participants’ ability to make healthy food choices, skills in food preparation, food safety, and sanitation to managing a food budget. Within each state, the State Cooperative Extension staff provide leadership to the program. The EFNEP program assistants and volunteers, who are usually local to the community they serve, are responsible for recruiting the participants and delivering the EFNEP curriculum. The curriculum is delivered as a series of lessons, over several months. Nationally, EFNEP receives an annual allocation of about $68 million from the USDA (2013a).
The tight budgetary conditions faced by the government pose an increasing threat to educational programs such as EFNEP, which may not have visible ”products” or impacts. Recognizing the lack of economic evaluation studies, the GAO recommended pursuing evaluation studies as a part of ensuring accountability of the federally funded nutrition education programs (GAO, 2004). Evidence of effectiveness has been documented for some of these programs (for a recent example, see USDA 2013b). Some progress on cost effectiveness analysis of EFNEP has since been made. Evidence of (cost) effectiveness from evaluation studies could provide justification for EFNEP’s appropriation and possibly support program sustainability.
The USDA annual “impact” report serves as a basis for routine program evaluation. The report focuses on three outcome indicators, namely (i) food resource management practices (FRMP), (ii) nutrition practices (NP) and (iii) food safety practices (FSP). These outcome indicators are based on a 10-question “behavior checklist” that represents different domains of nutrition education covered by the EFNEP curriculum, and are used consistently by all programs nationwide. The annual impact report shows that most EFNEP participants tend to improve in all three outcome indicators (USDA, 2013a), suggesting the effectiveness of the program in achieving its goal of improving nutrition behavior. However, while the annual impact report does provide summary statistics on the outcomes, it provides no information relative to cost.
Several studies have conducted either cost benefit or cost effectiveness analyses of EFNEP in achieving its stated objectives in specific states. Rajgopal and colleagues (2002) were perhaps the first to conduct a cost benefit analysis of EFNEP for Virginia in 1996. They found that $1.00 spent on the adult EFNEP program produced a benefit equivalent to $10.96. Subsequently, other states conducted similar analyses and found $1.00 spent on the program produced a health expenditure savings (benefit) equivalent to $8.34 in California, $12.50 in Iowa, $3.62 in Oregon, and $9.58 in New York (Joy, Pradhan and Goldman, 2006; Dollahite, Kenkel, and Thompson, 2008; Wessman and Jensen, 2002; and Schuster et al., 2003). According to Dollahite and colleagues (2008), in an analysis of New York state data, the program cost about $892 per graduate, and the cost effectiveness ratio was $20,863 per quality adjusted life year (QALY) saved (interventions with a cost per QALY less than $50,000 are often considered cost effective in the United States).
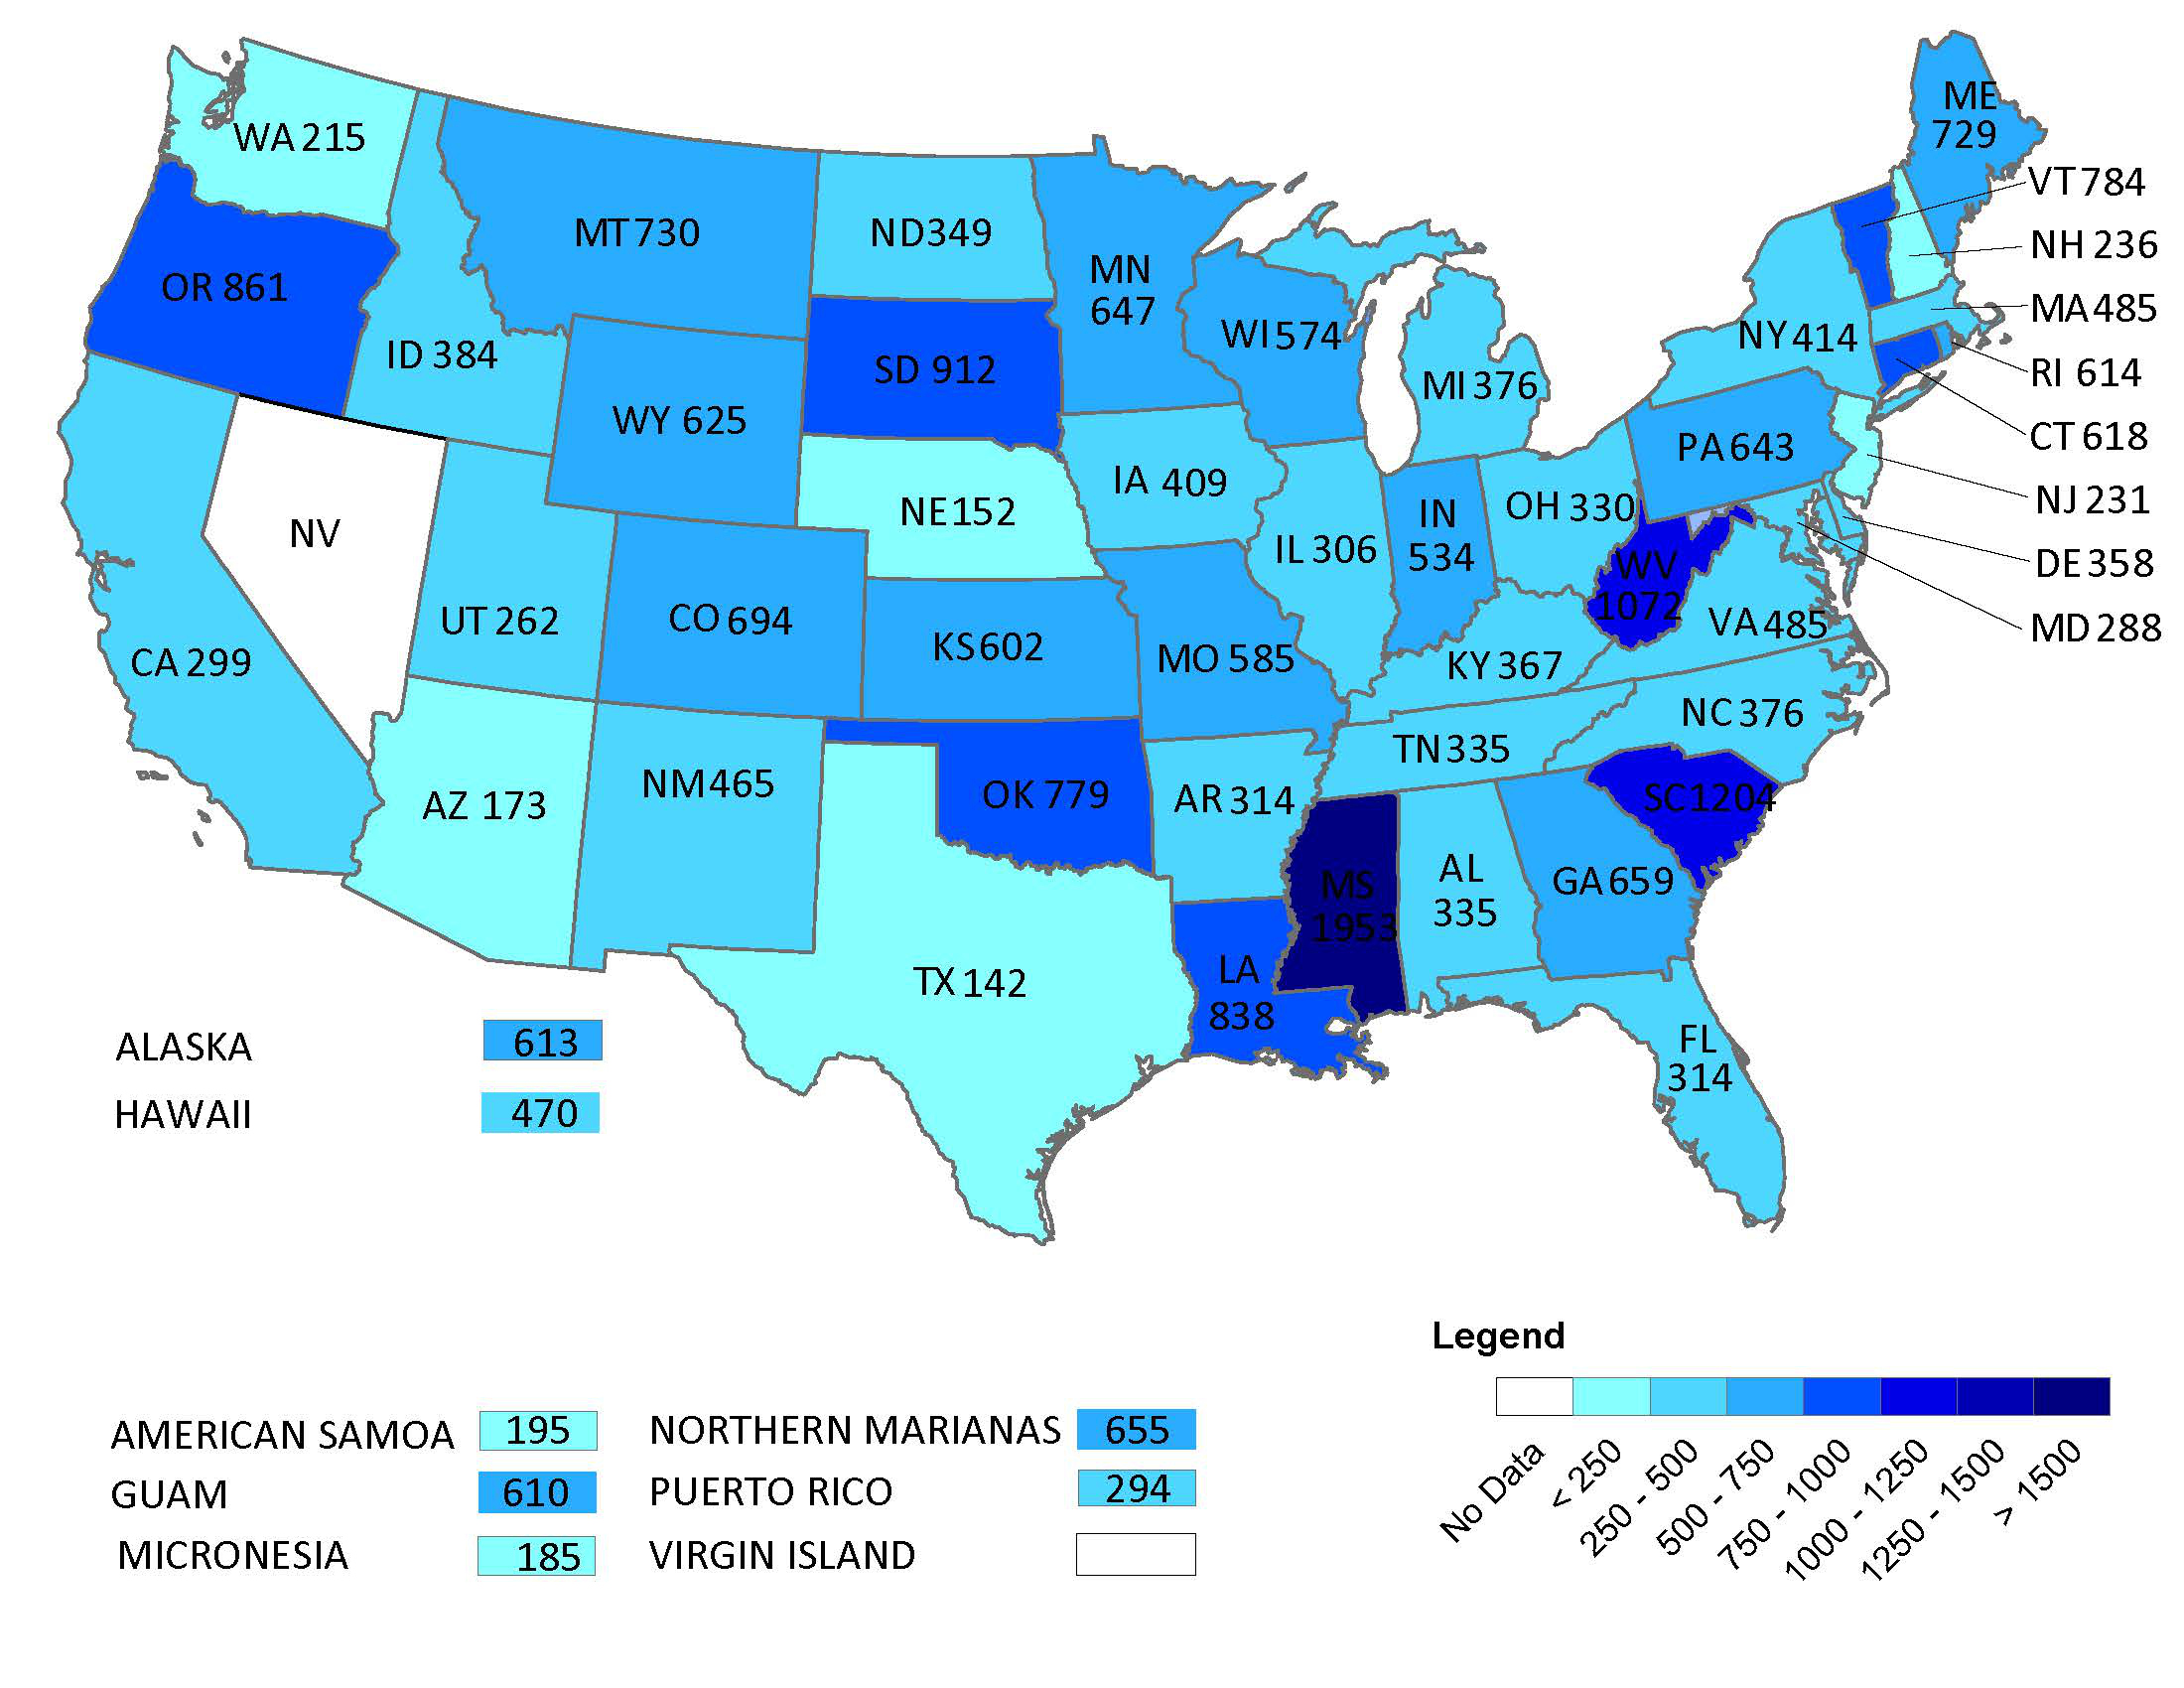
Beyond the state level analysis, Baral and colleagues (2013b) estimated the nationwide cost effectiveness for EFNEP. They found that the USDA spends, on average, about $1 million on EFNEP per state and about $520 per participant. The variations in cost per participant across states are staggering (see Figure 1), with a range of $142 to $1,953 (Baral et al., 2013b).
Identifying why some states are more cost effective than others is an important policy question, which, when answered, could lead to reducing EFNEP inefficiencies at the national level. The estimates of the average cost effectiveness ratios at the national level do not reveal a convincing geographic pattern, nor a relationship between cost effectiveness and state size (see Figure 1). This might seem obvious as state level allocations for EFNEP are based on a formula which primarily considers the population under poverty rather than the geographic location, state size or population density.
Though this type of cost effectiveness analysis, which in this context is equivalent to average cost analysis, is a first step in painting a picture of efficiency, it does not answer a more pertinent question: For every dollar spent how much does the outcome increase? This represents a standard returns to scale production type question. See box for an explanation of returns to scale (RTS).
Building on the nationwide cost effectiveness study (Baral et al., 2013a), we investigated the relationship between the money spent on the EFNEP and its impacts for each state (Baral, Davis and You, 2013b). The EFNEP faces the problem of maximizing Food Resources Management Practices (FRMP), Nutrition Practices (NP), and Food Safety Practices (FSP), subject to a cost constraint, which is the amount of federal funds provided to operate the program. Of course, other variables can affect costs such as participant and program characteristics. Each outcome indicator was considered to be generated via separate, but related, production processes. We used econometric approaches to provide a measure of returns to scale. USDA managed Nutrition Education Evaluation and Reporting System (NEERS) database consisting of impact data for all states and U.S. territories for seven years (2000-2006) were used in the analysis.
We find that only two of the three outcome indices, FRMP and NP, had a positive and significant relationship with budget allocation. At the national level, the FRMP index exhibits statistically significant increasing returns to scale. We found that a 1% increase in the budget allocated to the state or territory increases the FRMP-related outcomes by more than 2%. Similarly, the NP index exhibits statistically significant constant returns to scale, meaning that one percentage increase in budget would increase the nutrition practices related outcomes by only one percentage. For the FSP outcome index, the effect of budget allocation is essentially zero, implying decreasing returns to scale. The returns to scale, for all states and territories, are presented in Figure 2 (only for the FRMP outcome index).
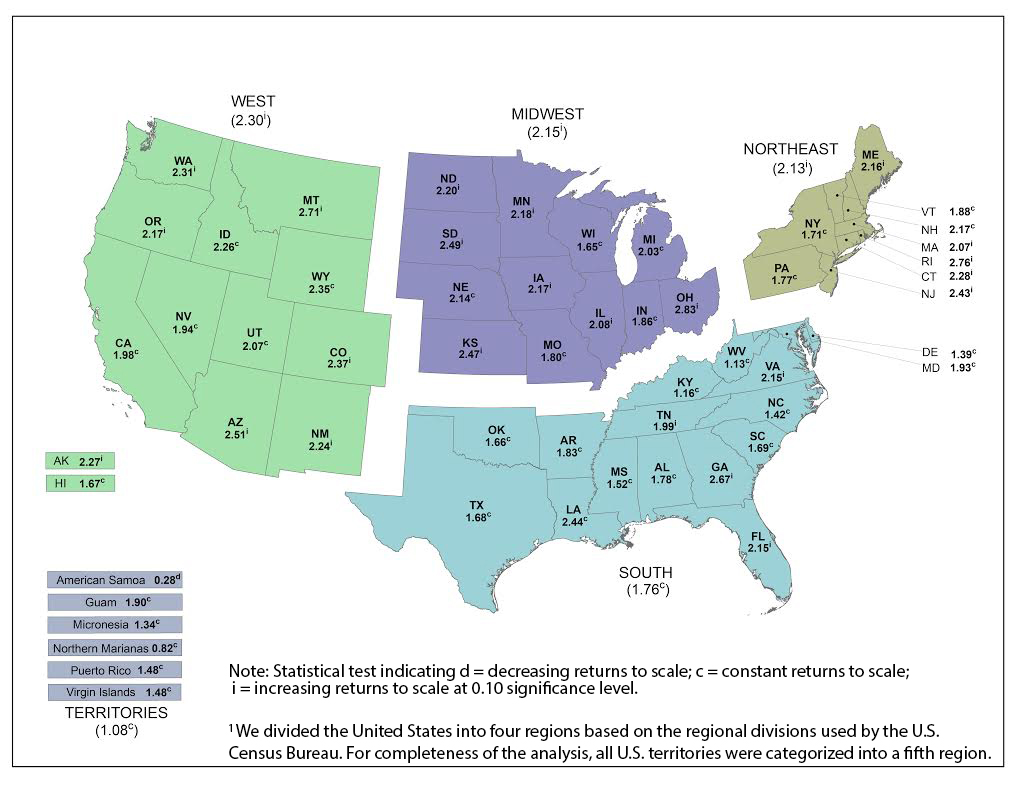
There exists a great deal of variability in the returns to scale estimates by region and state/territory (Figure 2). The highest returns to scale are in the ”West,” followed by the ”Midwest,” ”Northeast,” ”South,” and the ”Territories.” Seven of 13 states in the West (Washington, Montana, Arizona, Colorado, New Mexico, Alaska, and Oregon) had statistically significant increasing returns to scale. Seven of the 12 states in the Midwest (South Dakota, Kansas, Iowa, Ohio, Minnesota, North Dakota, and Illinois) had statistically significant increasing returns to scale. Five of the nine states in the Northeast (Massachusetts, Rhode Islands, Connecticut, Maine, and New Jersey) had statistically significant increasing returns to scale. Only four of the 16 states in the South (Georgia, Tennessee, Virginia, and Florida) had statistically significant increasing returns to scale. All other states and territories had statistically significant constant returns to scale in the FRMP index.
Unlike the FRMP index, all states/territories had statistically significant constant returns to scale for the NP index, with the exception of American Samoa and Northern Marianas, which had decreasing returns to scale. For the third outcome index, FSP, there are decreasing returns to scale, at all levels.
The obvious question that comes to mind from these results is: What determines these differences across states and territories? We explored two obvious categories of variables to determine their impact on the outcome indicators. First, we examined participant characteristics (socio-demographic information) such as age, ethnicity, education level, and household income. Second, we examined program characteristics such as program size (number of participants), program location (rural vs. urban), composition of professional staff delivering the program (explained below), and type of lessons (individual versus group), which are often determined by state-level policies.
The EFNEP outcomes are invariant across the socio-demographic characteristics of participants, such as age, ethnicity, education, and income (Baral, Davis, and You, 2013b). The demographic profile of the participants is more likely homogeneous in many respects, likely given the eligibility criteria for EFNEP. Most participants have limited resources and participate in some form of food assistance program such as SNAP, Temporary Assistance for Needy Families (TANF), or others. Recruitment into the program, although voluntary, is primarily based on referral from food assistance programs and also via word of mouth. Thus, it may not be surprising that the EFNEP is uniformly effective across different individual program participant characteristics. Program characteristics, on the other hand, are found to be an important predictor of EFNEP effectiveness. States which focus programs in rural areas generally tend to perform better than states that focus on urban areas (Baral, Davis, and You, 2013b). Whether to focus programs in rural or urban areas is primarily determined by the need and the distribution of the target population, sparing little flexibility for manipulation to improve effectiveness.
At the operational level, EFNEP exhibits heterogeneity with respect to program characteristics. The EFNEP operates within the Cooperative Extension System, which provides leadership to the program and develops (or chooses) the curriculum. The curriculum is delivered as a series of lessons, which average around eight lessons, over several months. Trained paraprofessionals (also called program assistants or PAs) are the key players in the delivery and evaluation of their specific programs. The PAs are supervised by the professionals including EFNEP and Extension administrators and Extension agents, and may be assisted by volunteers. The number of lessons and the topics covered in the lessons are usually tailored to individuals or to a group of individuals depending on the need of the program participants, based on the educator’s assessment, and the practicality for delivering the lessons.
The composition of professionals, PAs, and volunteers has significant impact on program outcomes. Programs which had a relatively large number of professionals compared to the volunteers had better outcomes (Baral, Davis, and You, 2013b). While it is true that professionals and volunteers may not actually deliver the program, they may provide other supportive functions or services to promote best practices and may lead to better outcomes. Although the process by which they influence outcomes is not known, documentation of the significance of the composition of EFNEP personnel calls for a need to investigate why this may be the case.
Some state-level studies have also analyzed the attributes of EFNEP effectiveness. Dollahite and Scott-Pierce (2003) have found that participants who took individual lessons showed more positive behavior change than those who took group lessons. Another recent state-level study documents the attributes of youth programs (Baral, 2013). Despite the differences in program scope, youth versus adults, the attributes are yet comparable because of the similarity in the structure, management, and delivery of the programs between the two. Program characteristics were found to be important determinants of effective youth programs. Consistent with the Dollahite and Scott-Pierce (2003) study, participants taught in a small group had better outcomes than their counterparts taught in large groups (Baral, 2013). Further, the performance of programs in which lessons were spaced out was better than the programs where lessons were completed in a shorter period (Baral, 2013). Program outcomes were also positively associated with the years of experience of the PAs who delivered the program (Baral, 2013).
The emerging literature on cost effectiveness of EFNEP could provide three main insights for improving EFNEP.
First, although EFNEP curriculum focuses on improving various aspects of nutrition—from making healthy food choices, improving skills in food preparation, maintaining food safety, and sanitation to managing a food budget—the program is not equally effective in improving all outcome domains. The funds directed toward improving food resource management practices and nutrition practices have positive impacts, whereas the money spent on improving food safety practices does not have much impact. Therefore, re-evaluating current approaches to food safety practices and considering alternative training and educational approaches may help improve the food safety outcomes associated with EFNEP.
Second, attributes of effective programs identified in the literature could provide insights and opportunities for EFNEP administrators to strategically devise policies that help improve effectiveness. For example, individual lessons or small group lessons may be very effective but more resource intensive. An obvious trade–off the policy maker would face is to choose between the implied declines in effectiveness as students are added to a lesson versus the decrease in the cost per student of the lesson. If the decline in the effectiveness is offset by a greater decline in cost, then group lessons would be more cost effective. Similarly, deploying more professionals compared to volunteers seems to improve program effectiveness, but might require reallocation of resources across staff classifications. Retaining more experienced PAs or increasing training opportunities for new staff would be strategies for sustaining effectiveness. The significance of collaborative experience-sharing meetings among PAs cannot be over-emphasized. The design of program delivery at the operational level such as program duration, type of lessons, and outcome focus rests primarily on PA discretion and understanding of the situation. Maybe there are benefits to be reaped from providing some structure to the program delivery or at least developing some guidelines to optimize program efficiency.
Lastly, while state level studies on cost benefit and cost effectiveness suggest that the EFNEP is one of the most cost effective nutrition education programs, the variation in cost benefit and cost effectiveness ratios across states suggests some efficiency gains are possible. The returns to scale estimates on EFNEP for all states and territories provide an objective criterion for making comparisons on program effectiveness across states and regions. Using this criterion, one can see a great deal of variability within regions and between states. Now that we know which states are doing better relative to others, EFNEP administrators and stakeholders in a relatively low-performing state can approach better performing states for insights into how their program operations differ and seek suggestions for improvements.
Baral, R., Davis, G. C., Blake, S., You, W., and Serrano, E. (2013a). Using national data to estimate average cost effectiveness of EFNEP outcomes by state/territory. Journal of Nutrition Education and Behavior, 45(2), 183-187.
Baral, R., Davis, G.C., and You, W. (2013b). National, regional, and state level estimates of returns to scale in the Expanded Food and Nutrition Education Program. Journal of Agricultural and Applied Economics, 45(2), 203-216.
Baral, R. (2013). Evaluating cost effectiveness of the USDA’s Expanded Food and Nutrition Education Program. Dissertation Submitted to the Department of Agricultural and Applied Economics, Virginia Tech.
Dollahite, J. S., Kenkel, D., and Thompson, C.S. (2008). An economic evaluation of the Expanded Food and Nutrition Education Program. Journal of Nutrition Education and Behavior. 40, 134-43.
Dollahite, J. S., and Scott-Pierce, M. (2003). Outcomes of individuals vs. group instruction in EFNEP. Journal of Extension, 41. Available online: http://www.joe.org/joe/2003april/a4.php
General Accounting Office. (2004). Nutrition education: USDA provides services through multiple programs, but stronger linkages among efforts are needed. Washington, D.C.: United States General Accounting Office.
Joy, A.B., Pradhan, V., and Goldman, G.E. (2006). Cost-benefit analysis conducted for nutrition education in California. California Agriculture. 60 (4), 185-191.
Rajgopal R., Cox, R.H., Lambur, M., and Lewis, E.C. (2002). Cost-benefit analysis indicates the positive economic benefits of the Expanded Food and Nutrition Education Program related to chronic disease prevention. Journal of Nutrition Education Behavior.34, 26-37.
Schuster, E., Zimmerman, Z. L., Engle, M., Smiley, J., Syversen, E., and Murray, J. (2003). Investing in Oregon's Expanded Food and Nutrition Education Program (EFNEP): documenting costs and benefits. Journal of Nutrition and Education Behavior. 35, 200-206.
U.S. Department of Agriculture. (2013a) - National Institute of Food and Agriculture. Expanded Food and Nutrition Education Program. Available online: http://www.nifa.usda.gov/nea/food/efnep/efnep.html
U.S. Department of Agriculture. (2013b) - Food and Nutrition Service (Press release FNS-0013.13). Study Shows Strong Nutrition Education Can Lead to Healthier Food Choices by Supplemental Nutrition Assistance Program (SNAP) Recipients. Available online: http://www.fns.usda.gov/pressrelease/2013/fns-001313
Wessman, C.B., and Jensen, H. (2002). An Evaluation of the Costs and Benefits of Iowa's Expanded Food and Nutrition Education Program. Final Report, in PM1865a, I.S.U. Extension, Editor.

