In order to feed the growing population of the world, expected to reach 9.6 billion people by 2050—a 29% increase over 2013—without causing immense environmental damage and human hunger, society must increase agricultural productivity. Two ways of achieving this are to invest in public agricultural research and to invest in public extension delivery. The importance of the need for increased investment is widely recognized. For example, in February of 2016, after only a month as the newly elected President of the American Farm Bureau Federation, Zippy Duval supported President Obama's proposed 2017 budget increases for agricultural research (AFBF, 2016) and highlighted the need for increased investment in agricultural research in his April 18, 2016, Congressional testimony (Duvall, 2016). In addition, the importance of investing in agricultural research worldwide is explicitly cited as a target of Goal 2 in the recently released United Nations Sustainability Development Goals (United Nations, 2015).
Developed countries like the United States have been leaders in science-based agricultural productivity increases for most of the 20st century. However, after growing rapidly from 1960-1982, growth in public, productivity-oriented, agricultural research investment in the United States slowed considerably from 1980-1995, and then declined over 1995-1998 by 20% before turning around and showing some growth to 2006, before declining again during the Great Recession. In contrast, rapidly developing countries, such as Brazil and China, are investing heavily in agricultural research, putting future international competitiveness of U.S. agricultural exports at risk (Fuglie and Wang, 2012). Furthermore, consumers worldwide will be worse-off if future investments in public and private agricultural research and extension are not large enough to deliver declining real world food prices in the 21st century.
Given the established importance of investing in agricultural research and extension, those currently engaged in the public agricultural science and agricultural extension policy debates need up-to-date estimates of the expected returns on investment of public funds in both of these activities. Agricultural economists have a long history in developing this "knowledge about knowledge" to provide decision makers with accurate estimates of the returns on investment.
In the United States, agricultural research and cooperative extension are separate public programs, each jointly funded primarily by the federal and state governments. Public agricultural research is undertaken primarily by state institutions—state agricultural experiment stations (SAESs) and veterinary medicine colleges/schools. Federal institutions engaged in this activity are the U.S. Department of Agriculture’s Agricultural Research Service (USDA-ARS) and Economic Research Service (ERS). In addition, public agricultural research receives a small amount of funding from the private sector and from non-governmental organizations and public extension receives significant funding from county governments.
Although SAESs were established to conduct original research on agriculture, the breadth of the research undertaken has increased over time to include research to improve the rural home and rural life, on agricultural marketing and resource conservation, on forestry and wildlife habitat, and on rural development. Hence, the breadth of the research agenda of scientists of the SAESs has expanded over time, and by the 1970s, research that was undertaken by SAES scientists was actually much broader than what could reasonably be expected to impact agricultural productivity. In addition, the breadth of research undertaken by the USDA has expanded. For example, in 1940-1941, the USDA established four Regional Utilization Laboratories or Centers—Western in Albany, CA; Midwest in Peoria, IL; Southeastern in New Orleans, LA; and Northeastern in Wyndmoor, PA—to undertake research to develop new uses and new and extended markets and outlets for farm commodities and products. Initially, they were independent agencies, but in 1953, the USDA placed these labs under the administration of the Agricultural Research Service (USDA, 2016). In 1972, new federal funding for research on rural development was made available to the State Agricultural Experiment Stations. Hence, the breadth of “agricultural” research undertaken by the public federal agricultural research system has expanded over the past century.
In developing measures of returns to investments in public agricultural research and extension delivery, economists address a variety of issues about data and methods. Four critical issues include: separation of those research and extension investments that contribute to agricultural productivity growth from those that do not; accounting for the benefits of investment in one location or farm practice that spill-over to others; identifying the lag effects of an annual investment in research and extension over multiple years; and employing the most appropriate metric for calculating returns to investments. In addition, it is important to think carefully about and identify defensible measures of benefits and costs. In particular, scholars should guard against creating measures of costs and benefits that contain obvious measurement errors.
As part of the federal-state partnership on funding of public agricultural research, the USDA’s intramural research agencies, SAESs, state forestry schools and a few other cooperating institutions agree to provide the USDA’s Current Research Information System (CRIS) with research project data. The collected data include a description of each new project by the principal investigator—the commodity or resource that is the target of the research, and the research problem areas (RPAs). RPAs include goals of research to protect crops, livestock, and forests from insects, diseases, and other hazards; and to produce an adequate supply of farm and forest products at decreasing real production costs. With details available in CRIS, it is possible to relatively accurately net out public agricultural research expenditures that clearly do not have a traditional agricultural productivity focus. How much of a difference does it make? In 1970, 70% of the U.S. total expenditures on public agricultural research reported to CRIS were on agricultural productivity-oriented research, and 30% were on all other types. Since then, the share having an agricultural productivity focus has been slowly declining.
The federal, state, and county governments fund public agricultural extension, officially labeled Cooperative Extension. It is primarily adult education for immediate decision making of farmers, households, and communities and youth activities (Wang, 2014). Broadly, the goal has been to provide information for better farm, agribusiness and home decision-making. The youth activities are comprised of “boys” and “girls” clubs, called “4-H” clubs, where members undertake practical projects in agriculture, home economics, and related subjects. In the 1960s, extension added programs in community development and natural resources. Although a gross measure of cooperative extension is possible, it seems most likely that only agriculture and natural resource extension contribute significantly to state agricultural productivity. This requires netting out resources allocated to other types of extension activities, such as home economics, community development, and 4-H. How much of a difference is there between the net and gross measures of cooperative extension? Over 1977-1992, only 55% of the gross measure of extension was accounted for by agricultural and natural resource extension. In addition, in 1977, 30% of the gross extension was allocated to 4-H, but this share declined to 23% in 1992 and seemingly leveled off.
The investments in public agricultural research and extension have different lengths of time lags for obtaining benefits, being sooner for extension than for research. It is widely accepted that the impact of public agricultural research on state agricultural productivity has a gestation period where the impact is negligible, then blossoms to full marginal impact and then becomes obsolete. We approximate this pattern with a gestation period of two years, during which the impacts and timing weights are zero; the next seven years, during which impacts and timing weights are rising; followed by six years of maturity, during which timing weights are high and constant; and then 20 years, during which impacts and timing weights are declining and fade away to zero by the end of the period. Across this 35-year period, the timing weights sum to one. See Huffman and Evenson (2006). This weighting pattern is known as trapezoidal-shaped timing weight, and they are used to translate real public agricultural research expenditures in a stock of public agricultural research capital for each state. With a lag, the effects of a long-term change in the growth rates of public agricultural research expenditures over time are revealed in public agricultural research capital.
Since extension is largely information for current decision making, 50% of its impacts—or timing weight—occurs within the year undertaken and then the impact and weights decline to zero with obsolescence. (Huffman and Evenson 2006).
Public agricultural research undertaken in one state produces discoveries that also spill over or are an input into public and private agricultural research efforts in other states and to technologies available to farms and agri-businesses in other areas, producing one type of public good. They can be represented by similarity of agro-ecological zones, output-mix similarities, or geographical proximity. When areas are physically close to one another, it reduces the physical distance that discoveries and information must travel before they can be used by farmers and agribusiness in another area. This reduces one dimension of the costs of information transfers. For example, discoveries made by public agricultural research in Iowa on corn production can easily travel to farmers and agribusinesses in Illinois and southern Minnesota but are less useful in Mississippi and North Carolina. See Huffman and Evenson (2006). Spillover benefits of research undertaken in one state to other states complicates the decision making on funding of public agricultural research in any one state. For example, the spillover benefits might be overlooked. Generally, it is assumed that there are no significant interstate spillovers for public agricultural extension.
For social cost-benefit analysis where comparison might be made across government funded programs and even internationally, the real—inflation-adjusted—social internal rates of return are better summary statistics than the net present values or cost-benefit ratios estimates. This is because in computing the net present value and the cost-benefit ratio, one must have an estimate of the social opportunity costs of funds—interest or discount rate—in each year of the investment project, and there is no reason to believe that these interest rates are the same in each year of the project (Harberger 1972). In benefit-cost analysis, the size of the ratio is very much affected by the choice of the discount rate used to compute these values.
In developing countries where rates of inflation may be high and variable, it becomes difficult to derive defensible measures of real discount rates. In particular, Evenson (2001) discusses common problems in interpreting benefit-cost ratios for public agricultural research.
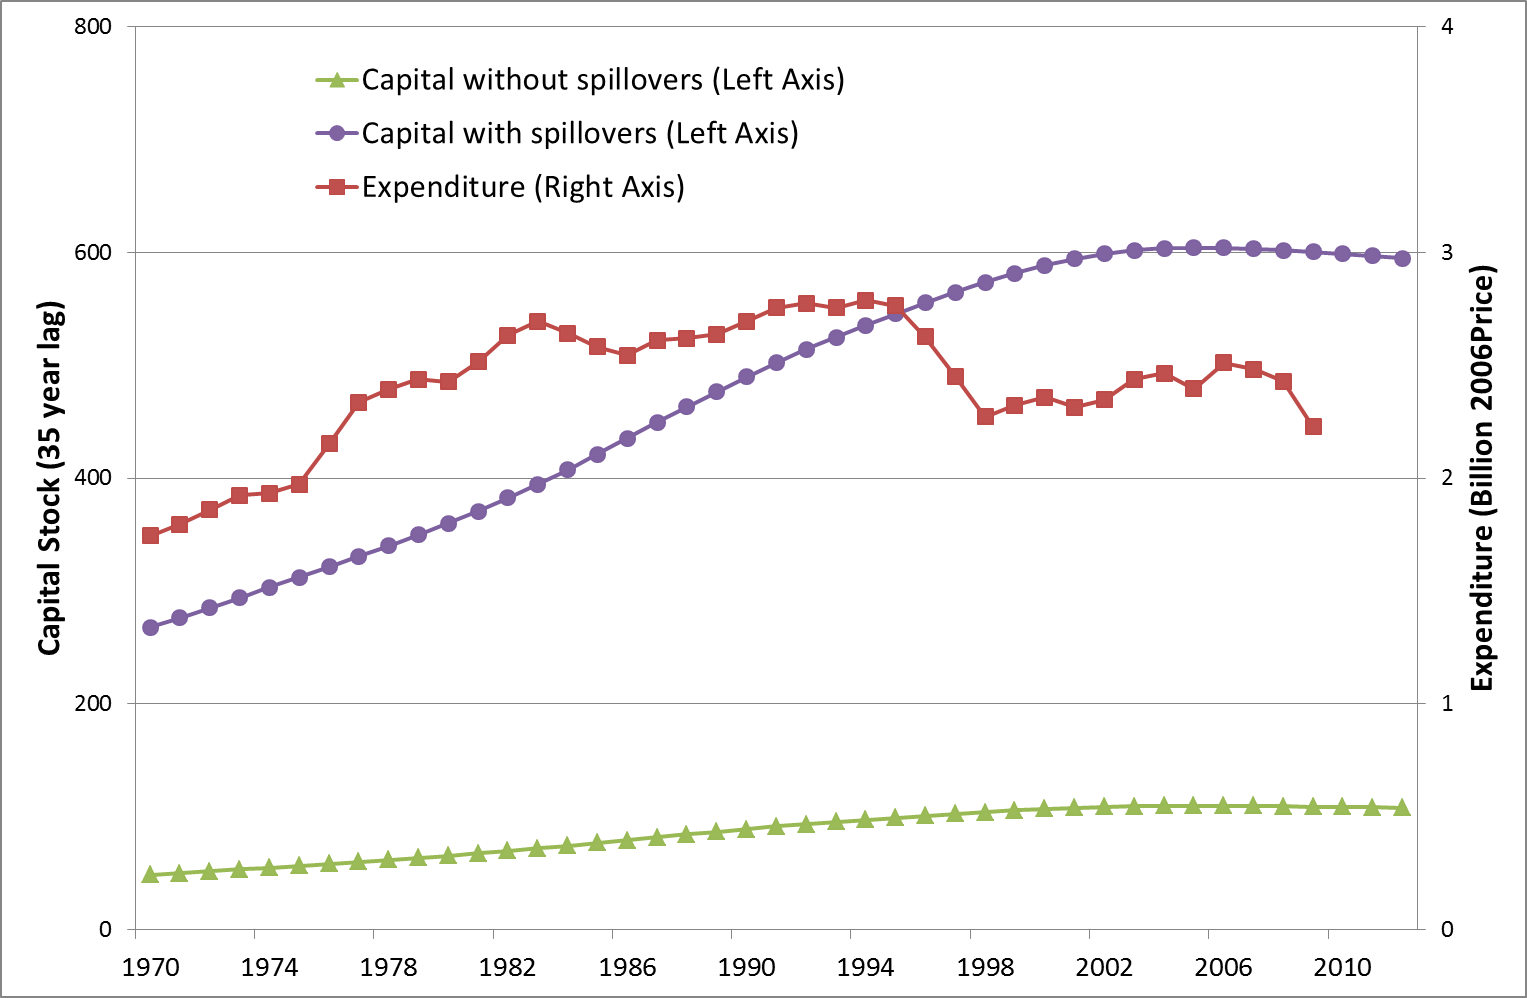
In Figure 1 the green line shows that the total public, productivity-oriented agricultural research capital across the 48 U.S. states—without spillovers—increased slowly from $47 billion in 1970 to $105 billion in 2006, an average rate of increase of 2.2% per year. The smooth path for research capital (green line) relative to research expenditures (red line) is due to the long lags used to construct the research capital variable. After 2006, the U.S. total public agricultural research capital began to decline slowly, being dragged down by the major break in total public agricultural research expenditures a decade earlier. The U.S. total public agricultural research capital across the 48 states, including each state’s spillover component (purple line) is about six times larger than each state’s own contribution (green line). Hence, if public agricultural research expenditures in one state is increased by one dollar, on average, it increases the U.S. total public agricultural research expenditures by an additional five dollars. Given the long research lags for public agricultural research capital and the major break in expenditures in public agricultural research that occurred in the mid-90s and continuing, the public agricultural research capital will continue to decline well into the 21st century.
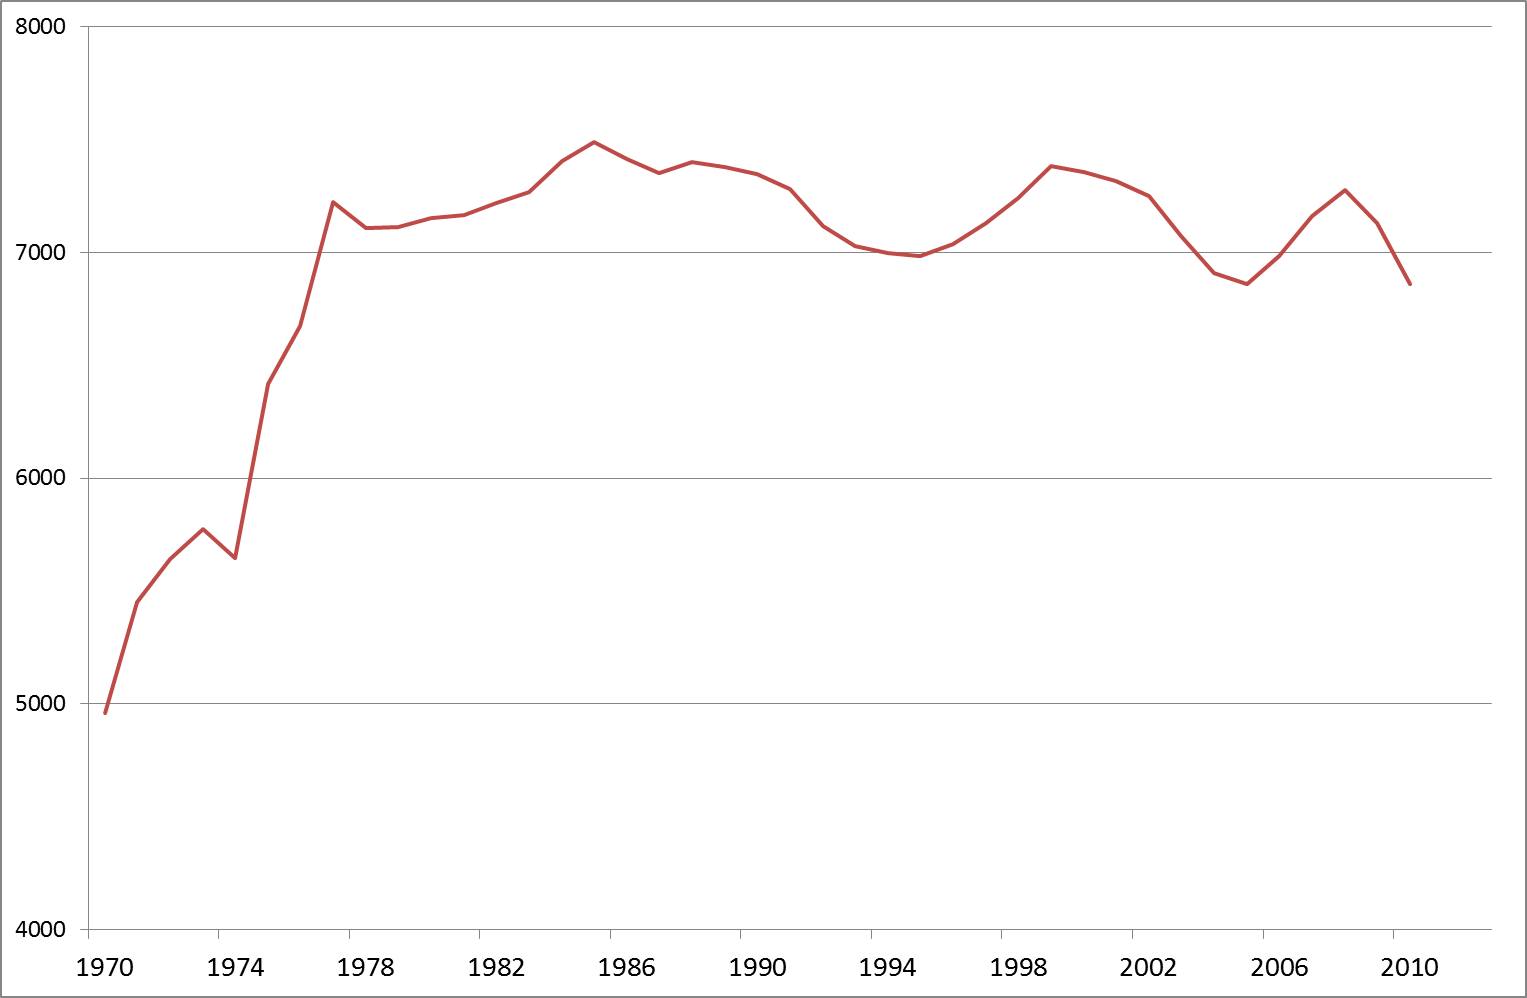
The U.S. total public agricultural extension capital per farm grew very rapidly over 1970-1978 at 4.5% per year (Figure 2). However, over the next 33 years there is no net growth, although there have been short periods when the capital was increasing, for example, 1980-1986, 1996-2000, and 2005-2008. However, each of these short periods of growth have been offset by an almost equal decline. With total lag length being only five years for measuring public agricultural extension capital—versus 35 for public agricultural research capital—downturns in agricultural extension can fairly quickly be reversed by increased expenditures on agricultural extension per farm.
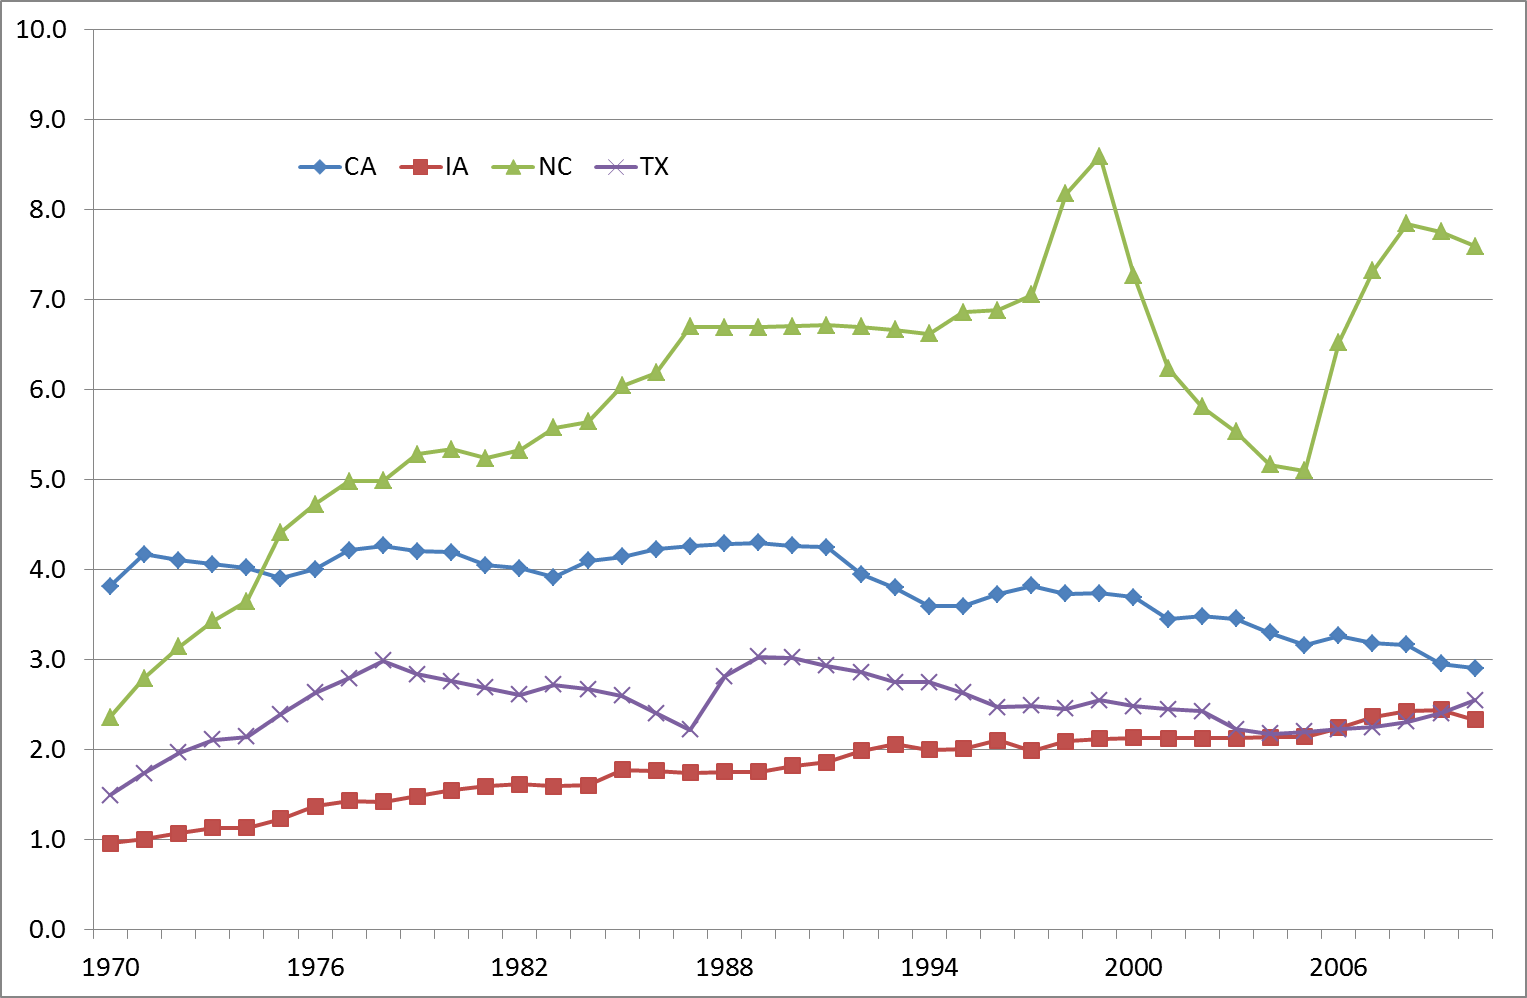
To gain additional perspective on productivity-generating investments in public agricultural research and extension, it is useful to consider four large agricultural states that are in different regions of the country and that differ in products produced: California, Iowa, North Carolina, and Texas. In these states, productivity-oriented public agricultural-research expenditures peaked over the late 1980s and the early to mid-90s (Figure 3a). The peak came earlier in North Carolina (1988), with a later secondary peak in 2005. The peak in California came in 1992, with a later secondary peak in 2005, and the peaks in Texas and Iowa were at the same time as for U.S. total public agricultural research expenditures—1994-1995.
|
Figure 3a: Real Public Agricultural Research, CA, IA, NC, and TX. Expenditures, 1970-2009 (million 2006 dollars)
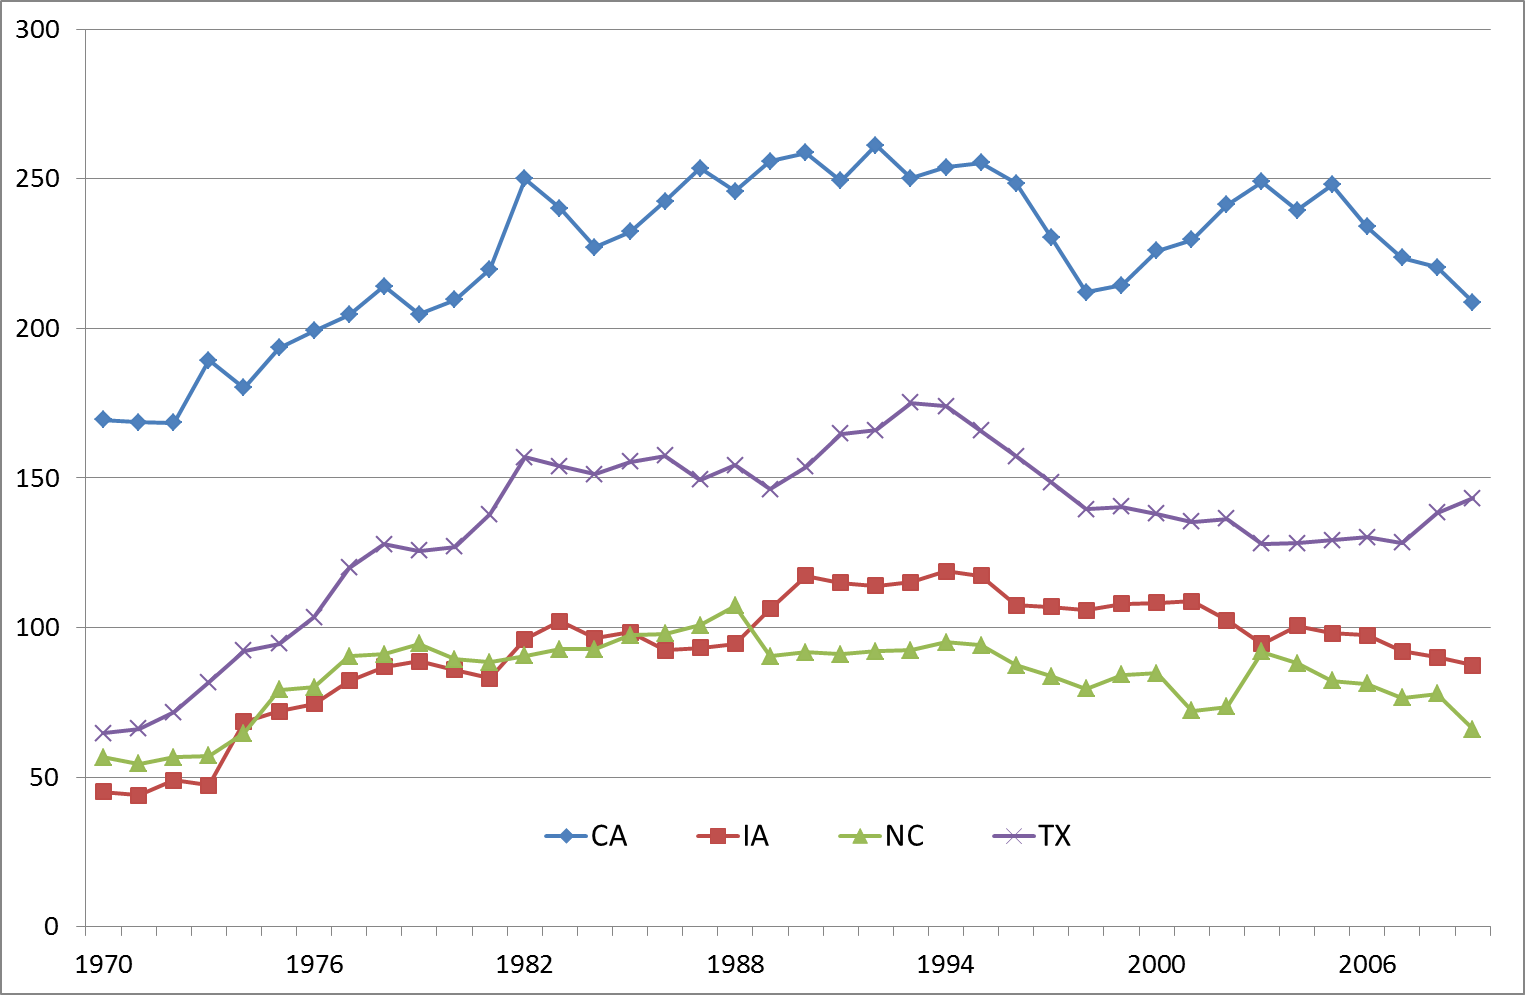
Source: Jin and Huffman (2016). |
Figure 3b: Real Public Agricultural Research, CA, IA, NC, and TX. Capital, without Spillovers (35-year lag), 1970-2011
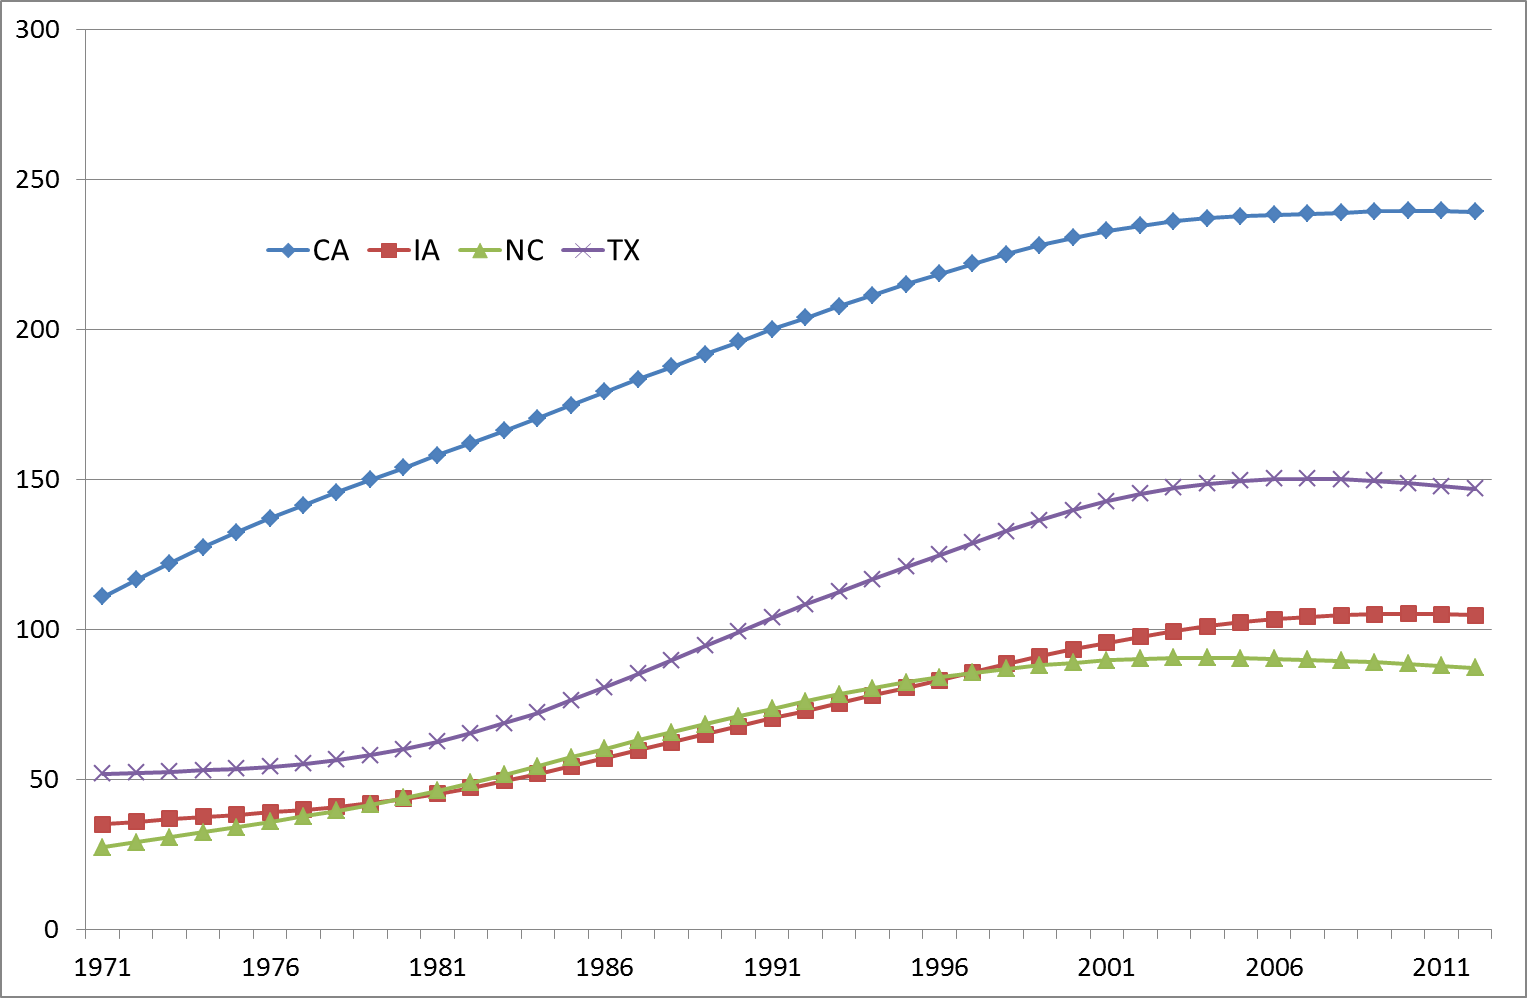
Source: Jin and Huffman (2016). |
With long research lags and most of the benefits coming in middle years, Figure 3b, displays a smooth trend for public agricultural research capital—without spillovers—by state, 1970-2011. In addition, research capital peaks later than expenditures, and after peaking, research capital starts to decline slowly. Public agricultural research capital peaks in Iowa, North Carolina and Texas in 2006, as well as for the U.S. total research capital. Public agricultural extension capital per farm, 1970-2011, is displayed in Figure 4 for the four reference states. Since the lag pattern for construction of extension capital is much shorter than for agricultural research, these series are much more irregular over time.
Using new and updated data and allowing for lags in realizing within state and interstate spillover benefits, Jin and Huffman (2016) provide estimates of the real annual social internal rate of return to investments in productivity-oriented public agricultural research over 1970-2004. They find a rate of 67%. They also report a rate of over 100% for agricultural and natural resource extension. These are large rates of return—for example, relative to a 2-5% return on stocks and bonds—and relative to those reported by other recent studies of a more or less similar nature. Although productivity-oriented public agricultural research is less diverse than total public agricultural research, it remains a heterogeneous mixture of research across a diverse set of agricultural commodities and major input groups and across basic and applied sciences.
Compared to recent studies that have used gross measures of public agricultural research and extension, the estimates of the returns for this study are higher. This is not surprising given that gross measures induce serious measurement errors, which tend to bias estimated benefits downward.
Given the long time lags between costs and benefits for public agricultural research, the decline in the public agricultural research capital starting in the mid-90s will be a drag on U.S. agricultural productivity for more than the first quarter of the 21st century. While the potential losses from that past decline in public research investment cannot be easily recovered, it is uplifting to recognize that more immediate benefits can be obtained from investing in agricultural extension. The importance of investment in agricultural research is widely recognized. Given this unusually large degree of agreement on a public policy issue, perhaps the United States is poised to increase its investment in public agricultural research and extension and thereby ensure a prosperous agricultural sector and continued low food prices for consumers in the future while reducing soil, water, and air pollution.
American Farm Bureau Federation (AFBF). 2016. “AFBF Statement regarding President Obama's Budget.” Available online: http://www.fb.org/newsroom/news_article/395/
Duvall, V. Z. 2016. “Agricultural Research is the Farmer's Ultimate Antacid.” The Hill. Available online: http://thehill.com/blogs/congress-blog/economy-budget/276427-agricultural-research-is-the-farmers-ultimate-antacid
Evenson, R.E. 2001. “The Impacts of Agricultural Research and Extension.” In Gardner, B.L., and Rausser, G.C. (Eds). Handbook of Agricultural Economics Vol. 1A (Agricultual Production). Elsevier, New York, NY, pp. 574-628.
Fuglie, K., and S.L. Wang. 2012. "Productivity Growth in Global Agriculture Shifting to Developing Countries". Choices. Quarter 4. Available online: choicesmagazine.org/choices-magazine/submitted-articles/productivity-growth-in-global-agriculture-shifting-to-developing-countries
Jin, Y. and W. E. Huffman. 2016. “Measuring Public Agricultural Research and Extension and Estimating their Impacts on Agricultural Productivity: New Insights from U.S. Evidence.” Agricultural Economics 47:15-31.
Huffman, W.E. and R.E. Evenson. 2006. Science for Agriculture: A Long-Term, Perspective. Ames, IA: Blackwell Publishing.
United Nations. 2015. “The 2030 Agenda for Sustainable Development.” Available online: https://sustainabledevelopment.un.org/sdg2.
Wang, S.L. 2014. "Cooperative Extension System: Trends and Economic Impacts on U.S. Agriculture". Choices. Quarter 1. Available online: http://choicesmagazine.org/choices-magazine/submitted-articles/cooperative-extension-system-trends-and-economic-impacts-on-us-agriculture
United States Department of Agriculture (USDA). 2015. “ARS Utilization Centers’ 75th Anniversary.” Ag Research Magazine. Oct. Available at: http://agresearchmag.ars.usda.gov/2015/oct/anniversary

