The grain handling and transportation system (GHTS) in Canada is currently going through a major transition, both with respect to handling and transportation. Historically, the system has pitted farmers against the railways with respect to securing individual “fair” shares of grain revenues. But with the removal of the single desk marketing and logistics function of the Canadian Wheat Board (CWB) in late 2012, a very interesting and potentially game-changing outcome is emerging with respect to the new functionality of the grain companies in the Canadian system. While historical awareness of rail’s natural monopoly position in the grain handling system has kept that sector regulated—in several ways—for close to a century, we are now starting to see the effects of a less than competitive Canadian grain handling sector on revenue sharing, along with renewed movement in the industry with respect to buyouts and potential mergers.
Currently, the on-going regulatory instrument used to regulate grain transportation rates in Canada—called the “maximum revenue entitlement” (MRE) or revenue cap—is under debate because of the introduction a few months ago of a modification to an old regulatory instrument known as extended, or reciprocal, interswitching. As opposed to the revenue cap which is a direct intervention on monopoly behavior, extended interswitching is designed to encourage the major Canadian grain carriers to compete with one another and potentially seek out new traffic (Nolan and Skotheim, 2008). But the most intriguing aspect of extended interswitching is how it might allow a major rail carrier from the United States to solicit grain traffic in some areas of the Canadian grain transportation system.
On the grain handling side, as of 2012 without the CWB to co-ordinate and optimize grain movements on behalf of Canadian farmers, grain companies in Canada initially seemed to be patient about assessing individual operational requirements under their new grain supply chains. But similar to the situation in the United States, a bumper crop in 2013-2014 and new problems with rail transportation (White, Carter, and Kingwell, 2015) generated new marketing opportunities for the grain companies that in effect allowed them to secure higher than normal profits. But this took place mostly at the expense of farmers who were induced to hold or store grain that they otherwise would likely have moved under the control of the former CWB. The situation has created increased skepticism about the broader motives of grain companies in Canada to the point where farmers openly wonder if the railways will remain their major adversary in the GHTS as the system moves forward.
Similar to the United States, the development of the Canadian GHTS was part of a nation building process to encourage Western settlement by ensuring that new farmers in the vast hinterland had an available transportation system to facilitate the movement of their grain to export position either on the West Coast or through the Great Lakes. As the rail industry in Canada consolidated through the 1920s down to the two Class 1 railways we have today, considerable focus of transportation policy through the rest of the century was concerned with ensuring that grain movement would not be unduly discriminated against by the rail carriers (Minister of Public Works and Government Services Canada, 2004). It is worth noting that most other freight transportation sectors in Canada had been gradually deregulated through the 1960s and 1970s (including rail for everything but grain), rendering the continued oversight in grain movement a marked contrast to what was going on elsewhere in freight markets.
Through the 20th century, a series of regulated freight rate regimes coupled in most instances with direct government subsidies to grain movement in Canada were eventually brought under serious re-consideration by the Federal government with the 1997 Estey Review of grain transportation (Nolan and Kerr, 2012). The Estey Review process was initiated by the former CWB because of a critical rail service failure on grain movement in the winter of 1996-1997, coupled with continued complaints by both shippers and carriers that the grain transportation regulatory system was broken and had been for a long time.
Among several other changes including the appointment of a formal grain system data monitor, the key regulatory outcome of the Estey review was a new policy consisting of an annually computed maximum revenue entitlement applicable to each railway for their respective movements of specified grains. Beginning in the 2000-2001 crop year, both Canadian National and Canadian Pacific had their grain movements regulated by the computed revenue cap. The structure of the cap uses a base level of required grain movement as well as some accounting for average length of grain haul in the system, coupled with an allowable rail efficiency gain of about 2% per year built in. In addition, if the cap is exceeded by either railway, that railway is fined an amount equal to the excess, plus 15%. Cap breach has actually happened quite frequently, and to date only a single year (2009-2010) had both railways' grain revenue staying below their respective mandated cap levels. While adjusted on a sporadic basis to keep up with developments in the industry, as of 2013-2014 the cap has gradually risen to about 1.5 times what it was in the initial year—now at well over C$600 million per railway.
As the current grain transportation regulatory policy in Canada, the revenue cap was suggested back in 1998 by one of the Class 1 railways as a regulatory alternative to Estey’s actual proposals for improving rail competition and removing rate regulation (which were to implement an open or competitive rail access regime for new entrants). The revenue cap has gradually been embraced by Canadian farmers because freight rates have been relatively consistent and stable under the cap, even with other changes in the system. Freight rates on average movements from 2000 to 2006 actually declined in real terms (from about C$36 to C$35 per metric ton) as the railways gradually adjusted their rate setting under the regime. But grain transportation rates in Canada have risen slowly in recent years, up to an average of approximately C$50 per metric ton as of 2013-2014. What has happened is that the revenue cap effectively induced the railways to seek and operationalize ways to lower their costs to improve profits from grain movements. The railways did this by moving ever longer unit trains as well as favoring, through rate reductions, those grain loading sites that had larger rail sidings to load their longer and more cost efficient trains. But since about 2009 it seems these relatively easy to implement cost reductions in grain movement have been more or less exhausted, and this helps explain why average rates under the cap have been slowly increasing since that time.
Beginning earlier this year, the railways have been making numerous public appeals to have the revenue cap regime removed (Atkins, 2015a). Among other items, their public rationale is that the cap is limiting their ability to invest in more cost effective infrastructure, including new hopper cars. While this is mostly true, the cap is being defended by farmers because in a spatially monopolistic rail market, they don’t want to see rates completely deregulated. There are fears that Canadian grain rates will rise to levels well above current ones and in fact closer to those that can be found in similar regions in the United States—more specifically, the Northern Plains states. While it is sometimes difficult to make such comparisons because the levels and sources of transportation costs and competition are very different, evidence indicates that current applicable U.S. grain rates are at least 20% higher than for similar movements in Canada (USDA, 2015).
As part of yet another review of transportation policy in Canada (Transport Canada, 2011), consideration was again given to grain shipper complaints about rail service, even under the revenue cap. Under the Canada Transportation Act as administered by the Canadian Transportation Agency, there are prescribed several “remedies” for shippers who request rate or service relief that are permissible under the Act.
One of these remedies is known as “extended interswitching”, or equivalently as “reciprocal switching” in the United States. In Canada, the long-standing extended interswitching policy was constrained by a radial limit on the allowable interswitch of just 30 kilometers (km) which is about 18 miles (Grimm and Harris, 1998). What this meant was that while theoretically useful as a means to enforce some competition between separated rail carriers, in practice the policy was almost never used by shippers in Canada who could potentially benefit from it, like grain shippers. However, geographic simulation analysis done by Nolan and Skotheim (2008) showed that the extant Canadian interswitching limits would need to be increased by several orders of magnitude in order to benefit grain shippers in particular, the latter being mostly dispersed across the prairies and often located some distance from an applicable interswitch point between the two Class 1 Canadian railways.
Skotheim and Nolan (2008) identified those interswitching distances for which a given grain shipper would be able to access both Canadian Class 1 railways much more readily than under the existing 30 km limit. Using 2002 grain system data, we estimated potential shipping cost savings under various new interswitching distances, savings which were in the millions of dollars because of the ability of these shippers to access another carrier for transportation. As designed, extended interswitching should not only encourage more competitive freight rates through some actual movements initiated by a competing carrier, but also through simply the threat that this could happen if freight rates are allowed to grow to unreasonable levels. Given the few actual Class 1 carriers in Canada, the new interswitching policy will likely not generate many actual regulated interswitches, but the theoretical ability of shippers to access that second railway should serve to keep grain rates close to average cost levels.
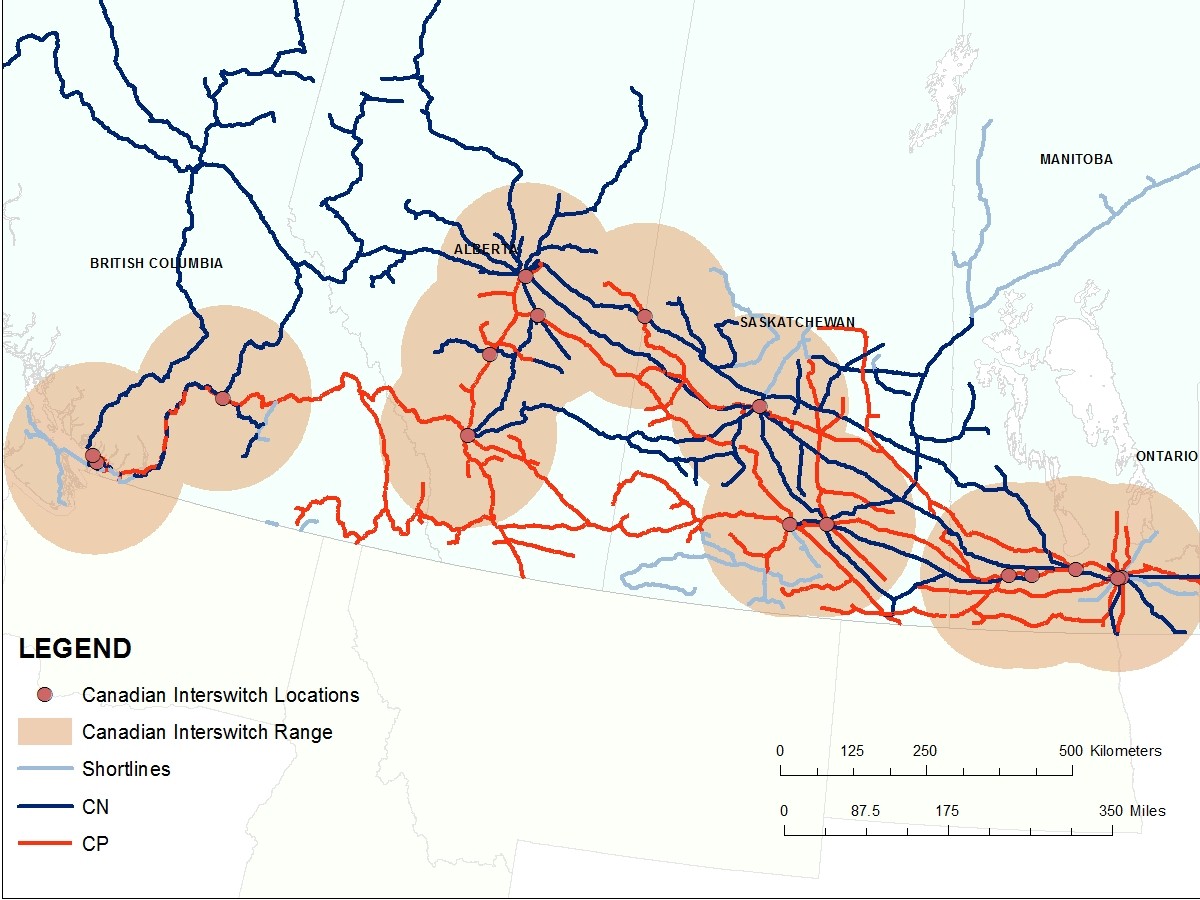
Using the work of Skotheim and Nolan (2008) and assessing the current situation in the grain handling sector, the legislation now being used is based on an interswitching distance of 160 km which is about 95 miles. Figure 1 shows the extent and coverage of the policy under current Canadian regulations. Under the 160 km interswitch range, it is estimated that grain shippers would save between C$15 and C$18 million in freight charges, and that a 160 km interswitch would offer about 70% of all grain elevator locations across the Prairies (by volume) access to the second railway. Given the topology of the rail system in Western Canada, it was clear that a regulated interswitching distance would have to be very large to actually capture all grain shippers in the region. The latter distance falls on the order of over 300 km (180 miles). This would be somewhat onerous on the railways from an operations perspective. Therefore, the 160 km limit seems to be a reasonable compromise, balancing the need for competitive discipline in this market with a manageable distance to complete the transaction.
One more point about extended interswitching as a North American, not just Canadian, policy. As implemented, at least one Class 1 U.S. railway can gain access to some Canadian grain shipments under the new extended interswitching limits. As of the most recent information publicly available, that railway has sought only very limited access agreements into Canada, including accessing the track of one border shipper as well as a Canadian railway located on the border (Canadian Transportation Agency, 2014). So while extended interswitching can give at least one U.S. railway access to Canadian grain shippers over Canadian track (Figure 1), the converse is not the case.
It is worth noting that the Surface Transportation Board in the United States is currently hearing support for implementation of some form of reciprocal switching in the region (Transportation Research Board, 2015). Like Canada, it is being considered primarily as a means to encourage more inter-rail competition in bulk shipping (Szakonyi, 2014). While the exact details of a U.S. version of this are a long way from being worked out, it seems likely that a distance of between 30 and 50 miles would be a starting point for any shipper negotiations with the STB and railway interests.
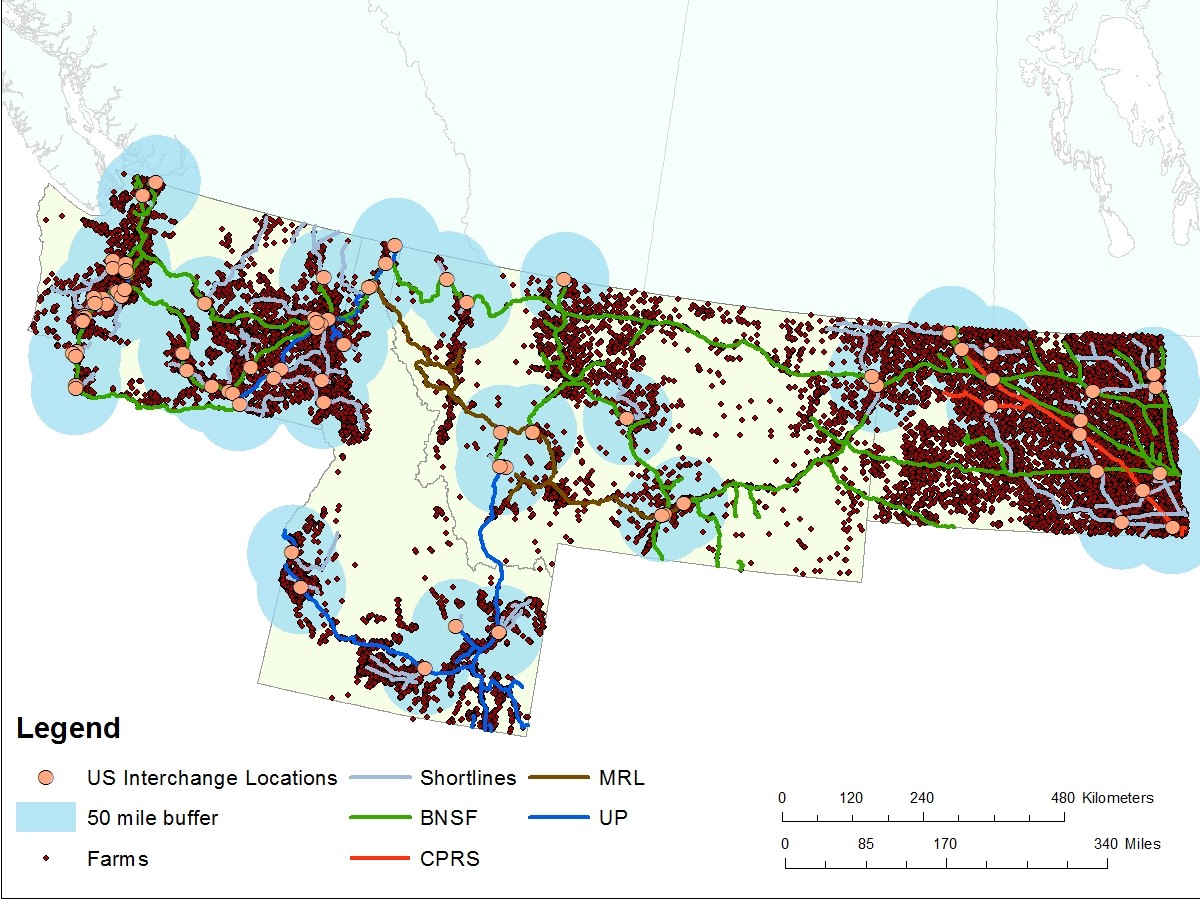
For illustration and by way of comparison, Figure 2 is a hypothetical mapping of potential coverage available under the maximum suggested U.S. reciprocal switching limits, while also including major regional shortline railways as possible switching competitors. Shortlines in Canada are generally considerably smaller than their U.S. counterparts, and partly because of this, in Canada the current extended interswitching limits only apply to Class 1 railways.
Also layered on this map are locations of regional farms, done to give an approximate sense of comparable (to Canada) agricultural cover. The GIS layer shown (taken from Dun and Bradstreet Worldbase data) lists farms producing “oilseeds and grain” as well as “other crops”, so Figure 2 shows all farms in the region that are non-livestock. While overestimating the total number of strictly grain producing farms, compared to Canada, the total likely represents farms that could well be affected by a future reciprocal rail switching policy. While there are just over thirty thousand farms, the map shows that just over 75%, or about 26,000 farms, are contained within the hypothetical reciprocal switching limits. While encouraging, there are still notable regional differences across the four states. We conclude that while large areas of crop production could be positively affected by reciprocal switching as suggested, in fact there are still large areas of regional crop production that would be left unaffected, even under the proposed maximum 50 mile reciprocal switching radius.
As the Canadian GHTS transitioned from the era of the CWB as sole marketer and logistics coordinator to a new era with the grain companies controlling their logistics operations independently, change began gradually. The first crop year of the post-CWB era (2012-2013) was normal or slightly below normal by historical standards, with most aspects of the new GHTS looking the same from a broad system perspective. But like in the United States, the subsequent bumper grain crop year of 2013-2014 precipitated several changes in the system and led not only to temporary heavy-handed regulations on grain movement, but it also showed that grain companies in the new era meant business and were quite willing to put their own profits ahead of farmer welfare or system efficiency.
As in the United States, explanations of the rail system slowdown that started in the fall of 2013 are still debated. The Canadian railways maintained that particular winter was especially rough on their equipment, leading to considerable delays on the operations front trying to assemble trains and deliver grain to the Port of Vancouver. Other issues, including a trucking strike at the Port (Constantineau, 2014) may have also compounded the ability of Canadian railways to move export grain to port in a timely manner. But according to many observers, the growing role of rail in shuttling crude oil throughout North America for refining was the primary reason for the unprecedented delays in grain movement that occurred through the fall and winter of 2013-2014 (Economist Magazine, 2014).
The transportation delays throughout the supply chain eventually led to very high basis levels (for example, the differential between port and on-farm prices) for prairie grain (Gray, 2014). In effect, grain companies were lowering their country bids while still obtaining high port prices to prevent farmers from delivering into the backlogged system. So while basis levels typically only reflect transportation and handling costs, the basis levels achieved during this time were new to the industry, and in many cases 200-300% higher than normal. Gray estimated that this situation and its duration likely cost Canadian producers on the order of C$2 to C$3 billion for the 2013-2014 crop year. Considering the situation from the perspective of the Canadian grain companies, recall that Canadian railways are capped on grain movement revenues, so most if not all of the excess basis would have been retained by the grain companies. Grain companies were notably silent on what was happening during this time of historic basis levels.
On the rail regulatory side, whatever the actual reasons for the on-going grain transportation delays in Canada, the Federal government eventually intervened and on March 7, 2014 enacted the so-called Fair Rail for Grain Farmers Act. While the Act also contained modifications to regulated extended interswitching as described above, as a more temporary measure the Act also mandated that both Class 1 railways move a minimum volume of grain (500,000 metric ton, or approximately 5000 grain hopper cars) each per week in an effort to reduce the enormous grain backlog. If a railway could not meet these requirements, it would be fined for non-compliance. As might be expected, the railways lobbied hard over the next few months to get the volume requirement lifted, but it was finally repealed a year later in March of 2015 (Atkins, 2015b). In spite of this, currently there is still a significant amount of grain carryover in Canada. It will be interesting to see whether or not the falling price of oil will affect the wherewithal of the railways to eliminate the remaining grain backlog in a timely fashion.
Without question, 2013-2014 was a “perfect storm” for grain transportation in Canada and the situation is still in flux. During this time some industry observers highlighted a new situation where the historically trusting relationship between grain companies and farmers, and the historical distrust between farmers and rail companies had been shifted. Without a Canadian Wheat Board to act on their collective behalf and ensure grain grown was grain moved, many farmers found out the hard way that it is not only the railways who will pursue profit maximizing behavior when confronted with a favorable economic situation. The new situation in fact raises a broader question not addressed very often in the modern supply chain literature—how does market power among the players affect revenue distribution in a modern supply chain?
Motivated in part by the evolving grain handling situation in Canada, Cakir and Nolan (2015) developed a model of the grain supply chain that allowed us to simulate the effects of relative market power as exhibited by the players in the chain on the revenues of each of the participants (dividing the revenue pie, so to speak). Building on well-established work simulating market power in vertical markets (Sexton and Zhang, 2001; Sexton et al., 2007), we found that market power exercised by the oligopolistic railways in the supply chain always generated greater overall welfare effects within the supply chain compared to market power exercised by the oligopolistic grain companies. In effect, equal amounts of market power exercised in the rail and grain handling sectors will always generate a revenue distribution favorable to the railways, less so for the grain companies. As might be expected, a competitive farming sector always suffers more than either of the other supply chain participants exercising some degree of market power.
While somewhat intuitive, the analysis would also seem to help explain some important current issues as well as help forecast the future of the Canadian grain supply chain. First, the newfound desire of the railways to have the revenue cap policy completely removed (Atkins, 2015a) after years of relative quiet about it would seem to indicate that the cap was a real constraint on the ability of the railways to extract surplus in the backlogged supply chain from the larger than normal basis. If there was approximately C$2 billion or so “on the table” in 2013-2014 that the railways could not access because of the revenue cap, then it is not surprising they would suddenly want to get the cap removed in case this situation continues or arises again in the near future.
In addition, the analysis would predict that in order to garner the greatest share of available revenue in the grain supply chain with an unregulated oligopolistic rail sector, the grain handling sector in Canada will likely further consolidate. Currently, just three companies in Canada account for 75% of the export grain market (White et al., 2015; AEGIC, 2015). While merger and acquisition activity in the Canadian grain handling sector has been quiet for the past several years, with the recent entry of a major international player on the Canadian scene we expect this sector will once again attempt more mergers and acquisitions over the next 3-5 years as the Canadian grain supply chain continues to find its new long-run equilibrium.
Since railways necessarily possess large economies of scale in bulk movement, railways in Canada have always been regulated with respect to grain transportation. While Canadian rail regulation has changed somewhat over time, recent events have helped to place a new set of regulations on grain movement with the hope that the sector will now be governed by competitive pressures.
The removal of the marketing and logistics functionality of the Canadian Wheat Board in August 2012 was also intended to inject more commercial discipline into the grain handling and transportation system in Canada. While a laudable goal, one issue that was not addressed was whether or not the grain handling industry in fact possesses characteristics of a natural monopoly, potentially resembling the rail sector in organization. If this is the case, the Canadian grain handling sector will likely require some form of new regulatory oversight in grain handling as the industry trends towards its natural equilibrium.
To our knowledge, very little work has been done to estimate the level of scale economies in modern grain handling. While a potentially tricky exercise for today’s complex grain handling business, what past work has been done in other similar jurisdictions is strongly indicative of large economies of scale in the sector (Dagher and Robbins, 1987; Quiggin and Fisher, 1988). While currently mostly unregulated with respect to prices and output, Canadian policy analysts would be wise to keep an eye on merger activity in grain handling and hopefully avoid a “double-duopoly” within this important trade based sector of the Canadian economy. In any case, the evolution of the supporting markets in the GHTS could lead to major changes in the Canadian grain farming sector, likely pushing the economic scale of grain farming to a level even larger than at the present.
Atkins, E. 2015a. “CP Seeks Revenue Bump by Lifting Grain Freight Caps”. Globe and Mail, Feb 6. Available online: http://www.theglobeandmail.com/report-on-business/cp-seeks-revenue-bump-by-lifting-grain-freight-caps/article22848775/.
Atkins, E. 2015b. “Grain Industry Pushing for Market Driven Rail Reform”. Globe and Mail, March 30. Available online: http://www.theglobeandmail.com/report-on-business/canadian-grain-companies-push-for-market-driven-rail-reform/article23697745/.
Bureau of Transport and Regional Economics (BTRE). 2003. Rail Infrastructure Pricing: Principles and Practice. Report 109, BTRE, Canberra, ACT.
Dagher, M. and L. Robbins. 1987. “Grain Export Elevators: An Economies of Size Analysis”, Agribusiness, 3: 169-177.
Economist Magazine. 2014. “Americas View - Canada’s Grain Crisis: Prairie Pile-Up”, March 5.
Cakir, M. and J. Nolan. 2015. “Revisiting Concentration in Food and Agricultural Supply Chains: The Welfare Implications of Market Power in a Complementary Input Sector”, Journal of Agricultural and Resource Economics (in press).
Canadian Transportation Agency. 2014. “Decision No. 16-R-2014. Application by the BNSF Railway Company, Pursuant to Section 93 of the Canada Transportation Act, S.C., 1996 (as amended). Available online: https://www.otc-cta.gc.ca/eng/ruling/16-r-2014.
Constantineau, B. 2014. “Port Metro Vancouver has Record Year for Cargo in 2014 Despite Trucker Strike”. Vancouver Sun, Feb 12. Available online: http://www.vancouversun.com/Port+Metro+Vancouver+record+year+cargo+2014+despite+trucker+strike/10808640/story.html.
Gray, R. 2014. “The Economic Impacts of Elevated Export Basis Levels on Western Canadian Grain Producers. Report submitted to Saskatchewan Wheat Development Commission”. Available online: http://www.saskwheatcommission.com/wp-content/uploads/2015/01/CTA-Submission.pdf.
Grimm, C. and R. Harris. 1998. “Competition Access Policies in the Rail Freight Industry, with Comparisons to Telecommunications”. Ch. 7 in Opening Networks to Competition: The Regulation and Pricing of Access, edited by D. Gabel and D. Weiman, Kluwer Academic Publishers, Boston, MA.
Minister of Public Works and Government Services Canada. 2004. “100 Years at the Heart of Transportation: A Centennial Historical Perspective of the Canadian Transportation Agency and its Predecessors”, Ottawa, ON.
Nolan, J. and J. Skotheim. 2008. “Spatial Competition and Regulatory Change in the Grain Handling and Transportation System in western Canada”, Annals of Regional Science, 42: 929-944.
Nolan, J. and W. Kerr. 2012. “The Estey Review’s Contribution to Transportation Policy”, Journal of International Law and Trade Policy, 13: 242-262.
Quiggin, J. and B. Fisher. 1988. “Market and Institutional Structures in the Grain Handling Industry: An Application of Contestability Theory”, Ch. 6 in The Australian Grain Storage, Handling and Transport Industries: An Economic Analysis, edited by B. Fisher and J. Quiggin, Research Report No. 13, Dept. of Agricultural Economics, University of Sydney.
Sexton, R.J., and M. Zhang. 2001. “An Assessment of the Impact of Food Industry Market Power on U.S. Consumers”, Agribusiness, 17: 59–79.
Sexton, R.J., I. Sheldon, S. McCorriston, and H. Wang. 2007. “Agricultural Trade Liberalization and Economic Development: the Role of Downstream Market Power”, Agricultural Economics. 36: 253–270.
Szakonyi, M. 2014. “Railroads, NITL Clash Over Reciprocal Switching Proposal”, Journal of Commerce, March 25. Available online: http://www.joc.com/rail-intermodal/class-i-railroads/association-american-railroads/railroads-nitl-clash-over-reciprocal-switching-proposal_20140325.html.
Transport Canada. 2011. “Rail Freight Service Review, Final Report. TP 15042”, Government of Canada, Minister of Transport, Ottawa, ON.
Transportation Research Board (2015) “Modernizing Freight Rail Regulation: Committee for a Study of Freight Rail Transportation and Regulation”, Special Report 318, available online: http://onlinepubs.trb.org/onlinepubs/sr/sr318.pdf
United States Department of Agriculture. 2015. “National Agricultural Statistics Service”, Grain Transportation Report, March 26.
White, P., C. Carter and R. Kingwell. 2015. “The Puck Stops Here! Canada Challenges Australia’s Grain Supply Chains”, Research Report, Australian Export Grains Innovation Centre (AEGIC), Perth, Australia.

