The decennial census is an important national enumeration process that impacts livelihoods of households as well as community and regional welfare. Conducted every 10 years since 1790, it determines the number of people living in the United States, as mandated by Article 1, section 2 of the U.S. Constitution and Title 13 of the U.S. code (U.S. Census Bureau, 2019a). Along with other census-based data collection programs, it is used by numerous government programs that support education, employment, health, housing, energy, transportation, telecommunication, financial, and environmental activities. Decennial census data are used for accurate
This study reviews the key datasets and distribution of community development federal funds that rely on census data. We also discuss the impact of demographic changes and accuracy on funding for community development programs across the United States, including a case study presentation of how census-based poverty estimates influence the distribution of funding for the Expanded Food and Nutrition Education Program (EFNEP) program.
Decennial census miscounts and undercounts will result in flawed data estimates and cause a social equity problem (O’Hare, 2019) that has a profound impact on local, state, and national economies. A recent study by Elliott et al. (2019) indicates that the 2020 Census could potentially undercount the U.S. population by 0.27%–1.22%, which translates to between 900,000 and 4 million people. Miscounts may disproportionately affect some groups more than others. While white, non-Hispanic people have only a 0.03% risk of being undercounted, African American and Hispanic populations could be undercounted by 3.68% and 3.57%, respectively. Other hard-to-count populations are rural populations, renters, ethnic and racial minorities, and immigrants (Kane-Willis et al., 2019). Children under the age of 5 have a high risk of being undercounted by up to 6.31% (Elliott et al., 2019; Potyondy, 2017). While these percentages seem relatively small, such miscounts and undercounts can substantially impact a community’s future for a decade or longer.
Funds not received by a county due to an undercount are given to other states and regions. For example, in FY 2017, Title I programs, which provide financial assistance to local education agencies with relatively high percentages of children from low-income families, lost an estimated $1,700 per missed person (Reamer, 2019b). In FY 2015, the median loss per missed person on funds received from the U.S. Department of Health and Human Service was estimated to be $1,091. Many of the 37 states forfeited substantial funds, with losses ranging from $533 to $2,309 per missed person (Reamer, 2018b).
The allocation of federal funds is highly sensitive to the accuracy of the decennial census. Inaccuracies in enumeration can occur due to a number of reasons, the foremost among which include (Chapin, 2018)
Increased citizen participation to an online census survey, available in the upcoming census, may result in better estimates. Factoring in risk scenarios on miscounts, undercounts, and inaccuracies based on historical data (Elliott et al., 2019) at planning, developing, and implementation phases of community development programs will reduce potential losses to vulnerable communities.
Agencies responsible for Census-Derived Datasets:
OMB - Office of Management and Budget, White House
BLS - Bureau of Labor Statistics, Department of Labor
HUD - Department of Housing and Urban Development
ERS - Economic Research Service, Department of Agriculture
NCHS - National Center for Health Statistics, Department of
Health and Human Services
BEA - Bureau of Economic Analysis, Department of Commerce
Census - Census Bureau, Department of Commerce
Source: (Reamer, 2018)
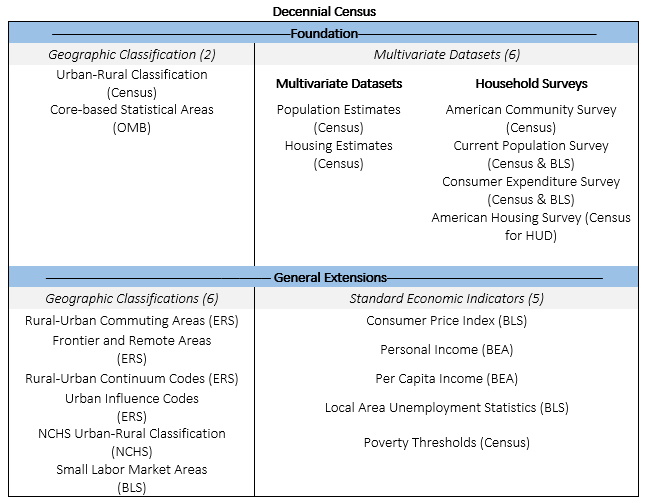
Since the decennial census is only conducted once every decade, the U.S. Congress approved development of up-to-date and detailed datasets derived from the decennial census called census-derived datasets. There are 52 census-derived datasets that assist with geographic allocation of federal funds. Figure 1 reports the 8 foundational and 11 general datasets that comprise the decennial census. (An additional 33 program-specific datasets are further extensions of these 19 datasets, as explained by Reamer, 2018a.)
Based on decennial population density, the Census Bureau provides an urban–rural classification of all census tracts (Figure 1). Using the Urban-Rural Classification, American Community Survey and Population Estimates, the nation’s Core-Based Statistical Areas are delineated as metropolitan and micropolitan areas (Reamer, 2018a).
Five of the six geographical classification datasets (Rural–Urban Commuting Areas, Rural–Urban Continuum Codes, Urban-Influence Codes, Frontier and Remote Areas, Urban–Rural Classification) are associated with differentiating rural areas on the level of rurality or the adjacency to a city (Figure 1). Small Labor Market Areas make up the balance of the United States that is grouped in to one or more counties that are not major labor market areas (metropolitan and micropolitan areas) (Reamer, 2018a).
Population Estimates and Housing Estimates are updated annually with population and housing numbers based on vital statistics and tax records (Figure 1). The demographic information that is not collected in the decennial census is collected through the four survey datasets related to households: American Community Survey, Consumer Expenditure Survey, Current Population Survey, and American Housing Survey (Reamer, 2018a).
The Consumer Price Index, Personal Income, Local Area Unemployment Statistics, Per Capita Income, and Poverty Thresholds serve as the five standard economic indicators related to prices, income, employment, and poverty (Figure 1).
Several census datasets are relevant for determining eligibility for and equitable distribution of federal funds (Reamer, 2018a):
The primary uses of the decennial census are to allocate political power through seat apportionment (Burnett, 2011); distribute federal funds; assist in civil rights enforcement, business, and community planning efforts; provide population estimates and projections; provide weights for sample surveys; and, in general, support economic and social research activities (O’Hare, 2019).
Federal financial assistance based on census-derived datasets supports domestic programs listed in the Catalog of Federal Domestic Assistance (CFDA):
Federal financial assistance programs are dependent on the U.S. Census Bureau data for (Hotchkiss and Phelan, 2017)
| CFDA | USDA Program | Type of Federal Assistance | Role of Census-Derived Datasets |
| 10551 | Supplemental Nutrition Assistance Program | Direct payment | Eligibility |
| 10.410 | Very low to moderate income housing loans | Direct loans and loan guarantees | Eligibility and allocation formula |
| 10.555 | National School Lunch Program | Grants | Eligibility |
| 10.557 | Women, Infants, and Children Program | Grants | Eligibility and allocation formulas |
| 10.553 | School Breakfast Program | Grants | Eligibility and selection preference |
| 10.850 | Rural Electrification Loans and Loan Guarantees | Direct loans and loan guarantees | Eligibility and selection preference |
| 10.558 | Child and Adult Care Food | Grants | Eligibility |
| 10.766 | Community Facilities Loans/Grants | Direct loans and loan guarantees | Eligibility and selection preference |
| 10.760 | Water and Waste Disposal Systems for Rural Communites | Grants, direct loans, and loan guarantees | Eligilbility, allocation formula and interest rates |
| 10.427 | Rural Rental Assistance Payments | Direct payments | Eligibility and selection preference |
| 10.768 | Business and Industry Loans | Loan guarantees | Eligibility and selection preference |
| 10.500 | Cooperative Extension Service | Grants | Allocation formula |
Table 1 presents the USDA’s community development programs, types of federal assistance, and the role of census-derived datasets.
In 1999, the General Accounting Office reported that 22 federal programs used decennial census data to allocate $167 billion (U.S. GAO, 1999). Blumerman and Vidal (2009) indicated that 140 federal programs used census data to distribute approximately $446.4 billion in FY 2007. By 2008, 215 federal programs reportedly used census data to allocate $446.7 billion in federal funds (Carpenter and Reamer, 2010). In 2016, 325 federal programs distributed $883 billion based on Census Bureau data (Reamer, 2019a). In 2017, census-derived data was used to distribute $1.5 trillion in federal funds, which represents 7.8% of the national gross domestic product (Reamer, 2019c). With the upcoming 2020 Census, newer and updated census data are essential for federal fund distribution.
Over the years, as the U.S. population grew to 309 million (2010), the federal funds allocated to states, communities, and households have steadily grown in nominal terms from $200 billion (FY 2003) to $1.5 trillion (FY 2017).
The ability to anticipate and recognize change within a community is vital for the future of community development programs. Population estimates indicate areas of growth or decline, while demographic data provide information in the areas of basic demographic (age, gender, race); social (education, marital status, household numbers); economic (income, poverty, employment); and housing (tenure, type, value) issues. For example, the Current Population Survey, a collaborative effort between the U.S. Bureau of Labor Statistics and the U.S. Census Bureau, provides information on labor force statistics. Such detailed data are vital to understanding and, hence, tailoring education programs for a community, for CES, and for other community-based programs. Without demographic information, creating culturally inclusive programming based on community participation and feedback would be impossible.
For specific information relating to families, the Census Bureau’s American Community Survey (ACS) can be valuable. This information provides specifics on family types and characteristics, which are especially beneficial when working with family and consumer sciences or community youth. The ACS also provides information on educational attainment (levels of education). When working with agriculture clientele, which is a major portion of CES efforts, the USDA Census of Agriculture is conducted every five years and provides data pertaining to farming families (race, age, gender) as well as hired migrant labor.


Figure 2 presents the distribution of $120 billion in federal funds to community development programs based on U.S. Census data in FY 2016. While a majority of these funds (77%) were allocated to food and nutrition programs, 15.2% of the funds supported housing programs, 7.4% helped build infrastructure and support businesses, and 0.4% were provided to CES programs.
Between food and nutrition programs, $66.3 billion (55% of funds) was allocated to the Supplemental Nutrition Assistance Program, followed by $12 billion (10%) to the National School Lunch Program. About $6.4 billion (5%) of the funds were allocated to the Women, Infants, and Children Program, followed by $4.1 billion (4.4%) to the School Breakfast Program and $3.3 billion (3%) to the Child and Adult Care Food Program (Reamer, 2019a).
Among programs related to housing, $16.9 billion (14% of funds) were allocated to very low to moderate income housing loans and $1.3 billion (1%) to rural rental assistance programs (Reamer, 2019a).
Amid programs supporting infrastructure and businesses, $3.8 billion (3% of funds) were allocated to rural electrification programs, $2.4 billion (2%) to community facilities programs, $1.6 billion (1%) to water and wastewater disposal systems for rural communities, and $1.27 billion (0.9%) to provide loans to business and industry (Reamer, 2019a).
CES programs were provided $459 million (0.4% of funds) to support educational programs in communities across the United States. (Reamer, 2019a). Inaccurate census data leads to poor community-level planning decisions and poor recommendations for community development strategies.
The CES, with the help of the National Institute of Food and Agriculture (NIFA), is tasked with conveying the knowledge gained at the research level to the public and putting it into practice. Operated through the land-grant university system, the CES works as a federal partner to state and local governments to address national priorities through the allocation of grants and program oversight. Research is conducted at the university level by expert faculty members; county-based educators relay that information to the public to solve a variety of local problems, concerns, and hardships. In return, the agents collect input about current issues and transfer that information to the university, enabling research faculty to create priorities for future studies. As agricultural and environmental challenges are increasing and public needs are growing (Hoag, 2005), CES is a key part of the solution.
CES funding was established by the Smith-Lever Act (1914) to provide educational programs that use scientific knowledge to address the challenges of agriculture and rural communities (Coppess et al., 2018). About two-thirds of the federal funding is formula-based for CES activities. The first 20% of the Smith-Lever funds are divided equally among all the states. An additional 40% is allocated to states based on the proportion of rural population, as determined by the decennial census, and the remaining 40% is allocated to states based on the proportion of the farm population, as determined by the decennial census. Historically, federal funds constituted one-third of the funding for CES, with another third supported by state funding and the final third from local funding (Franz and Townson, 2008). Federal statute requires every federal dollar to be matched by nonfederal sources. In the recent years, the cost-share has ranged from 10%–70% from federal, state, and local sources depending on funding availability (Franz and Townson, 2008).
The CES was allocated $458.8 million in FY 2016 (Reamer, 2019a). Figure 3 illustrates the geographical distribution of these funds. Texas ($26.2 million), North Carolina ($22.6 million), and Ohio ($18.6 million) received the most funding. Many states in the northeast and southern United States received funds greater than $14 million.
The District of Columbia ($1.3 million), Rhode Island ($1.7 million), and Hawaii ($1.8 million) received less than $2 million in support of CES programs (Reamer, 2019a). Many states in the western United States received more than $3 million for such programs, with the exception of Nevada, Wyoming, Alaska, and Hawaii.
In the FY 2016, each state received an average of $1.44 in CES funds per capita. North Dakota ($6.40 per capita), Delaware ($5.69 per capita), and South Dakota ($5.54) received the most, while California ($0.26 per capita), New Jersey ($0.46 per capita) and Florida ($0.55 per capita) received the least.
First initiated in 1968, the Expanded Food and Nutrition Education Program (EFNEP) is a formula-funded program administered by NIFA. Land-grant universities administer the program in all 50 U.S. states, the District of Columbia, and six U.S. territories. EFNEP personnel focus on diet quality and physical activity, food resource management, food safety, and food security, encouraging lower-income individuals to make better choices.
EFNEP serves as an example of how census data can influence the fund distribution in land-grant-based CES programs and, by extension, other types of federal funding that go to states and counties. EFNEP state allocations are driven by a complicated formula based on poverty-level-adjusted FY 1981 allocation for 1862 land-grant universities, poverty-level-adjusted FY 2007 allocations for 1890 land-grant universities, $100,000 for each 1862 and 1890 land grant, and an allocation of remaining funds based on the relative size of the population living at or below the 125% poverty level based on the most recent decennial census (in part on adjustment to funding levels received in 2007) (U.S. Department of Agriculture, 2018).
| Multiple R | 0.918 | |||
| R Square | 0.842 | |||
| Adjusted R Square | 0.836 | |||
| Standard Error | 391,748.50 | |||
| Variable | Beta | Standard Error | T-Value | Probability |
| Intercept | 294,593.50 | 77,500.40 | 3.80 | 0.00040 |
| Poverty Rate | 0.5578 | 0.03959 | 14.09 | 0.00000 |
| 1890 Dummy | 559,896.80 | 116,780.30 | 4.79 | 0.00002 |
We used FY 2019 EFNEP funding by state and 2017 estimates of the number of individuals below the 125% poverty level at the state level (U.S. Census, 2019b) in a regression analysis to examine the influence of census-based poverty estimates on EFNEP funding levels. The analysis shows the impact of undercounting the poor (as defined here) in funding levels for this program and, hence, serves as an example of how census counts can influence fund distribution. Because of the increased funding for states with an 1890 land grant, we also included an 1890 school dummy variable in the analysis. Total EFNEP funding for FY 2019 is $67.4 million, with averaging funding per state (including the District of Columbia and Puerto Rico) at $1.3 million; our analysis accounted for 61.9 million poor individuals, with a per state average of 1,189,616 individuals. Based on our analysis, one additional poor person leads to an increase in EFNEP funding of $0.56 (Table 2). On average, a 10% increase in the estimated number of poor at the state level would result in an increase of $66,349 in EFNEP funding. Hence, census estimates regarding the number of poor people definitely matter in determining the distribution of funding for this program.
This study presented the federal census datasets that are key to funding community development programs across United States and the mechanism through which funds are allocated. Spatial and temporal trends of federal funding were presented as a result of demographic changes.
The decennial census is a single opportunity to impact federal programs every 10 years. The U.S. Census Bureau has the responsibility to accurately estimate the U.S. population, an estimate that will in turn impact households, communities, states, and the nation. Undercounts or miscounts can significantly impact vulnerable population across communities, as demonstrated in the case study. Factoring in undercounts or miscounts in community planning may alleviate economic losses.
CES programs across the nation can play a crucial role through education and outreach programs about the importance of participation in the decennial census and aid in the accurate count of people and households. An accurate census and increased citizen participation will ensure fair and equitable distribution of funds to support food and nutrition programs, rural housing, rural infrastructure, and CES programs across the United States.
Blumerman, L.M., and P.M. Vidal. 2009. Uses of Population and Income Statistics in Federal Funds Distribution—with a Focus on Census Bureau Data. Washington, DC: U.S. Census Bureau, Government Divisions Report Series, Research Report #2009-1.
Burnett, K.D. 2011. Congressional Apportionment. Washington, DC: U.S. Census Bureau, 2010 Census Brief C2010BR-08, November.
Carpenter, R.B., and A. Reamer. 2010. “Counting for Dollars: The Role of the Decennial Census in the Distribution of Federal Funds.” Brookings Institute Metropolitan Policy Program. Available online: https://www.brookings.edu/research/counting-for-dollars-the-role-of-the-decennial-census-in-the-distribution-of-federal-funds/.
Chapin, M.M. 2018. 2020 Census: Counting Everyone Once, Only Once, and in the Right Place: A Design for Hard to Count Populations. Washington, DC: U.S. Census Bureau. Available online: https://www2.census.gov/programs-surveys/decennial/2020/program-management/pmr-materials/10-19-2018/pmr-hard-to-count-2018-10-19.pdf?
Coppess, J., C. Zulauf, N. Paulson, and G. Schnitkey. 2018, August 23. “Farm Bill Food for Thought: Research and Extension.” Farmdoc daily (8):158. Department of Agricultural and Consumer Economics, University of Illinois at Urbana-Champaign.
Curtis, K.J., D. Veroff, B. Rizzo, and J. Beaudoin. 2012. “Making the Case for Demographic Data in Extension Programming.” Journal of Extension 50(3).
Elliott, D., R. Santos, S. Martin, and C. Runes. 2019. “Assessing Miscounts in the 2020 Census.” Washington, DC: The Urban Institute, Center on Labor, Human Services, and Population. Research Report. Available online: https://www.urban.org/sites/default/files/ publication/100324/assessing_miscounts_in_the_2020_census.pdf
Franz, N.K., and Townson, L. 2008. “The Nature of Complex Organizations: The Case of Cooperative Extension.” New Directions for Evaluation 120: 5–14.
Hoag, D.L. 2005. “Western Agricultural Economics Association Presidential Address: Economic Principles for Saving the Cooperative Extension Service.” Journal of Agricultural and Resource Economics 30 (3): 397-410.
Hotchkiss, M., and J. Phelan. 2017. Uses of Census Bureau Data in Federal Funds Distribution. Washington, DC: U.S. Census Bureau. Available online: https://www.census.gov/library/ working-papers/2017/decennial/census-data-federal-funds.html
Kane-Willis, K., S. Schmitz-Bechteler, S. Metger, and K. Nulter. 2019. The Economic and Political Impact of the 2020 Census on Illinois Urban Institute. Chicago, IL: Chicago Urban League Research and Policy Center. Available online: https://chiul.org/wp-content/uploads/2019/05/Money-and-Power-Census-Brief-5.7.19.pdf
Kulzick, R., L. Kail, S. Mullenax, H. Shang, B. Kriz, G. Walejko, M. Vines, N. Bates, S. Scheid, and Y.G. Trejo. 2019. 2020 Census Predictive Models and Audience Segmentation Report. Washington, DC: U.S. Census Bureau. Available online: https://www2.census.gov/programs-surveys/decennial/2020/program-management/census-research/predictive-models-audience-segmentation-report.pdf
National Conference of State Legislatures. 2019. “Number of Legislators and Length of Terms in Years.” Available online: https://www.ncsl.org/research/about-state-legislatures/number-of-legislators-and-length-of-terms.aspx
O’Hare W.P. 2019. “The Importance of Census Accuracy: Uses of Census Data.” In W.P. O’Hare (ed.) Differential Undercounts in the U.S. Census. Springer Briefs in Population Studies. Dordrecht, Netherlands: Springer, pp. 13–24.
Potyondy, P.R. 2017. “What You Need to Know about the 2020 Census.” LegisBrief 25(42). Washington, DC: National Conference of State Legislatures. Available online: http://www.ncsl.org/documents/legisbriefs/2017/lb_2542.pdf.
Reamer, A. 2018a. Census-Derived Datasets Used to Distribute Federal Funds. Washington, DC: George Washington University, GW Institute of Policy, Counting for Dollars 2020: Report #4”. Available at: https://gwipp.gwu.edu/sites/g/files/zaxdzs2181/f/downloads/ Counting for Dollars #4 Census-derived Datasets rev 05-19.pdf
Reamer, A. 2018b. The Role of the Decennial Census in the Geographical Distribution of Federal Funds. Washington, DC: George Washington University, GW Institute of Policy, Counting for Dollars 2020: Report #2. Available online: https://gwipp.gwu.edu/sites/ g/files/zaxdzs2181/f/downloads/GWIPP Reamer Fiscal Impacts of Census Undercount on FMAP-based Programs 03-19-18.pdf.
Reamer, A. 2019a. Fifty-Five Large Federal Census-Guided Spending Programs: Distribution by State. Washington, DC: George Washington University, GW Institute of Policy, Counting for Dollars 2020: Report # 5. Available online: https://gwipp.gwu.edu/sites/g/ files/zaxdzs2181/f/downloads/Counting Dollars Brief #5 May 2019.pdf.
Reamer, A. 2019b. The Role of the 2020 Census in Distributing Federal Funds to Metro Washington. Presentation at Interventions That Work: 2020 Census & Hard-to-Reach Communities, Washington, DC, June 6. Available online: https://gwipp.gwu.edu/ sites/g/files/zaxdzs2181/f/downloads/Reamer MWCOG Census 06-06-19 rev3.pdf.
Reamer, A. 2019c. Comprehensive Accounting of Census-Guided Federal Spending (FY2017). Washington, DC: George Washington University, GW Institute of Policy, Counting for Dollars 2020: Report #7. Available online: https://gwipp.gwu.edu/sites/g/files/ zaxdzs2181/f/downloads/Counting for Dollars 2020 Brief 7A - Comprehensive Accounting.pdf.
Snyder, T.D., C. de Brey, and S.A. Dillow. 2019. Digest of Education Statistics 2018. Washington, DC: U.S. Department of Education, National Center for Education Statistics. Available online: https://nces.ed.gov/pubs2020/2020009.pdf.
U.S. Census Bureau. 2019a. “Census in the Constitution.” Washington, DC: U.S. Census Bureau. Available online: https://www.census.gov/programs-surveys/decennial-census/about/census-constitution.html.
U.S. Census Bureau. 2010. “Total Population, Decennial Census.” American FactFinder. Washington, DC: U.S. Census Bureau. Available online: https://data.census.gov/cedsci/table?q=Total%20Population%20in%20the%20United%20States&hidePreview=false&tid=ACSDT5Y2010.B01003&vintage=2010.
U.S. Census Bureau. 2019b. “American Community Survey, Five Year Average Estimates, Individuals at the 125% or Below Poverty Level.” Washington, DC: U.S. Census Bureau. Available online: https://data.census.gov/cedsci/table?q=poverty%20level&tid=ACSST1Y2018.S1701&t=Poverty&vintage=2018
U.S. Department of Agriculture. 2018. Expanded Food and Nutrition Education Program (EFNEP) 2019 Request for Applications. Washington, DC: U.S. Department of Agriculture, National Institute of Food and Agriculture. Available online: https://nifa.usda.gov/sites/default/files/resource/FY 2019 EFNEP Capacity RFA.pdf
U.S. General Accounting Office. 1999. Formula Grants: Effects of Adjusted Population Counts on Federal Funding to States. Washington, DC: U.S. Government Printing Office, GAO/HEHS 99-69, February.
Zimmerman, J.N., and D. Kahl. 2018. “Finding Publicly Available Data for Extension Planning and Programming: Developing Community Portraits.” Journal of Extension 56(3).

