Contracts are widely used to govern the production and marketing of agricultural commodities. They can be an essential tool for managing risks; contracts provide incentives for farmers to invest in specialized equipment and skills and to produce products with desirable attributes; and they can allow processors to realize economies of scale and throughput in production, thus realizing lower costs. These are all offered as attributes of contracts when compared to one alternative, a spot market. Compared to another alternative—vertical integration—contract production retains greater profit incentives for grower effort, on-farm diversification, and the use of localized knowledge.
The U.S. Department of Agriculture's (USDA) Agricultural Resource Management Survey (ARMS), is a widely used source of data on contracts. The ARMS, which is jointly administered by the Economic Research Service (ERS) and the National Agricultural Statistics Service (NASS), is a comprehensive multi-purpose annual survey of farms. It features a large sample, selected anew each year, designed to be representative of all farms in the 48 contiguous states. The multi-purpose nature of the ARMS affects the way contract agriculture data are collected. ERS reports summary statistics on contracting on the agency website and in a series of reports (MacDonald and Korb, 2011).
ARMS questionnaires are initially mailed out to respondents, who need clear, precise, and concise instructions. Agricultural contracts are defined in the ARMS as agreements reached before harvest, or before the end of a production cycle for livestock, that specify a commodity, a compensation scheme, and a buyer. The timing matters for measurement, because farmers may often put a harvested commodity into storage, and then reach a sale agreement with a buyer. In ARMS, that is a cash sale, because the agreement was reached after harvest.
Two types of contracts, marketing and production, are defined in the questionnaire. Production contracts specify services to be provided by a farmer for a contractor who owns the commodity while it is being produced.
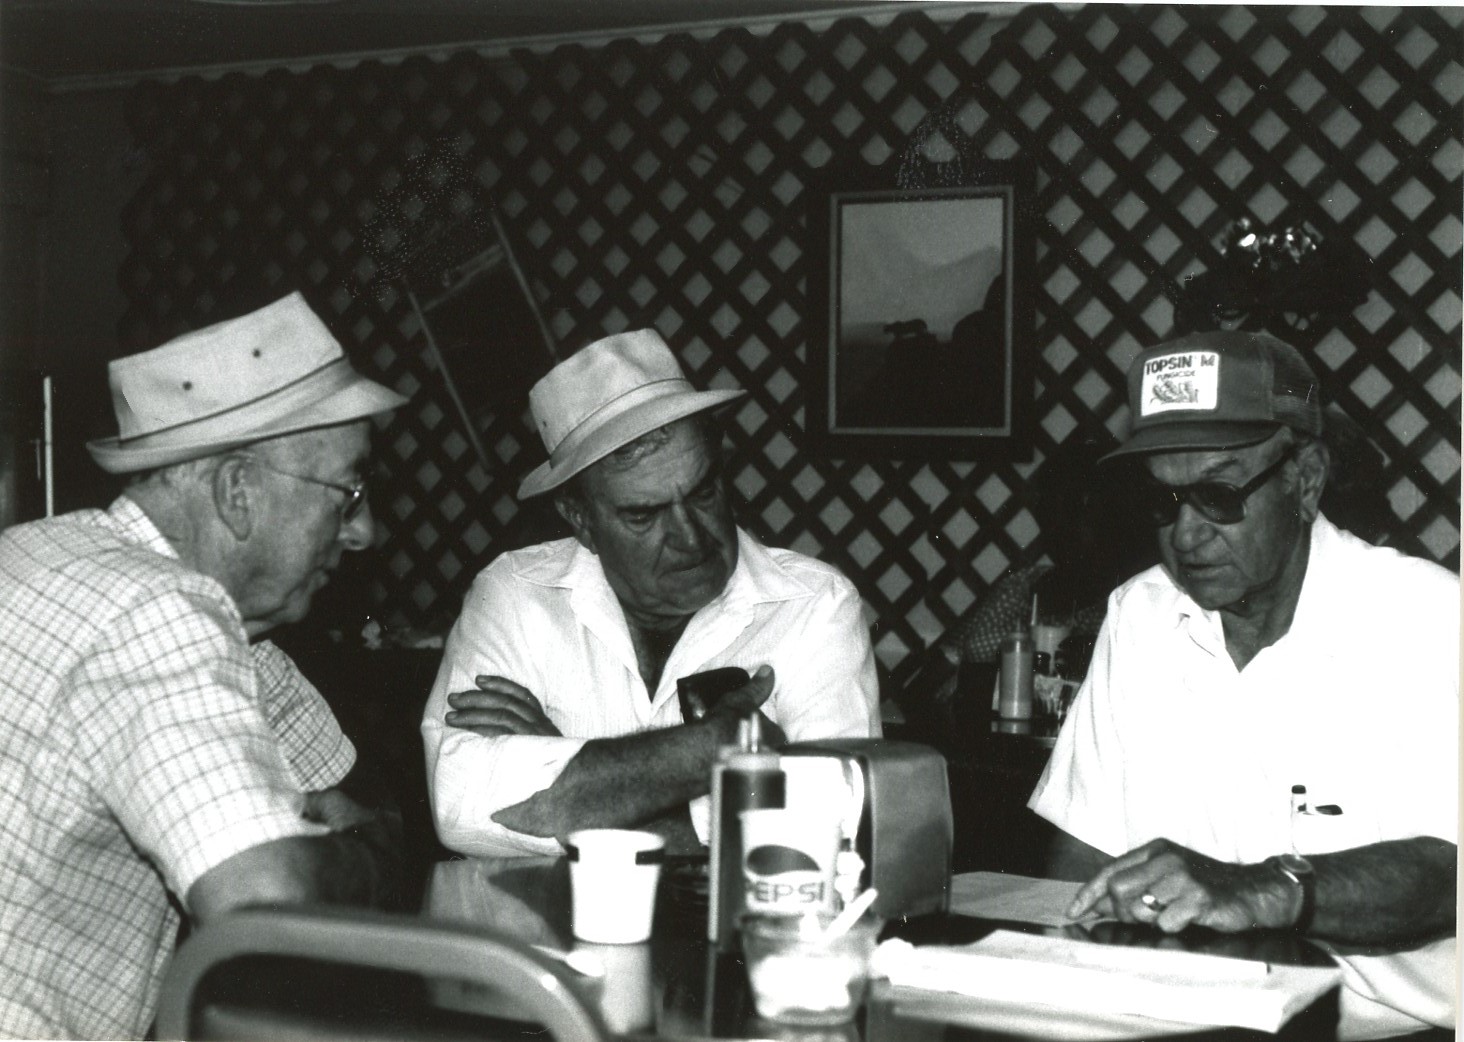 Ranchers review the cow-calf contracting questions on the Farm Costs and Returns Survey, predecessor of ARMS, Pilot Rock, OR,
The broiler industry—where almost all birds are produced under production contracts—provides a prototypical example of the arrangement. Growers invest in specialized housing and equipment, and provide labor. Contractors—poultry processing companies like Tysons or Perdue—provide chicks, feed, veterinary services, and guidance. The chicks are delivered from contractor hatcheries, and the birds are delivered to contractor-owned processing plants. Grower compensation is based not on broiler prices, but on their performance in transforming chicks and feed into broiler meat.
Production contracts are widely used in poultry, hogs, fed cattle, and dairy heifers. They are used in horticulture, where growers raise seedlings for integrators for delivery to retailers; in some vegetables, where growers raise crops for processors; and in seeds for field crops. The specific services that growers provide may differ across commodities: livestock producers usually provide labor and housing, while contractors perform most field operations for processing vegetables. But in each case, contracts will specify: 1) the specific services to be provided by each party; 2) the manner in which the grower is to be compensated for services provided; and 3) specific contractor responsibilities for provision of inputs. Because the services provided by contract growers are often supported by long-lived and specialized capital investments, production contracts frequently link growers to a specific integrator and to a long term commitment to the activity.
Marketing contracts focus on the commodity as it is delivered to the contractor, rather than specify the services to be provided by the farmer. Unlike production contracts, marketing contracts do not specify on-farm capital or production practices. They set a commodity’s price or a mechanism for determining the price, a delivery outlet, and a quantity to be delivered. Forward contracts, with a specific price set at the time of agreement, are one type of marketing contract. But other types of marketing contracts, often of longer duration, specify a method or formula for determining prices, rather than a specific price, at the time of agreement. The pricing mechanisms may limit a farmer’s exposure to the market price risks. They usually specify minimum acceptable levels of various product attributes, and they often specify price premiums to be paid for desired levels of attributes—such as oil content in corn—thereby providing incentives to produce higher-cost but desirable product varieties.
Marketing contracts are widely used in hogs and fed cattle, to govern livestock sales to meatpackers, and the same hogs or cattle may be sold under a marketing contract but raised under a production contract. Marketing contracts are frequently used for field crops, although they are more likely to be used for specialized varieties that may have few buyers.
Contract production is not the reciprocal of spot market production because there is some vertical integration in agriculture. For example, some cattle feedlots are owned by meatpackers; hatcheries and sow operations are often owned by poultry or hog processors; and some cane sugar operations are owned in common with processing plants. Production from those farms that is shipped to integrated processing plants or to other contract growers would not be defined as contract production in the ARMS.
Survey instruments are available from the ERS website (USDA, ERS, 2015.)
Contract production complicates data collection of farm finances. Contract growers often bear only part of production expenses, while contractors may reimburse growers for some expenses and may provide growers with some inputs. Similarly, contract growers may own fewer assets, per dollar of production, because contractors own some of the assets. Contract growers may receive only part of the market value of a commodity in fees, with contractors receiving the rest. Contract growers may also produce specialty varieties of commodities, with different revenue and expense profiles. For all of those reasons, the survey questionnaire breaks out contract production. See Box for more information on how the ARMS collects information on agricultural contracts.
The use of contracting varies widely across commodities (Figure 1). For example, contracting is far less common in major field crops than in other parts of agriculture: while five major field crops accounted for 37% of the value of commodity production in 2013, they accounted for only 21% of the value of production under contract. Contract production leans more heavily toward specialty crops, hogs, and poultry, which together accounted for 48% of the value of contract production, but only 26% of the value of all production.

Source: USDA Agricultural Resource Management Survey, 2013.
Farms that use contracts are different. Contracting farms are larger, whether measured in terms of whole farm production or a specific contracted commodity, than farms that produce the same commodities without contracts. Those farms that contract for one commodity usually do it extensively, using contracts for their other commodities (MacDonald, Korb, and Hoppe, 2013).
In every commodity class, there are farms that use contracts and farms that don’t. Farms that use contracts usually commit most production to the contract. For example, contracts accounted for 32% of the value of all cattle production in 2013, which includes production at cow-calf, stocker, and feeding stages (Table 1). However, contracts accounted for 92% of the value of cattle production on farms that used contracts
| Share of Production Under Contract | ||
| Commodity | Farms with Contracts | |
| Cattle | 32 | 92 |
| Dairy | 47 | 98 |
| Hogs | 74 | 98 |
| Poultry | 84 | 100 |
| All livestock | 52 | 94 |
| Corn | 17 | 49 |
| Cotton | 46 | 94 |
| Fruits, Nuts, Berries | 50 | 94 |
| Peanuts | 57 | 95 |
| Rice | 51 | 100 |
| Soybeans | 19 | 60 |
| Vegetable & Melons | 29 | 88 |
| Wheat | 13 | 61 |
| All crops | 22 | 54 |
| All commodities | 35 | 69 |
While contracts covered less than 20% of corn, soybean, and wheat production in 2013, farms that used contracts placed 49, 60, and 61% of their corn, soybean, and wheat production, respectively, under contract in 2013; they combine cash sales, contracting, and storage as part of their risk management strategy. Contracting farms in other commodity categories—livestock, specialty field crops, fruits, and vegetables—place nearly all production of the contracted commodity under contract.
Contract use spread widely between 1969 and the turn of the century (Figure 2). The 1969 Census of Agriculture asked about contract use, with definitions that were consistent with ARMS categories (MacDonald et. al, 2004). In that year, 5% of farms had contracts, which covered 11% of the value of commodity production. The Farm Costs and Returns Survey, USDA’s predecessor to the financial component of ARMS, generated an estimate of 10% of farms, covering 28% of production, in 1991. The ARMS was introduced in 1996, when 13% of farms had contracts, covering 33% of production.
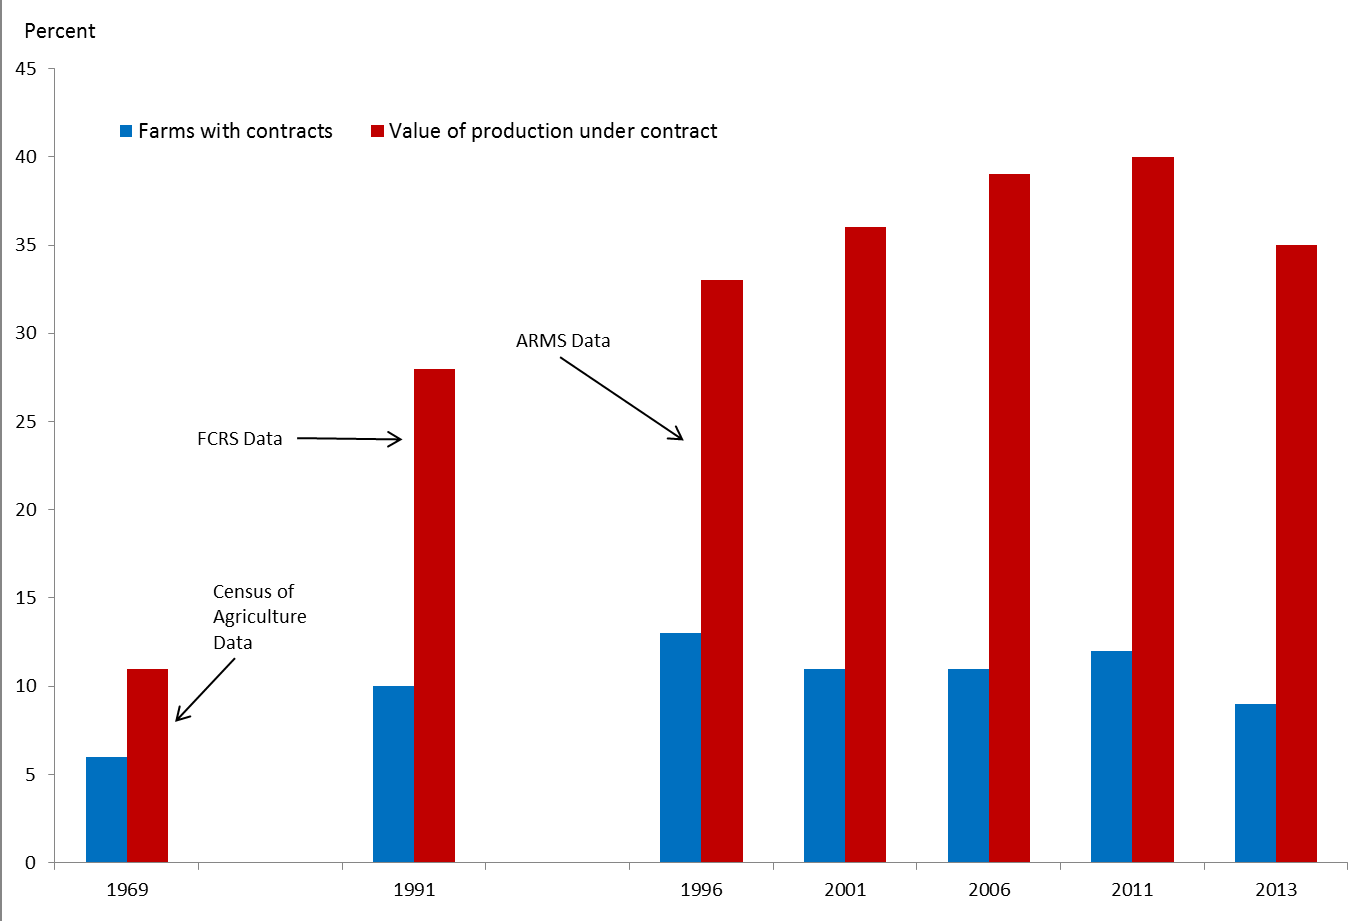
Sources: U.S. Census Bureau, Census of Agriculture
(1969); USDA Farm Costs and Returns Survey, (1991);
USDA Agricultural Resource Management Survey
(1996-2013).

Source: USDA Agricultural Resource Management Survey
The share of farms with contracts peaked in 1996, but the later decline reflects the definition of farms used in USDA surveys. Under a definition set by Congress in 1976, a farm is any place that produces, or normally could produce, at least $1,000 of agricultural commodities in a year. The definition is not adjusted for inflation, and with rising farm commodity prices—about 60% between 1996 and 2011—more small places will be defined as farms. The census of agriculture counted 1.19 million farms with sales below $10,000 in 2012, compared to 964,926 in 1997. Few—0.3% in 2013—farms in that size category use contracts, and their expansion in the farm population reduces the share of all farms with contracts.
In contrast to the share of farms with contracts, the share of production covered by contracts continued to grow, albeit slowly and unsteadily, until 2011, when 40% of production was covered. However, in 2013 the share of agricultural production under contract fell sharply, by five percentage points over 2011.
One could look at the growth of contracting between 1969 and 1996, or even 2006, and conclude that it was a broad trend across all of agriculture. But aggregate developments in the 2000s appear to be driven by episodic major shifts in specific commodity areas and changes in the commodity composition of agricultural production, and not by any broad overall trend.
Because contract use varies widely across commodities, composition effects matter when examining aggregate changes. Contracting accounts for a higher share of livestock than of crop production (Figure 3). In recent years, changes in relative prices led to a substantial increase in the crop share of the total value of production—crops reached 58% of the value of production in 2013, up two percentage points from 2011 and ten percentage points from 2006.
With less contracting in crops, increases in the share of crops in the overall value of production will reduce the share of production covered by contracts. However, the share of crops produced under contract also fell quite sharply between 2011 and 2013—by ten percentage points (Figure 3). In part, that decline also represents a composition effect, as major field crops—corn, soybeans, and wheat—which are less prone to contracting, also accounted for a growing share of the value of crop production, through increases in relative prices.
However, the incidence of contracting also declined in the three major field crops, after expanding sharply during the period of commodity price increases (Table 2). In 2003, contracts accounted for 14% of corn and soybean production and 8% of wheat production. By 2008, contract shares rose to 26%, 25%, and 24% for corn, soybeans, and wheat, respectively—below average for the rest of agriculture, but much higher than previous estimates for these crops. Contract shares then fell sharply in 2012 and 2013, reaching 17% for corn, 19% for soybeans, and 13% for wheat.
One can’t help but wonder if the changes observed in the three major field crops were in turn driven by changes in price risks and their management. Prices rose and displayed greater month-to-month volatility after 2003, as more corn, soybean, and wheat production was placed under contract. More farmers used marketing contracts for their crops, and they placed greater shares of production under contract. Contracts offered one channel for managing price risks, and farmers that used contracts were also more likely to hedge with futures markets and to use on-farm storage as part of their price risk strategies. However, policy was also changing, toward a much greater reliance on crop insurance aimed at yields and at revenue. By 2013, far fewer farmers were using marketing contracts for corn, soybeans, and wheat, but those that did placed more of their production under contract.
| Year | All farms | Farms with contracts | |
| Production under contract (%) | Farms with contract (%) | Production under contract (%) | |
| Corn | |||
| 2013 | 17.2 | 18.5 | 48.7 |
| 2008 | 25.8 | 36.7 | 45.3 |
| 2003 | 13.7 | 14.2 | 44 |
| Soybeans | |||
| 2013 | 19.2 | 17.8 | 59.4 |
| 2008 | 24.7 | 33.4 | 48.6 |
| 2003 | 13.4 | 12.8 | 54.4 |
| Wheat | |||
| 2013 | 13.1 | 13.2 | 61.1 |
| 2008 | 23.9 | 23.9 | 47.1 |
| 2003 | 6.3 | 6.3 | 52.4 |
There were important changes in contracts affecting specific commodities. For example, the hog sector underwent a major reorganization during the late 1990s and early 2000s (McBride and Key, 2013). Production shifted to larger operations that specialized in single stages of the production process. Integrators emerged to manage farm production and processing through vertical integration and contracting, with sharp declines in spot market transactions: contracts covered 32% of the value of production in 1996 ARMS data, and 71% in 2013—with vertical integration accounting for much of the rest in 2013. Hogs are shipped to packing plants under marketing contracts and vertical integration, but usually raised under production contracts.
In peanuts and tobacco, contract use expanded sharply after the cessation of Federal marketing quota programs in the early 2000s (MacDonald and Korb, 2011). Marketing quotas provided price stability for producers, and contracts provided a way to manage emerging price risks after the end of the programs, while also tying payments more closely to product attributes. In tobacco, contracts covered virtually all production by 2008, compared to about 25% in 2000. Contracts covered 60-80% of peanut production after 2004, compared to 25-45% in 1996-2002, before the program changes—there are fewer peanut producers in ARMS, and sampling variation is a meaningful source of year to year fluctuations in contract use.
The discussion concerning major field crops should remind us that: (1) contracting does not always occur in concentrated markets and (2) it does not always tie growers to specific contractors for any significant length of time. Table 2 indicates that producers of the largest field crops, by acreage, move in and out of contracts easily, and that they combine contracts with other marketing channels. Those growers who use contracts typically rely on multiple contracts with different contractors; moreover, storage options, and changes in crop choices give them further flexibility. Except for specialty varieties, buyer concentration does not play an important role.
Contracts do not account for large shares of corn, soybeans, and wheat production, but those are huge markets, and contract corn, soybean, and wheat production amounts to half of the value of all crop production under contract, and nearly one-fifth of all contract agricultural production.
Production contracts commit contract growers more closely to specific integrators, for longer periods of time, because of the substantial investments in specific assets, such as housing and equipment, that are often required, and because scale economies in processing limit the number of integrators in any one area. In 2013, production contracts covered $58 billion in agricultural production, 14% of all agricultural production; $48 billion of that fell in two commodity classes—hogs and poultry. Hog producers with production contracts typically raise finishing hogs for an integrator, and they usually combine contract hog production with field crops—corn and soybeans, most often. In most parts of the country, contract hog growers have more than one integrator to choose from, even if they don’t have many, and their farm business are relatively diversified (MacDonald and Korb, 2011).
Contract poultry growers have fewer options. Half of contract broiler producers report that they have only one or two integrators in their area, and integrator concentration appears to result in lower contract fees (MacDonald and Key, 2012). Contract production creates rents, and contracts may be used to appropriate rents, with damages to some growers that are independent of traditional market power issues, as described elsewhere in this Choices theme (Wu and MacDonald, 2015).
Marketing contracts are widely used in some local and regional procurement markets with few buyers, such as fed cattle, sugar beets, peanuts, and some fruit and vegetable commodities. The contracts may specify payment commitments from buyers in highly concentrated markets, thus eliciting production by growers who would otherwise avoid producing for monopsony markets. However, there are circumstances in which marketing contracts can be designed to deter entry by new competitors and to limit aggressive price competition by existing buyers (Love and Burton, 1999; Sexton and Zhang, 2000). For contracts to facilitate the exercise of market power in these ways, they require highly concentrated buyer markets and a specific set of pricing mechanisms, features which are present but by no means ubiquitous across agricultural markets.
Love, H. A., and D.M. Burton. 1999. “A Strategic Rationale for Captive Supplies.” Journal of Agricultural and Resource Economics, 24: 1-18.
McBride, W., and N. Key. 2013. U.S. Hog Production from 1992 to 2009: Technology, Restructuring, and Productivity Growth. U.S. Department of Agriculture, Economic Research Service. Economic Research Report No. 158. October.
MacDonald, J. M., and P. Korb. 2011 Agricultural Contracting Update: Contracts in 2008. U.S. Department of Agriculture, Economic Research Service. Economic Information Bulletin No. 72. February.
MacDonald, J. M., and N. Key. 2012. “Market Power in Poultry Production Contracting? Evidence from a Farm Survey.” Journal of Agricultural and Applied Economics 44: 477-490.
MacDonald, J. M., P. Korb, and R. A. Hoppe. 2013. Farm Size and the Organization of U.S. Crop Farming. U.S. Department of Agriculture, Economic Research Service. Economic Research Report No. 152. August.
MacDonald, J., J. Perry, M. Ahearn, D. Banker, W. Chambers, C. Dimitri, N. Key, K. Nelson, and L. Southard. 2004. Contracts, Markets, and Prices: Organizing the Production and Use of Agricultural Commodities. U.S. Department of Agriculture, Economic Research Service. Agricultural Economic Report 837, Available online: http://www.ers.usda.gov/publications/aer837/.
Sexton, R., and M. Zhang. 2000. “Captive Supplies and the Cash Market Price: A Spatial Markets Approach.” Journal of Agricultural and Resource Economics, 25: 88-108.
U.S. Department of Agriculture, Economic Research Service. 2015. Agricultural and Resource Management Survey Farm Financial and Crop Production Practices. Available online: http://www.ers.usda.gov/data-products/arms-farm-financial-and-crop-production-practices/questionnaires-and-manuals.aspx
Wu, S., and J.M. MacDonald. 2015. “The Economics of Contract Grower Protection Legislation”. Choices: The Magazine of Food, Farm, and Resource Issues. Forthcoming.

