Growth in the number of farmers’ markets is slowing. As of August 2017, there were 8,687 markets, double the number from 10 years ago but only a 0.2% growth from the previous year (U.S. Department of Agriculture, 2018), indicating that growth in the number of markets has leveled off. Many parts of the country, particularly in urban areas, are witnessing a saturation of farmers’ markets. Producers complain that maintaining a presence at multiple markets has increased costs more than it has added revenues (Zepeda and Reznickova, 2018). These vendors question whether adding markets increases the number of shoppers or just makes it more convenient for those customers currently shopping at farmers’ markets.
With the number of farmers’ markets leveling off, what do we know about the shoppers who visit these established, mature markets? What are they buying? What are impediments to further growth? We conducted a survey of shoppers at one of the oldest and largest producer-only farmers’ markets in the country to find out.
The Madison, WI, Dane County Farmers’ Market (DCFM) is 45 years-old, the oldest and most popular of 11 markets in a city of 200,000 and one of the oldest and largest farmers’ markets in the United States. This established, mature market sees thousands of visitors each summer Saturday and is restricted to four blocks of sidewalk around the capitol building. Given the space restrictions, high foot traffic, and flat fee for a stall, it has consistently had a vendor waiting list of about 10 years. Despite this, many current vendors complain that their revenues are not proportional to the foot traffic.
Given concerns about market saturation at this mature market, the DCFM manager requested that we conduct a consumer survey to find out who is buying, how much they are buying, and the obstacles to purchasing more. The DCFM board reviewed, modified, and approved the questionnaire in January 2015, and the University of Wisconsin human subjects internal review board approved the protocol and questionnaire (Zepeda and Carroll, 2016). The DCFM board agreed to fund participant incentives in the form of $1 coupons for DCFM products. Ultimately, $732 in coupons were distributed to participants. Thus, the only cost to DCFM went straight to vendors. All other costs for the project were provided free of charge. The authors and 15 volunteer enumerators collected data from February 7 through December 19, 2015, at all four DCFM sites: late winter market, Saturday summer market, Wednesday summer market, and early winter market.
We chose enumeration to ensure a high response rate, a representative sample, and because pre-testing showed that enumeration was faster than self-administration. Enumerators used tablets displaying a Qualtrics survey. They approached customers at random, asked them to participate in a DCFM-approved survey, screened for consumers over 18 years, obtained informed consent, and distributed a $1 DCFM coupon. In total, 732 questionnaires were completed. Overall response rate was high: 62.4%.
Visitors to the DCFM are not “average” food shoppers. While their incomes are higher than the U.S. average (31% have household income above $96,000, compared to 20% of U.S. households), the characteristic that most distinguishes them is that they are far more educated than the average American. They are twice as likely to have completed a bachelor’s degree (77% vs. 32% of U.S. population) and more than three times as likely to have completed a graduate or professional degree (38% vs. 12%). The average age is somewhat younger: just under 46 years old, versus 50 years for the U.S. population. Household size of DCFM visitors is smaller than the U.S. average (2 vs.2.5 people), but the proportion of children under 18 is similar (20% vs. 21%). Since the University of Wisconsin-Madison has 45,000 students, it should not be surprising that shoppers at the DCFM are highly educated, young, and have small households and few children. While these shoppers may not be similar to the average US shopper, they are reflective of the residents in the town where the farmers’ market is located. These results are consistent with Aguirre (2007), Zepeda (2009), and Conner et al. (2010), who found no significant difference in education, age, or income between farmers’ market shopper and non-shoppers in the United States and Michigan.
Consistent with findings about farmers’ market shoppers by Conner et al. (2010), DCFM visitors are also more likely to be white than the average U.S. resident (89.6% vs. 78%). Again, this reflects the population of the market location: 86% of Dane County residents are white, and 81.5% of respondents lived in Dane County. Schupp (2016) explains the prevalence of white shoppers using farmers’ markets, which tend to be located in neighborhoods with significantly more white people than the U.S. population as a whole. Zepeda and Nie (2012) found the presence of a farmers’ market significantly increased the probability that residents made purchases. Indeed, close to a quarter (22.4%) of DCFM visitors walk to the market, indicating that they live very close to it.
Another distinguishing characteristic of DCFM visitors is consumer-supported agriculture (CSA) membership. About 2% of households in the United States are CSA members (Zepeda and Li, 2006), compared to 18% of respondents. Half also visit other farmers’ markets regularly, and just under half have their own vegetable gardens. It would appear that these shoppers are highly involved in sourcing local foods and that shopping at a farmers’ market in this case complements rather than replaces other local sources of food.
Contrary to the perceptions of vendors that few people buy things at the market, 95.1% of participants surveyed bought food at the DCFM. Those who made purchases spent $28.46 during their visit. For comparison, respondent households report spending $110.06 a week on all groceries (including toiletries and alcohol). Thus, DCFM purchases represent over a quarter (25.9%) of respondents’ weekly grocery expenditures. Expenditures per visit at the early winter and late winter markets were actually higher ($35.20 and $26.93, respectively) than at the summer market ($26.15).
What is interesting is that older shoppers buy significantly more at the market than younger shoppers (p < 0.001 using a two-sample rank-sum test). Shoppers 55 and older spend an average of $30.57 per visit, while those under 55 spend $24.88 per visit. This is related to significant income differences by age of DCFM attendees. Respondents 55 and older have an average household income of $95,562, while those under 55 make $78,758. Since income is a key driver of food expenditures, it is expected that older, well-to-do customers buy more.
Looking at the types of products purchased, 81% purchase fresh vegetables, 59% baked goods, 41% cheese, 37% fresh fruit or berries, and 15% eggs. Cut flowers and bedding plants are only offered at the summer market and are purchased by 28.4% and 16.9% of shoppers, respectively. In general, shoppers assume that DCFM products are certified organic, although only 10% of the produce vendors are certified.
While over 55% of respondents say that buying fresh produce is the primary or secondary reason for being there, more than two-thirds identify entertainment ora social outing as the primary or secondary reason for being there. However, vendors’ perceptions of summer market visitors as “tourists” should be modified to recognize that nearly half (44.3%) are regular shoppers (visiting at least 2–3 times a month) who bring others with them to the market. On average, visitors to the DCFM shop in groups of 2–3 people.
The upshot is that the perception of a social outing is central to why visitors go to the DCFM, even among the most dedicated shoppers. Many businesses spend huge sums of money trying to create an image of entertainment; the DCFM has it for free. Visitors also gave high marks to vendors for service; more than two-thirds strongly agreed that vendors are knowledgeable and helpful, that they could easily communicate with vendors, and that the stalls were clean and sanitary.
Why visitors did not spend more money at the DCFM varied by market, and the reasons given were diffuse. At the late winter market, located in a nearby senior center, 17% said prices/lack of income were prohibitive, while only 11% said the market does not carry what they are looking for, and 10% said the vendors do not take credit cards/they had no cash on them. At the outdoor summer market, a total of 432 obstacles were given, 33.5% of which concerned congestion: there simply was not enough space or it took too long to shop. The next most frequent complaints were difficulty or distance carrying items (15.3%), and not going home straight afterward/not having anywhere to store items (14.1%). Congestion (17.9%) was also cited as the primary reason shoppers did not buy more at the early winter market, located indoors in a convention center, while 15.4% indicated it was too difficult or too far to carry items, 14.8% complained about parking availability or cost as an impediment, and only 12.8% complained that the prices were too high. Vendors also complained about the crowds at the summer market and saw them as an impediment to sales. Since the summer market is located on the perimeter of the Wisconsin State Capitol and regulated by state law, it is not possible to expand the venue, nor is it possible to close the streets. Extending the hours is unlikely; the market is already open from 6:15am–1:45pm. Since many vendors travel over an hour each way to the market, they complain the market is open too long already. However, prior to 10am the market is not as crowded, so one solution is to encourage shoppers to come early and perhaps incentivize early shopping by providing specials.
Overall, customers are happy with the selection of products that are available; only 14% of summer visitors would like to see more items, compared with 29% of early winter customers and 33% of late winter customers. While a few customers wanted products that simply could not be produced out of season or in Wisconsin’s climate, most suggestions implied there is scope to increase sales by providing beverages, prepared foods, more dairy products, more protein, and a greater variety of vegetables that could be grown in the climate/season. Given that the majority of visitors were primarily there as an outing, and many are concerned about carrying or storing purchases, it should not be surprising visitors wanted drinks and ready-to-eat food.
With regard to credit cards, almost half of summer shoppers indicated the acceptance of credit cards would increase their purchases. Yet fewer than 21% of vendors accept credit cards and only 25% would consider using them. The majority of vendors (54%) would not consider accepting credit cards. The DCFM encourages shoppers to use one of the nearby ATMs. However, this means a delay in purchase, an extra inconvenience, possibly an ATM charge, and maybe interest charges if they are using credit rather than debit cards. These factors make it less likely that someone who is new, or an infrequent visitor, will purchase anything. Although there is resistance by vendors, accepting credit cards might increase sales. Furthermore, rather than millennials, it is older shoppers who prefer credit cards. Credit card preference increased with age and is significantly higher among those over 55 than among those under 55. This is interesting because respondents over 55 also buy $5.69 more per visit than those under 55.
We use a lower-limit Tobit statistical model to examine how demographics, shopping habits, eating habits, and perceived impediments affect consumer expenditures at the DCFM. We chose a lower-limit Tobit model because it allows us to consider the 5% of those surveyed who did not purchase anything. We use dummy variables to see how purchases changed among the different markets, which reflect different locations and seasonal differences in products offered. To examine demographic characteristics, we include variables for gender, age, education, income, and the presence of children under 18 in the household. Shopping habits include dummy variables for the primary food shopper, shopping alone or by oneself, buying from the same vendor(s) at each market visit, and types of products purchased, as well as a variable for the number of vendors purchased from. Impediments to shopping include variables for distance traveled to the market, whether crowds were perceived as problem, whether one was able to carry items, and whether shoppers would buy more if vendors took credit cards. Eating habits included number of dinners prepared per week and a dummy variable for eating five fruits and vegetables a day.
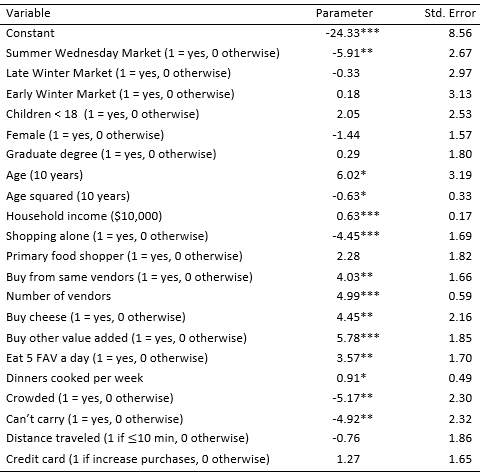
Note: Single, double and triple asterisks (*, **, ***) indicate significance at
the 10%, 5%, and 1% level, respectively.
The Saturday summer market is the baseline. At that market, the average respondent spent $29.41 per visit. We found no significant differences in expenditures for the winter markets but significantly lower expenditures for the Wednesday summer market, averaging $5.91 per visit less (Table 1). While seasonality affects the food offered at the winter markets, it does not appear to affect the amount spent, implying that shoppers make seasonal changes in their purchases. The high level of local food sourcing (e.g., CSA membership, gardening) is also indicative of seasonal variation and preferences in foods consumed. The Wednesday summer market has fewer vendors and customers than the Saturday summer market. It caters to people working downtown; they may buy less because they have no place to store purchases until after work.
Of the demographic variables, when shopping and eating habits were included, only income significantly affected expenditures (p < 0.001). However, the effect was tiny; each $10,000 in annual household income increased expenditures by only 63 cents. Since people attending these markets had similar characteristics, it should not be surprising that education, gender, and the presence of children were not significant, while age was only significant at the 10% level.
In contrast to demographics, there was greater variation in shopping habits, several of which were significant and had large effects on purchases. Shopping alone significantly reduced purchases, by $4.45 per visit, while being the primary shopper had no significant effect. Buying from the same vendor at each visit increased purchases by $4.03, while each additional vendor a shopper bought from added $4.99. Buying cheese increased purchases by $4.45 per visit, while buying value-added products other than cheese increased purchases by $5.78 per visit.
Eating habits also impacted expenditures. Each additional dinner cooked at home per week had a weak effect, increasing expenditures by 91 cents (at the 10% significance level). However, eating five servings of fruit and vegetables per day had a large impact on purchases ($3.57 per visit, significant at the 5% level). We found no significant relationship when we replaced the 5-a-day variable with a dummy variable for following the MyPlate guidelines for fruits and vegetables. One of the advantages of enumerating the survey was that we noted that respondents took more time and appeared to be more careful in answering how many servings of fruits and vegetables they ate versus whether half their plate contained fruits and vegetables. This may be because the number of servings is concrete and neutral, whereas asking whether their plate contained half fruits and vegetables conveys a social norm; thus, their quick responses to MyPlate may reflect social desirability bias.
Significant and large barriers to DCFM purchases at the 5% level were perceptions that the market was crowded or being unable to carry one’s purchases. Seeing the market as crowded reduced purchases by $5.17 per visit, while being unable to carry purchases reduced expenditures by $4.92. Distance traveled did not affect purchases; those who traveled less than 10 minutes did not spend differently that those who traveled further. Nor did credit card preferences have a significant impact on purchases when other factors were considered. We also examined interactions between credit card preferences and the demographic variables; none were significant, so we did not include them in this final model.
We found that—despite vendors’ perceptions that most visitors were “tourists” who did not buy from the market—95% of those surveyed at the DCFM made purchases. Purchases averaged $28.46 per visit, equaling a quarter of their household grocery budget. Thus, visitors are indeed spending quite a bit of their food budget at the farmers’ market, and most are repeat customers.
Demographics did not have much impact on purchases when shopping and eating habits were taken into account. Income increased purchases, but the effect was small, and age was only marginally significant. Nor did demographics significantly interact with credit card preferences. Instead, we found that consumers’ shopping behaviors had large and significant effects on purchases and that perceptions of the market being crowded or carrying purchases being difficult were large and significant barriers to purchases.
Eating five servings of fruits and vegetables a day also had a large significant impact on purchases. In terms of farmers’ market customers, promoting five-a-day fruit and vegetable consumption would appear to be an effective marketing strategy to increase sales. The marginal impact on purchases among customers who ate five a day was four times that of an additional dinner cooked at home per week.
The results suggest strategies that this mature farmers’ market could adopt to encourage purchases; however, they may not be generalizable to other farmers’ markets because each farmers’ market is unique. These strategies include capitalizing on visitors’ positive perceptions of vendors by encouraging visitors to develop relationships with vendors and buy from multiple vendors and encouraging vendors to feature more value-added products. While adding new types of value-added products could benefit vendors, local stakeholders would have to first convince the State of Wisconsin Department of Administration, which sets rules about what products can be sold at the DCFM. Market layout is also important; as attendance at a mature market increases, steps must be taken to ensure sufficient shopping space and highlight less-crowded shopping times. Markets should also consider strategies that would aid consumers in carrying and transporting their purchases. Another interesting finding is that older customers prefer credit cards. They also buy more and have higher incomes than younger shoppers, so expanding credit card acceptance could increase purchases among existing customers.
On the whole, vendor frustration that the market had become a tourist destination should be tempered by the realization that 95% of those attending the market are making purchases and that their purchases represent a quarter of their weekly grocery bill. Rather than trying to change shoppers, an alternative is to give them what they want. Most visitors were specifically at the summer market as a group social outing. These visitors already buy a substantial amount of food; it may not seem that way to vendors because shoppers buy from a few of the 40–50 vendors and shoppers are part of a group. However, shopping groups spend more than single shoppers. Furthermore, 90% of those attending the market are repeat customers, and the main reason they attend the market is that they see it as a fun outing. It is clear from the lack of seasonal variation in the value of purchases that customers are willing to buy what is available seasonally.
Vendors can capitalize on attendees’ positive attitudes toward the market by cultivating relationships with customers, expanding value-added offerings, encouraging customers to come when the market is less crowded, and identifying ways to make it easier for customers to carry their purchases. While shoppers purchase less if there are crowds or they perceive carrying their purchases to be difficult, they can also carry products in their stomachs. Vendors should recognize that some visitors are eager to buy food and drink to consume on-site. Vendors should also see the popularity of mature markets such as the DCFM as a potential asset to their sales and capitalize on it. Given that 90% of customers are repeat customers, the results suggest that vendors should develop relationships with customers and encourage them to also buy from other vendors in order to increase sales. Future research could examine whether there are generational differences among shoppers, in terms of what market aspects are most valued, and the effectiveness of promoting five-a-day as a marketing strategy.
The relationship between vendors and customers is particularly important as the primary reason for attending this large, established farmers’ market is as a social outing. Customers are there to have a good time, to socialize, to be part of their food system and their community. This is a tremendous asset for vendors: Their products and the purchase experience are enhanced by this entertainment atmosphere. Strategies that may extend to other markets include developing a sense of rapport with shoppers to ensure repeat business, encouraging buying from multiple vendors, and featuring value-added products.
Aguirre, J.A. 2007. “The Farmer’s Market Organic Consumer of Costa Rica.” British Food Journal 109:145–154.
Conner, D.S., S.B. Smalley, K.J.A. Colasanti, and R.B. Ross. 2010. “Increasing Farmers Market Patronage: A Michigan Survey.” Journal of Food Distribution Research 41(2):26–35.
Schupp, J.L. 2016. “Just Where Does Local Food Live? Assessing Farmers’ Markets in the United States.” Agriculture and Human Values 33(4):827–841.
U.S. Department of Agriculture. 2018. Farmers Markets and Direct-to-Consumer Marketing. Washington, DC: U.S. Department of Agriculture, Agricultural Marketing Service. Available online: https://www.ams.usda.gov/services/local-regional/farmers-markets-and-direct-consumer-marketing
Zepeda, L. 2009. “Which Little Piggy Goes to Market? Characteristics of US Farmers’ Market Shoppers.” International Journal of Consumer Studies 33(3):250–257.
Zepeda, L., and K. A. Carroll. 2016. Dane County Farmers’ Market Consumer Survey. Report Submitted to the Dane County Farmers’ Market Board. April 29, 2016. Available online: www.localandorganicfood.org
Zepeda, L., and J. Li. 2006. “Who Buys Local Food?” Journal of Food Distribution Research 37(3):1–11.
Zepeda, L., and C. Nie. 2012. “What Are the Odds of Buying Organic or Local Foods? Multivariate Analysis of US Food Shopper Lifestyle Segments.” Agricultural and Human Values 29(4):467–480.
Zepeda, L., and A. Reznickova. 2018. Potential Demand for Local Fresh Produce by Mobile Markets. Washington, DC: U.S. Department of Agriculture, Agricultural Marketing Service. Available online: http://localandorganicfood.org/wp-content/uploads/2018/05/Potential-Demand-for-Local-Fresh-Produce-by-Mobile-Markets-05-18-1.pdf

