1st Quarter 2012
Local governments across the United States face ongoing financial vulnerabilities—macroeconomic conditions, natural disaster risk, and poor fiscal planning—in meeting the basic functions of providing public services such as roads, water, sewer, and education. The effects of these financial vulnerabilities can be seen when examining the financial conditions of local governments. For example, municipal bankruptcies such as the recent case in Jefferson County, Ala., home of Birmingham, have created an environment where governments are trying to identify strategies to mitigate the likelihood of future financial hardship.
This research focuses on challenges local governments have in maintaining wealth in the face of risky events like natural disasters. In particular, we concentrate on the role of federal disaster policy in the period following the 2005 hurricane season in the Northern Gulf of Mexico. We highlight changes in fiscal health that did occur following these storms when the federal government covered 100% of emergency and clean-up costs. Despite generous reimbursement rates witnessed for the 2005 hurricane season, a closer adherence to local cost share requirements in federal policy may occur in the future, as FEMA almost exhausted its funds for disaster recovery in 2011. Therefore, we evaluate how the region’s fiscal health might have changed under an alternative scenario where those same local governments would have been required to cost share 25% of these expenses. Finally, we discuss the implications of increased local financial responsibility on local government financial planning for natural disasters.
In 2005, Hurricanes Katrina and Rita battered the North Gulf Coast of the United States. In addition to the expensive costs of evacuating and providing short-term shelters, large quantities of debris had to be removed before residents could return to their homes. Through Federal legislation, local parish and county governments in Louisiana and Mississippi received 100% reimbursement of these costs considered federally reimbursable as defined by the Stafford Act and administered through the Federal Emergency Management Agency (FEMA). This “full insurance” helped to maintain the fiscal health of local governments of 37 coastal parishes/counties in Louisiana and Mississippi as seen in Table 1. Two coastal counties and parishes—Harrison County, Mississippi and Orleans Parish, Louisiana—were excluded from this analysis due to data limitations.
In this Table, we see that Louisiana parishes and Mississippi counties were spared increased harm to their financial health or “public sector wealth”. Across the entire region, liquidity as measured by their current ratio (CR)—those assets that can be converted to cash in one year divided by liabilities due within the same year—did not see any statistically significant change between 2005 and 2009. Liquidity overall improved slightly in both metro and nonmetro regions, as well as for medium and low storm damaged regions. Only those high hurricane cost regions saw a minor 12% reduction in liquidity between 2005 and 2009. Further, solvency as measured by their debt to net asset ratio (DNAR)—total debt divided by total net assets—also suffered no statistically significant change over the same period. Solvency only deteriorated slightly, with a 2.11% increase occurring for metro regions. The greatest improvements in solvency were seen in nonmetro regions—with a 24% reduction in DNAR—and high hurricane cost regions—with a 35% reduction.
Since a companion study (Fannin, Barreca, and Detre, 2012) showed that the post-storm economic boom as measured by increased regional earnings and property values had no significant effect on these liquidity and solvency indicators, we conclude that the stable nature of these public wealth financial indicators is an outcome of the federal government effectively offering an unexpected full insurance policy. At the same time, these results highlight the potential vulnerability of public wealth assets to these types of natural disasters in the absence of federal government support. A greater understanding of these public wealth assets is important in developing policies to protect them.
Public wealth represents one form of a locality’s overall stock of wealth. Public wealth can include public sector natural amenities such as national, state and local parks, forests, and lakes; public infrastructure such as roads, bridges, levees, and school buildings; and financial assets such as reserves held by governments. Public wealth can be leveraged by the private sector as a way to attract the human capital necessary to secure a highly skilled labor force and to produce and deliver goods and services using public highways. Consequently, it is important to maintain public wealth for leveraging by businesses and households, but maintaining this wealth in the face of risky events like natural disasters can be quite challenging for local governments.
In some instances, local governments face some potential financial liabilities from risky events that are uninsurable. For example, no insurance product exists for emergency expenses such as police protection, emergency shelters, fuel, ice and generators, and/or debris removal cleanup for local governments. Since insurance products in the United States are typically under state regulatory control, companies are often forced to restrict their risk profile to an individual state. Many large hurricanes present an equal probability of landfall across many state coastlines 48 hours before landfall. As a result, this joint risk profile reduces the likelihood there would be sufficient policyholders paying premiums that would not get impacted to finance those policy holders that would receive payments.
On the surface, it seems that these one-time out-of-pocket costs would only create short-term financial problems for a local government, but for a large disaster such as a hurricane, these short-term costs can create long-term financial devastation to the public sector. Indeed, if a local government is not financially prepared to manage the costs of a natural disaster, these large one-time disaster costs will have a negative impact on the future public wealth of the community.
Given the lack of insurance products, what options are available to local governments to mitigate these costs and maintain public sector wealth? Besides advanced disaster planning, state governments may provide some support, but the insurer of last resort has typically been the federal government.
Relying on the federal government as an insurer of last resort causes local governments to face potential liquidity and solvency problems. The liquidity problem arises because lag times between when a local government is billed for emergency and debris removal services and when FEMA reimburses them often range from three months to two years. In addition, local governments must also come up with their cost-share portion as required by the Stafford Act that typically ranges from 10% to 25%. The liquidity issues are complicated because the funds local governments use to deliver services, such as road, solid waste, and drainage funds, often receive their revenues via dedicated taxes that cannot be redirected to cover emergency costs; thus increasing the liquidity problem.
For those local governments that reside in geographical areas where they face a high probability of repeated natural disasters, there would be insufficient time to rebuild their pool of current assets, which means they may be forced to take out long-term loans and/or issue bonds to pay for recovery efforts. This creates a ripple effect for public wealth preservation and creation. Since all of a local government’s available cash would already be allocated to meet previous natural disaster cleanup costs, there would be little to no funds available for maintaining existing public infrastructure and/or meeting operating expenses. To alleviate this short-term cash flow problem, they would have to borrow funds thus increasing their total debt burden. This creates a solvency problem for the local government, as borrowed funds that are not used to generate economic growth can have negative consequences. First, borrowed funds create a payment obligation, which reduces cash available for investment. Second, large amounts of outstanding long-term debt may cause a local government to be viewed as a credit risk, diminishing their capacity to meet financial commitments and making it difficult for them to obtain lines of credit or sell bonds at low interest rates. This reduced access to credit results in capital and infrastructure improvements being put on hold; investments that are necessary to not only maintain public wealth but also create it. Consequently, if a municipality cannot maintain and/or upgrade infrastructure it will likely cause a loss in the tax base and a potential exodus of businesses and citizens, which further exacerbates the erosion of public wealth.
Local governments need strategies in place so that they can effectively mitigate these problems. To provide an example of the impact of having these strategies in place, we present an alternative scenario for the 2005 season in which the most vulnerable parishes/counties in South Louisiana and Mississippi would have been required to cover a 25% cost share for emergency operations and debris removal costs. As previously mentioned, positive economic effects from post-disaster recovery did not have any significant effects on these local governments’ financial health (Fannin, Barreca, and Detre, 2012). Hence, we simply assume in this scenario that no other factors—either positively or negatively—would change the financial health of local governments except the increased cost-share presented in the scenario.
To accomplish this task, we first calculate the total obligated costs from the Louisiana and Mississippi Public Assistance (PA) programs, the program from which FEMA through the Stafford Act reimburses local governments. The costs in our analysis include both debris removal and emergency operations costs. Debris removal costs also include U.S. Army Corps of Engineer (USACE) debris removal costs. In future storms, USACE may not provide free debris removal to local governments, thereby placing the onus on local governments to pay for these costs upfront as well as pay for the cost share required by the Stafford Act.
Using the financial statement data, we calculated the end of fiscal year 2005—September 30th for Mississippi Counties and December 31st for Louisiana Parishes—CR and DNAR ratios for each of the 37 counties and parishes. Data for both ratios come from audited annual financial statements required of all parish and county governments in Louisiana and Mississippi. Next, our hypothetical scenario was applied. This required us to add the local governments’ 25% share of emergency operations and debris removal costs associated with Hurricanes Katrina and Rita to the 2005 current liabilities. Doing this reduces the CR through an increase in current liabilities and increases the DNAR through an increase in total liabilities and a decrease in net assets. A reduction in the CR puts the local government at an increased risk of financial distress. At low CR levels, local governments are at risk of having insufficient current assets available to meet their current debt obligations. If this situation arises, they are likely to have to borrow additional funds and/or sell assets to meet existing current debt obligations. Both of these choices reduce the amount of funds available for maintaining and/or creating public wealth in the short-run. While an increase in the DNAR, like a reduction in CR, increases the potential for financial distress, at extremely high of levels, it can lead to bankruptcy. If a local government has a bad year financially because a natural disaster hits or a large loss in the tax base occurs, it might not have enough combined revenue and excess borrowing capacity to meet all obligations. If this occurs, creditors could force bankruptcy, the ultimate erosion of public wealth.
| Financial Conditions Before and After the 2005 Hurricane Season and 25% Cost Share Scenario | ||||||
|---|---|---|---|---|---|---|
| Type of Counties/Parishes | Number of Counties/Parishes | 2005 CR |
2009 CR | CR % Change (05-09) | 25% Cost Share CR | CR % Change (05-09 Cost Share) |
| Total | 37 | 2.901 | 3.409 | 17.51 | 0.629 | -78.31 |
| Metro | 21 | 2.907 | 3.334 | 14.67 | 0.67 | -76.95 |
| Nonmetro | 16 | 2.849 | 3.941 | 38.32 | 0.394 | -86.18 |
| High Cost (>25% Total Assets) | 10 | 2.316 | 2.027 | -12.49 | 0.371 | -83.97 |
| Medium Cost (10% Total Assets) | 6 | 1.658 | 2.099 | 26.61 | 0.628 | -62.11 |
| Low Cost (<10% Total Assets) | 21 | 5.594 | 6.998 | 25.1 | 3.659 | -34.58 |
| Debt to Net Asset Ratio | ||||||
| Type of Counties/Parishes | Number of Counties/Parishes | 2005 DNAR |
2009 DNAR | DNAR % Change (05-09) |
25% Cost Share DNAR | DNAR % Change (05 to 05 Cost Share) |
| Total | 37 | 0.539 | 0.535 | -0.62 | 1.16 | 115.79 |
| Metro | 21 | 0.578 | 0.59 | 2.11 | 1.25 | 116.33 |
| Nonmetro | 16 | 0.296 | 0.225 | -23.92 | 0.55 | 84.48 |
| High Cost (>25% Total Assets) | 10 | 0.716 | 0.462 | -35.4 | 3.92 | 447.11 |
| Medium Cost (10% Total Assets) | 6 | 0.452 | 0.509 | 12.72% | 0.51 | 13.8 |
| Low Cost (<10% Total Assets) | 21 | 0.551 | 0.589 | 6.84% | 0.57 | 2.59 |
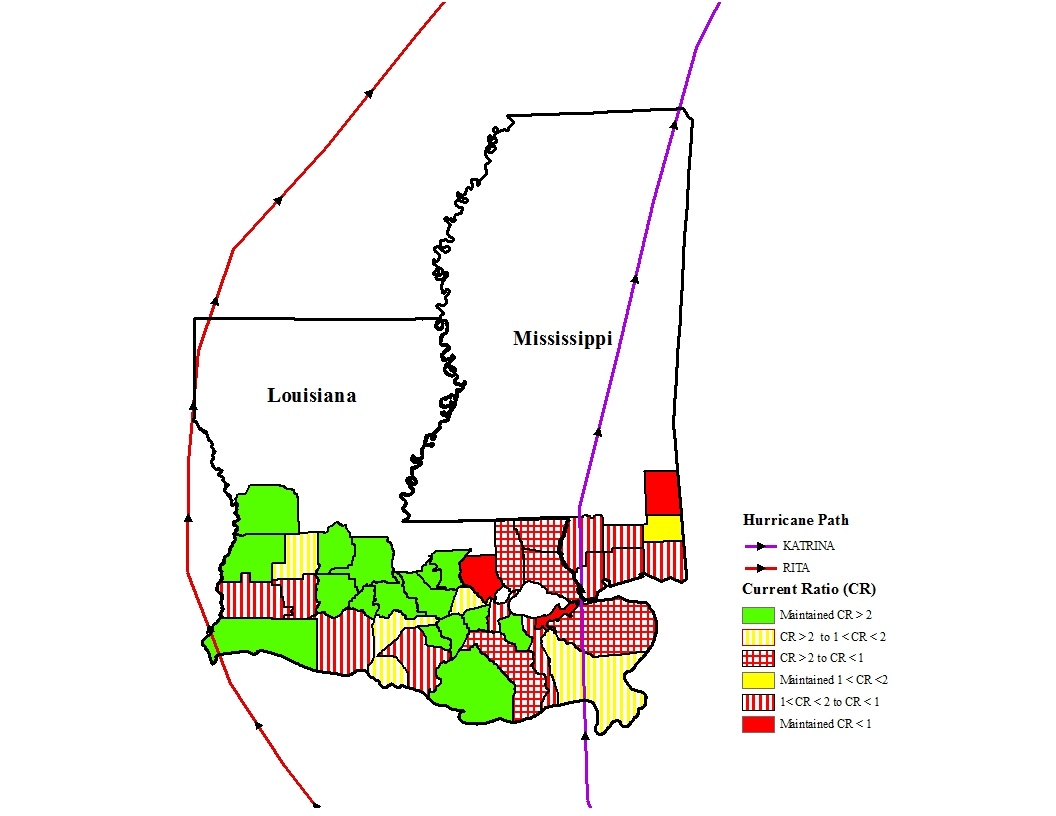
As can be seen from Table 1, the weighted average CR under the 25% cost share scenario showed a large reduction, from 2.90 to 0.63. According to Finkler (2010), a healthy CR for a government entity should exceed one—a CR of one implies current assets equal current liabilities—and an extremely healthy CR would exceed two. These results suggest that on average, region-wide liquidity would have dropped to unhealthy levels if the 25% cost share would have been required. This would have occurred for all categories of coastal regions except those that faced the lowest hurricane costs.
Figure 1 summarizes the changes in the CR by county and parish using the 25% federal cost share scenario. Those regions closest to the coast and/or closest to the path of Hurricane Katrina would have seen the greatest reductions in liquidity. Most of the parishes in green were located outside of the Katrina path and would have maintained an extremely healthy CR. Hurricane Rita reduced some parishes’ liquidity while others were more resilient.
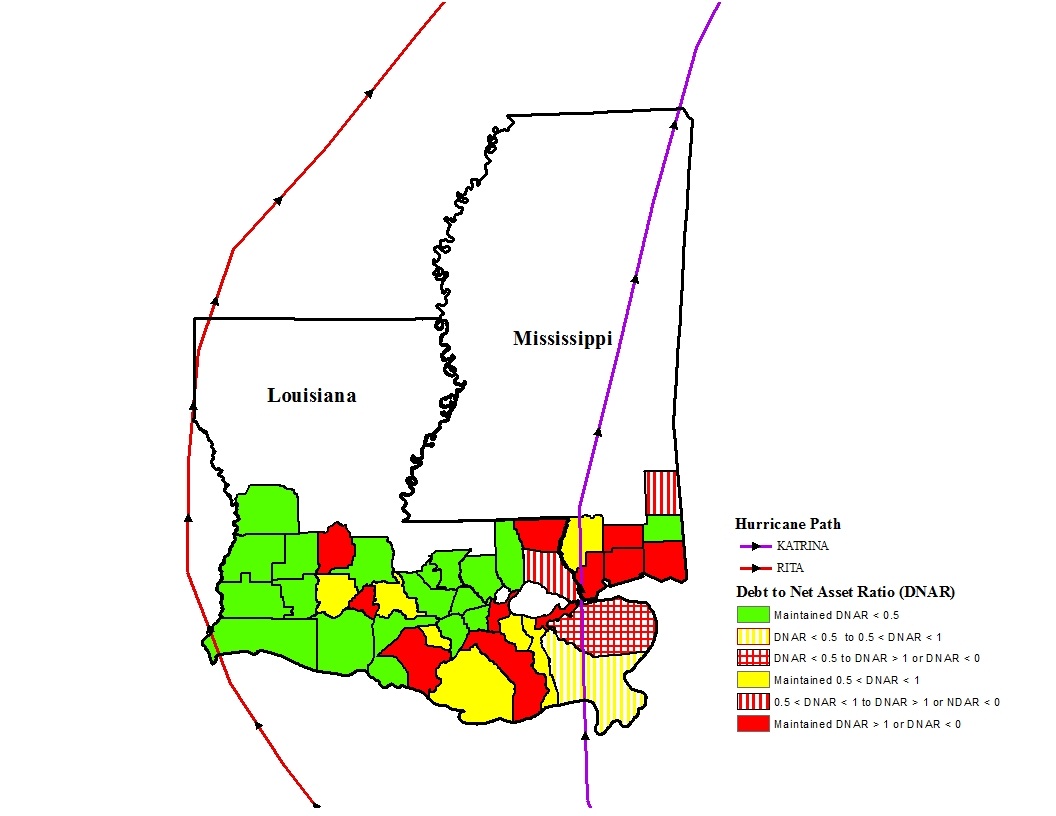
Results of the solvency analysis in Table 1 show that the financial impact of the storms would have measurably influenced the solvency positions of the counties and parishes in this study. Under the 25% scenario, the weighted average DNAR would increase to 1.16, meaning the county and parish governments would “owe” slightly more than what they would “own” (Finkler, 2010). High cost regions would be the most affected, with their solvency ratios increased almost 450% to 3.92. With the 25% cost share, these regions would have owed almost 4 times the value of all of their public assets, relative to what actually occurred.
Examination of Figure 2 shows that both metro and nonmetro counties and parishes that were in the direct path of the storm would have had a worsening debt position under a 25% cost share scenario. Further, we see that Hurricane Katrina’s path would have added to or maintained a relatively high debt position for almost all counties and parishes it crossed or were to the east of its eye wall near the coastline.
Local governments face many challenges to their fiscal health. This analysis showed that local governments are financially vulnerable to natural disasters under traditional Stafford Act 25% cost shares. Using emergency operations and debris removal costs from the 2005 hurricane season, it can be surmised that both the liquidity and solvency conditions of local governments would have been greatly impacted by the combination of Hurricanes Katrina and Rita if the federal government would have applied traditional cost share requirements rather than picking up 100% of the costs. The results from the hypothetical scenario could potentially be used to create a risk-adjusted CR and DNAR for local governments that face tropical natural disaster risks.
Further, local governments should identify ways to make a greater proportion of their revenue streams available to cover the short-term, infrequent costs of natural disasters. To do this, local governments will need to employ several strategies including increasing the flexibility associated with special purpose funds when these taxes come up for renewal and advance negotiating of debris removal contracts with payment terms. A combination of the aforementioned strategies and general fund reserves should help provide sufficient liquidity to local governments when they face a natural disaster.
One may question whether using a large tropical natural disaster such as Hurricanes Katrina and Rita is a reasonable proxy for planning in this region. However, applying methods of recent research suggest that such large tropical natural disasters may likely be a more frequent occurrence. For example, by augmenting Klotzbach and Gray’s (2012) county landfall probability model, from using over 125 years of climate history to the most recent 30 years, a storm the size of Hurricane Rita at landfall passing through Calcasieu Parish in Southwest Louisiana would increase the 50-year probability from 27% to 45%.
While local governments in regions of the hurricane-prone coastal zone might take these findings as directly applicable, the strategy for local government policy can be generalized to other regions and other types of disasters. As long as local governments can quantify from historical data and/or estimate their cost share from future natural disasters, they can incorporate these adjustments to create risk-adjusted rules of thumb to ensure the best opportunity for fiscal health when faced with natural disaster risk.
One of the biggest challenges facing local governments with natural disasters is the reliability of the federal government to serve as that “insurer of last resort.” When a natural disaster in a state occurs, the Governor of the state must request to the President of the United States that a federal disaster declaration be issued before the public assistance program can be activated. Isolated natural disasters in rural areas that do not garner national public attention, unlike the Alabama and Missouri tornadoes did in 2011, may be less likely to have a declaration approved. In these instances, local governments would have to cover 100% of disaster emergency and cleanup costs. Rural regions, in particular, face the increased likelihood of being ignored on the national level because of their inability to speak loud enough to be heard because of a lack of political capital. Although the discussion of how to develop political capital is beyond the scope of this study, having a political voice at the national level would complement those strategies employed by local governments to ensure fiscal preparedness with respect to natural disasters. The ability of rural governments to maintain long-term economic viability is one necessary leg of a multiple legged stool of rural wealth maintenance and long-term wealth creation.
Moreover, this research has shown the need for decision tools and executive education training on natural disaster preparedness for local government leaders to develop their knowledge and competency. Providing local government leaders with the proper tools and training would give them the skills necessary to make informed and rational decisions that could lead to proper implementation of appropriate financial disaster preparedness measures, ultimately reducing the probability of erosion of public wealth.
Finally, this research highlights additional opportunities for policy analysis. Local communities with eroding public infrastructure, as well as a reduced tax base from de-population, may be increasingly vulnerable to further public wealth decline. Future research highlighting the feedback effects of a community’s current economic and demographic trends will further aid in understanding public sector wealth effects on the livelihood of its residents.
Fannin, J.M., Barreca, J.D. and Detre, J.D. (2012). The role of public wealth in recovery and resiliency to natural disasters in rural communities. American Journal of Agricultural Economics, 94(2), 549-555.
Finkler, S. (2010). Financial management for public health and non-for-profit organizations. 3rd ed. Upper Saddle River, NJ: Pearson Education.
Klotzbach, P., and Gray, W. (2012). United States landfall probability methodology. Available online: http://www.e-transit.org/hurricane/welcome.html.

