Between the 2012 and the 2017 agricultural censuses, United States farmers increased their use of no-tillage and cover crops on cropland. In 2012, approximately 34.6% of cropland was no-till, and just over 3% of harvested cropland was cover-cropped. By 2017, no-tilled acres represented 37% of cropland, and cover-cropped acreage grew by more than 50%, to 4.8% of harvested cropland (USDA, 2019). Although rates of adoption vary regionally due to soil types, cropping systems, and other economic factors (see Wade, Claassen, and Wallander, 2015; Claassen et al., 2018), these national trends reflect the growing importance of soil health among farmers and in the public policy space. This emphasis stems from the potential of soil health systems to benefit farmers and society, which is discussed in the first article of this theme (Stevens, 2019).
Investing in soil health practices and systems may benefit farmers directly if the private benefits (increased profits, ecosystem services) are greater than the cost of implementation. This growth in soil health practice adoption is fueled, in part, by a number of U.S. federal and state programs that provide financial or technical assistance to farmers to adopt soil health practices that they would not have adopted otherwise because the benefits do not exceed the costs. In part, farmers make this calculation because soil health benefits may accrue slowly over time, making a management change may have high upfront investments and learning costs as a farmer experiments with a practice, and other transaction costs seem high (Bowman, Wallander, and Lynch, 2016; Palm-Forster et al., 2016). Providing financial and technical assistance is one way to overcome these barriers to adoption. Yet is paying for soil health practices an effective policy approach to make farmers more economically sustainable, while providing ecosystem services that benefit society? How important is financial assistance relative to technical assistance in overcoming barriers to adoption? Because many programs’ impacts are not well measured, policy makers have a difficult time evaluating the cost-effectiveness of these incentive programs.
In this article, we summarize the form and scope of federal- and state-level initiatives that provide incentives to farmers to adopt soil health practices in the United States. We also focus a portion of our discussion on the State of Maryland’s cover crop program to illustrate the strengths, limitations, and challenges of implementing such programs. Our hope is to raise key issues and motivate future research that will inform the design of future programs that pay for soil-health-related practices.
Two primary working lands conservation programs in the United States provide incentive payments to farmers to implement soil health practices, and both are implemented by the USDA’s Natural Resources Conservation Service (NRCS). The Environmental Quality Incentives Program (EQIP) provides financial assistance to farmers to implement conservation practices not already adopted on the acreage being enrolled in the program. EQIP practices include a number of soil-health-related practices such as no-tillage, prescribed grazing, and cover crops. Two of the most common soil health practices receiving payments through EQIP are no-tillage and cover crops, but the relative emphasis on these two practices has changed over time. Between 2005 and 2016, annual funding for cover crops through EQIP increased from about $5 million to more than $90 million in nominal terms, and the number of acres receiving EQIP payments for cover-cropping more than quadrupled (from 240,418 to 1,120,311 acres). Over this same period, funding for no-tillage dropped substantially (Bowman and Wallander, 2018). This is likely due to the fact that no-tillage has become a much more common practice in many regions and for many crops and because many farmers choose to adopt no-tillage without an incentive payment (Claassen et al., 2018).
Source: USDA, Economic Research Service calculations
using USDA, National Resources Conservation Service,
ProTracts database.
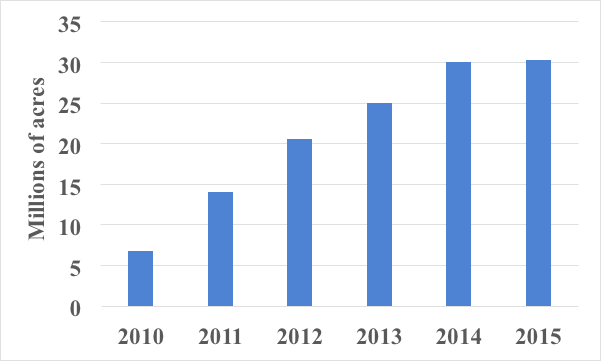
The second NRCS program that provides financial assistance for soil health practices is the Conservation Stewardship Program (CSP). CSP is the largest conservation program (in terms of acres enrolled) in the United States and was established by the 2008 Farm Act. CSP is designed to provide assistance to farmers and ranchers that may already be implementing conservation practices on their land but want to take their management to the next level by implementing “enhancements” to existing conservation practices that address specific resource concerns (USDA, 2016). Some of the most popular soil-health-related enhancements in CSP are related to cover-cropping, pasture and rangeland management or restoration, and no-tillage or reduced tillage (Bowman, Wallander, and Lynch, 2016). Between 2010 and 2015, the number of acres receiving CSP payments for at least one soil health practice or enhancement grew from just under 7 million to more than 30 million (Figure 1).
These two NRCS programs are structured somewhat differently. For example, most EQIP contracts are for less than three years and are implemented at the field level (Wallander et al., 2019), whereas CSP contracts are typically five years and involve a suite of enhancements to both enhance natural resources and improve business operations (USDA, 2016). Despite these differences, CSP and EQIP both require farmers and ranchers to implement practices or enhancements in accordance with conservation practice standards published by the NRCS. These practice standards specify how a practice is implemented on the landscape. For example, farmers receiving an EQIP payment for cover-cropping cannot harvest their cover crop for grain or seed but can graze their cover crop or harvest it for hay or silage. They must also comply with the practice standard that specifies the type of cover crop to be established, seeding rates and dates, when and how they will apply nutrients, and how they will terminate their cover crop (USDA, 2014).
In addition to the two major federal programs discussed in the previous section, a number of U.S. states, counties, and soil and water conservation districts implement programs that offer either financial or technical assistance or both to farmers to adopt soil health practices such as no-tillage, reduced tillage, or cover-cropping. These programs often take the form of cost-share programs, which are designed to offer the farmer financial assistance to cover all or a portion of the costs associated with adopting a practice. Program requirements often include that the farmer document costs associated with adopting a practice, that they submit other documentation sufficient to prove that they have adopted the practice, or that a practice be implemented according to a state or federal practice standard. Many states require that practices adopted as part of a state cost share program conform to the NRCS practice standard for the practice. For a list of a number of state programs that promote soil health or provide financial or technical assistance to support soil health practices, see the Soil Health Institute’s Soil Health Policy Resources page.
In the same way that federal programs have increased funding to promote adoption of cover crops, a number of state programs have emerged or expanded to provide financial incentives to farmers to adopt cover crops. Some programs explicitly state that a farmer cannot participate in both state and federal cover crop programs, while others allow the farmer to receive payments from both programs. Participation year limits and acreage caps vary, as do stipulations related to whether the farmer has to be a first-time cover-cropper.
Source: Publicly available information from State websites and personal communication with staff at
implementing agencies.
Differences in program requirements may correspond to different program goals; for example, some programs may be trying to offset the learning costs associated with the practices, whereas others may only be concerned with maximizing cover-cropped acreage and associated water quality benefits each year. Few programs measure changes in soil health or water quality benefits at the farm level as a result of cover-crop adoption. One such program run by the State of Missouri requires that farmers take a baseline and follow-up soil sample before and after participating in the cover-crop program (Missouri Department of Natural Resources, 2016). Other regions use models to compute estimated benefits from implementing specific practices. Most programs use a “pay-for-practice” approach; others choose “pay-for-performance,” which can be challenging due to the difficulties in measuring performance from each field. Being explicit about the desired goals and measuring whether the practice implementation accomplishes these goals may provide the needed information for adapting programs to elicit the desired outcomes.
Table 1 lists the top five state-funded cover-crop programs (in terms of acreage) in the United States. In terms of both total funded acreage and per-acre payment levels, Maryland has the largest program (400,000 acres). After Maryland, the next-largest programs were in Iowa (250,000 acres in FY 2017) and Virginia (200,000 acres in FY 2016). In 2017, Iowa began a demonstration project offering farmers a $5/acre reduction on their crop insurance premium for planting a cover crop (Iowa Department of Agriculture and Land Stewardship, 2017). In addition to the states listed in the table, a number of other states or conservation districts within states provide a per acre incentive payment for cover crops.
In FY 2018, Maryland paid more than 1,400 farmers up to $75/acre to plant almost 400,000 acres of cover crops. This makes Maryland’s program the largest state cover-crop cost-share program in the United States (in terms of acres), although Maryland paid for fewer cover-crop acres in 2018 than in any year since 2010. In this section, we discuss the goals of this program, the evolution of the program over time, and some of the takeaways from Maryland’s experience paying for cover crops.
In 2004, the Chesapeake Bay Commission deemed cover crops one of the most cost-effective ways to improve Chesapeake Bay water quality. Though Maryland already had a cover-crop program, in most years between 1994 and 2006, the program received fewer than 1,000 applications. In 2004, Maryland developed a Tributary Strategy (a plan to meet Maryland’s nutrient-reduction goals for the Chesapeake Bay) that included an annual goal of planting 600,000 acres of cover crops (Maryland Department of Natural Resources, 2008) on a voluntary basis. At that time, available funding only covered about 113,522 acres of cover crops at an incentive of $20/acre.
In 2004, Maryland created the Bay Restoration Fund, which was financed by two fees known as the “flush tax”: one paid by public sewer users, and one by septic users. The fee paid by public sewer users was used to upgrade Maryland’s wastewater treatment plants to remove more nitrogen (N) and phosphorus (P) during the treatment process. Part of the fee paid by septic users was used to upgrade septic treatment systems, but 40% of the revenue collected from this fee was dedicated to funding cover-crop incentives. In addition, the state created the Chesapeake and Atlantic Coastal Bays Trust Fund (2012), funded by fuel and rental car taxes, which began providing substantial support to the Maryland Cover Crop Program.
Source: Annual reports from the Maryland Department of Agriculture
and Maryland Agricultural Water Quality Cost Share Program.
Source: Annual reports from the Maryland Department of Agriculture
and Maryland Agricultural Water Quality Cost Share Program.
To advance toward initial program goals of funding 600,000 acres of cover crops, the incentives for farmers to participate were increased over time. By 2016, the base and maximum payments had increased to $45/acre and $90/acre, respectively, from the base payment of $20 offered in 2004. Within this base and maximum payment structure, the program incorporated a number of monetary incentives for specific types of cover-crop choice or management. A few examples include bonuses of $10/acre for each of (i) early planting, (ii) using cover crops on fields with spring manure, and (iii) planting rye. In addition to raising incentives substantially to increase program participation, the program addressed other challenges. For example, a program evaluation found that only about 67% of sign-ups actually completed their cover-crop contracts. And, through farmer focus groups and surveys in 2005, the Cover Crop Program gathered concerns and suggestions, leading it to change several key components in 2007 to improve program flexibility. These included (i) splitting payment for the cover crop such that a $25/acre payment to cover seed costs could be received after planting; (ii) extending the planting deadline to November 5 for rye, wheat, and triticale; (iii) providing incentives for earlier planting; and (iv) allowing legumes (crimson clover, Austrian winter peas, and hairy vetch) to be added to the list of eligible cover-crop varieties.
The program also expanded in 2007 to include harvested or commodity cover crops in addition to unharvested, traditional cover crops (see Table 2). This provision allowed farmers to receive a lower payment ($25/acre–$35/acre) in exchange for planting small grains such as wheat, rye, or barley to be harvested in the spring. Although traditional cover crops cannot be harvested, when established they can be grazed or chopped for on-farm livestock forage. Between 2007 and 2017, roughly 20%–40% of the cover-crop acres planted as part of the program were in commodity cover crops that were harvested. In FY 2018, competition for funding resulted in this part of the program being discontinued; program managers thought farmers would plant harvested cover crops without the payment provided previously, which resulted in the acreage decline visible in Figure 2.
Although cover-cropping can be a key component of a soil health management system, Maryland’s Cover Crop Program was designed to increase cover-crop adoption to maximize water quality benefits and reduce nutrient loading to the Chesapeake Bay, not to improve soil health per se. At its peak in FY 2017, the program was estimated to have reduced annual N loading to the bay by 3,353,850 lb and P by 111,795 lb. To the extent that these modeled reductions represent actual reductions, the program can be judged to have been successful at meeting its stated goals. As modeling approaches have improved, we may be able to improve spatial targeting of similar programs to achieve maximum water quality benefits. For example, Lee et al. (2016) find that the effectiveness of winter cover crops at reducing N leaching in two watersheds in the Chesapeake Bay likely depends upon crop rotations and soil characteristics (cover crops were more effective at reducing N leaching where N loads were high in well-drained soils). Improving targeting will enable the limited amount of program funding to be used cost-effectively to achieve the highest benefits.
It is also important to ask about the impact of the program on farmer decisions. For example, would farmers participating in Maryland’s program have been planting cover crops, even without a payment? And were there other impacts of the program? Fleming (2017) found that the cover-crop program had a large effect on the share of acreage planted to cover crops and also suggests that the program increased acreage in conservation tillage in the state which had associated, additional water quality benefits. Lichtenberg, Wang, and Newburn (2018) use data from two surveys from 1997 and 2009 to estimate additionality (or how many farmers adopted cover crops that would not have adopted without a payment) for different groups of farmers. Their findings suggest that “higher cover crop payment rates offered by the program and the larger program budget served mainly to attract farmers who would have self-funded cover crops otherwise” (p. 21).
These findings suggest that Maryland was successful in attracting farmers to experiment with cover crops, but additional increases in incentive payments may not have the same impact going forward. Some farmers may find the practice standards imposed by the program too rigid or the transaction costs of applying burdensome.
Programs that pay for soil health practices, such as Maryland’s Agricultural Water Quality Cost Share Program and federal programs such as EQIP and CSP, are increasing their funding of practices such as cover crops. To the extent that such programs can accelerate adoption of such practices by funding learning-by-doing, normalizing practice use, offsetting the costs to farmers of implementing a practice, or accelerating a transition to a soil health practice or system, they are an instrumental part of the adoption process. However, as is often the case in pay-for-practice programs, the primary measure of success becomes that which is easiest to measure: the number of acres or farmers participating in a program.
In the case of Maryland’s program, increases in program flexibility and increased payment rates induced high levels of participation in the program, and the modeled water quality benefits were substantial. However, such programs raise questions about additionality of such programs, or how many farmers participating in the program would have engaged in the practice without the program benefit. To the extent that the acres enrolled are not additional, such programs may be overstating program benefits or cost-effectiveness. Most federal and state programs in the United States, to our knowledge, do not collect information about whether a farmer continues to use a practice after participating in such programs. This is a lost opportunity to measure program impact.
The Maryland example also highlights how farmer management practices, such as growing a winter cover crop, can generate valuable ecosystem services that have significant public benefits. However, a shift toward outcome-based programs that pay for measured or modeled benefits, such as water quality and carbon sequestration, might ensure that farmers who generate ecosystem services are being appropriately compensated and that good management is incentivized. Finally, Maryland’s program suggests that practice-based programs that aspire to high rates of adoption should develop a process for integrating farmer feedback and consider making program requirements flexible such that they are compatible with regional farming practices and timelines.
Bowman, M., and S. Wallander. 2018. USDA’s Environmental Quality Incentives Program Continues Expansion of Financial Assistance for Cover Crops. Washington, DC: U.S. Department of Agriculture, Economic Research Service, April 23. Available online: https://www.ers.usda.gov/data-products/chart-gallery/gallery/chart-detail/?chartId=88558
Bowman, M., S. Wallander, and L. Lynch. 2016. “An Economic Perspective on Soil Health.” Amber Waves, September 6.
Chesapeake and Atlantic Coastal Bays Trust Fund. 2012. FY 2012 Annual Work Plan. Available online: http://dnr.maryland.gov/ccs/Publication/TrustFund_WP2012-YearFour_FY12_FY13.pdf
Claassen, R., M. Bowman, J. McFadden, D. Smith, and S. Wallander. 2018. Tillage Intensity and Conservation Cropping in the United States. Washington, DC: U.S. Department of Agriculture, Economic Research Service, Economic Information Bulletin, EIB-197, September.
Fleming, P. 2017. “Agricultural Cost Sharing and Water Quality in the Chesapeake Bay: Estimating Indirect Effects of Environmental Payments.” American Journal of Agricultural Economics 99(5): 1208–1227.
Iowa Department of Agriculture and Land Stewardship. 2017. Iowa Farmers Using Cover Crops May Be Eligible for Crop Insurance Premium Reduction [Press Release]. Des Moines: IDALS. Available online: https://www.iowaagriculture.gov/press/2017press/press11162017.asp.
Lee, S., I.-Y.Yeo, A.M. Sadeghi, G.W. McCarty, W.D. Hively, and M.W. Lang. 2016. “Impacts of Watershed Characteristics and Crop Rotations on Winter Cover Crop Nitrate-Nitrogen Uptake Capacity within Agricultural Watersheds in the Chesapeake Bay Region.” PLoS ONE 11(6): e0157637.
Lichtenberg, E., H. Wang, and D. Newburn. 2018. Uptake and Additionality in a Green Payment Program: A Panel Data Study of the Maryland Cover Crop Program. Paper presented at the annual meeting of the Agricultural and Applied Economics Association, August 5–7, Washington, DC.
Maryland Department of Natural Resources. 2008. Maryland’s Chesapeake Bay Tributary Strategy Statewide Implementation Plan. Available online: ftp://ftp.chesapeakebay.net/Modeling/Upload/Administrative_Record_Non-model_Files/39_CB%20States%20Tributary%20Strategies%20and%20Related%20Implementation%20Plans/39_004_TribDocumentFinal_012308.pdf.
Missouri Department of Natural Resources. 2016. State Cost-Share Handbook. Available online https://mosoilandwater.land/internal/cost-share-handbook
Palm-Forster, L.H., S. Swinton, F. Lupi, and R. Shupp. 2016. “Too Burdensome to Bid: Transaction Costs and Pay-for-Performance Conservation.” American Journal of Agricultural Economics 98(5): 1314-1333.
Stevens, A.W. 2019. “Economic Theory Provides Insights for Soil Health Policy.” Choices 2019(2).
U.S. Department of Agriculture. 2014. Cover Crop Conservation Practice Standard. Washington DC: U.S. Department of Agriculture, Natural Resources Conservation Service, September. Available online: https://www.nrcs.usda.gov/Internet/FSE_DOCUMENTS/stelprdb1263176.pdf.
U.S. Department of Agriculture. 2016. Conservation Stewardship Program [Fact Sheet]. Washington DC: U.S. Department of Agriculture, Natural Resources Conservation Service, August. Available online: https://www.nrcs.usda.gov/wps/PA_NRCSConsumption/download?cid=nrcseprd1288534&ext=pdf.
U.S. Department of Agriculture. 2019. Census of Agriculture: 2017 Publications. Washington DC: U.S. Department of Agriculture, National Agricultural Statistics Service. Available online: https://www.nass.usda.gov/Publications/AgCensus/2017/index.php.
Wade, T., R. Claassen, and S. Wallander. 2015. Conservation-Practice Adoption Rates Vary Widely by Crop and Region. Washington, DC: U.S. Department of Agriculture, Economic Research Service, Economic Information Bulletin EIB-147, December.
Wallander, S., R. Claassen, A. Hill, and J. Fooks. 2019. Working Lands Conservation Contract Modifications: Patterns in Dropped Practices. Washington, DC: U.S. Department of Agriculture, Economic Research Service, Economic Research Report ERR-262, March.

