China recently announced tariffs on imports of a variety of U.S. products as countermeasures to the U.S. Section 232 tariffs on steel and aluminum products. These tariffs will affect U.S. exports of a variety of agricultural products, including wine. U.S. wine producers would like to grow China as a market, given its large consumer base and rising incomes, which will afford increasing per capita wine consumption at a time when wine demand is either decreasing or stagnant in other destination markets. In retaliation to U.S. tariffs, China proposed a 15% tariff on U.S. wine imports, which could affect the competitiveness of U.S. wine in the Chinese market. This article further describes recent changes in the composition of the Chinese wine import market, the importance of the Chinese wine market for U.S. suppliers, and the potential implications of the recently implemented tariff hikes for the competitiveness of U.S. wine in China.
Source: Global Trade Atlas (2018).
Note: U.S. export values may not equal import values reported by China.
Source: USDA (2018).
Source: Global Trade Atlas (2018).

Source: Global Trade Atlas (2018).
Source: Global Trade Atlas (2018).
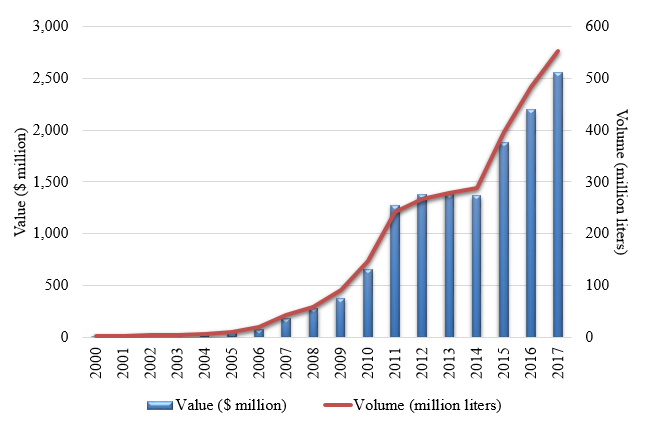
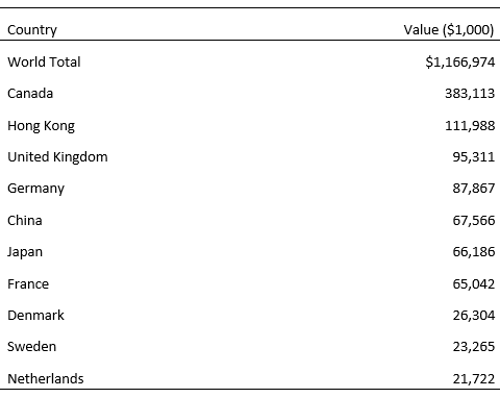
The Chinese wine market has grown considerably, emerging from near-obscurity in the early 2000s to become the third-largest importer of wine worldwide in 2016 (U.N. Comtrade, 2018). In this article, we define wine imports using Harmonized System (HS) code 220421: wine of fresh grapes in containers ≤ 2 liters, which excludes bulk wine and sparkling wine. In 2016, this category accounted for more than 90% of all Chinese wine imports. China imported only $5–$25 million worth of wine in the early 2000s, but, by 2017, imports had risen to a value of more than $2.5 billion (Figure 1). The value and volume of the Chinese wine import market have seen considerable growth over the last 20 years, with sustained recent growth, as the value of imports nearly doubled from 2014 to 2017. China is now tied with Japan and France as the fifth-largest importers of U.S. wine exports (Table 1), with each accounting for 6% of total U.S. wine export value. While currently not a key destination for U.S. exports, China is poised for continued growth in per capita consumption while demand growth is less likely in Europe, Canada, and other importers of U.S. wine (Alston, Summer, and Sambucci, 2018).
Increased wine consumption in China can be attributed to rising per capita disposable incomes, increased education, and government promotion of wine as a healthy alternative to grain-based alcohol (Anderson and Wittwer, 2015; Balestrini and Gamble, 2006; Lee et al., 2009; Liu and Murphy, 2007; Mitry, Smith, and Jenster, 2009; Sun, 2009). Foreign wine is perceived to be prestigious in China, and demand continues to grow with incomes as consumers gain more familiarity with wine varieties, women garner greater gender equality, and the Chinese population pursues more Western consumption patterns (Muhammad et al., 2014; Zheng and Wang, 2017). Further, the persistence of food safety concerns and tainted wine (i.e., wine mixed with juice, water, sugar, coloring, and/or flavorings) in domestic Chinese winemaking have caused problems for consumer trust and confidence in domestic wine. Despite the prevalence of fraud associated with foreign wine, consumers show preferences for imports, particularly for higher-value wine (ATO, 2016; Dordevic et al., 2013; Muhammad et al., 2014).
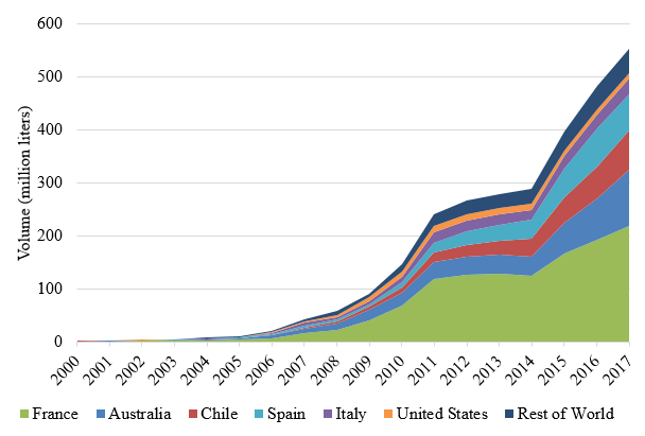
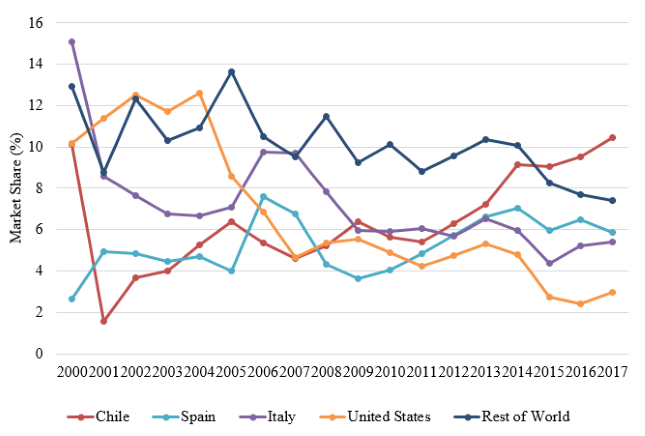
China is the fastest growing wine market in the world, and six countries supply nearly 93% of bottled wine imports in China: France (41% market share), Australia (27%), Chile (11%), Spain (6%), Italy (5%), and the United States (3%) (Figures 2–4, Global Trade Atlas, 2018). While the key suppliers have remained constant and imports from each country have continued to grow over time (U.S. wine is the exception), the market shares held by each country have changed. France continues to lead the market, followed by Australia. The United States has lagged in competitiveness and has declined in market share as Chinese wine imports have risen. Over the past 10 years, France and the United States have lost market share, while Australia and Chile have strengthened their position in the market. Overall, the United States and Italy have experienced the greatest declines in market share since the early 2000s. U.S. wine once accounted for more than 12% of the Chinese market but now accounts for less than 3%. In terms of volume, the United States is the only major country to have experienced a decline in the Chinese market. In 2011–2014, imports of U.S. wine peaked at 12–13 million liters (L) but have since declined to less than 10 million L in 2015–2017. This may be attributed to the preferential trade agreements that afford Australia and Chile greater market access than the U.S. and European suppliers.
Previous research shows that Chinese consumers have distinct preferences for French and Australian wine, with an estimated average of 48 cents of every additional dollar spent on imports allocated to French wine purchases and 20 cents to Australian purchases. U.S. wine imports garner an estimated 7 cents of every additional dollar spent on imported wine (Muhammad et al., 2014). Chinese consumers’ association of quality with foreign wines, particularly those from France, has led to an abundance of counterfeit wine, in which bottles are reused or mislabeled, offering fake wine in the market (Dordevic et al., 2013; Holmberg, 2010; Muhammad et al., 2014; Wilkes et al., 2016). The prevalence of counterfeit French wine, in tandem with increased consumer knowledge of wine varieties from other regions, may have contributed to the decrease in France’s market share over the past decade. However, the changing policy landscape affecting import tariffs and source-specific prices paid over time has changed, with further widening price differences to come in the next year.
Bottled wine imports into China have a Most Favored Nation (MFN) tariff rate of 14% and a 10% excise (consumption) tax. Suppliers also faced a 17% value added tax (VAT) in 2017, which was lowered to 16% on May 1, 2018 (New Zealand Trade and Enterprise, 2018; Wang, 2018). Australia faced a 5.6% import tariff in 2017 that decreased to 2.8% on January 1, 2018, and will fall to 0% in 2019 as a result of the 2015 China–Australia bilateral trade agreement. Chile also has a preferential trade agreement with China that allows Chilean wine to be imported tariff free. While the United States and key European suppliers previously shared a level playing field from a market access perspective, China imposed an additional 15% import tariff on U.S. wine starting in April 2018, in retaliation for U.S. Section 232 tariffs on steel and aluminum imports from a number of countries, including China. U.S. bottled wine now faces a 29% Chinese import tariff at a time when trade barriers for other key suppliers are falling (Inouye, 2018). The newly imposed import tariff may thwart opportunities for increased U.S. wine exports to China, with early signs of Chinese importers responding to these price impacts by canceling orders of U.S. wine shipments (Alston, Summer, and Sambucci, 2018; Bays, 2018; Decanter Staff, 2018).
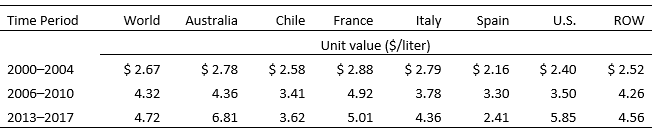
Table 2 reports imported wine prices by country. On the whole, import prices have increased over time, reflecting a greater preference for more expensive wine in China. In 2002–2004, wine prices averaged $2.67/L, ranging from $2.16/L for Spanish wine to $2.88/L for French wine. In 2006–2010, imported wine prices increased to $4.32/L; by 2013–2017, average prices had reached $4.72/L. For individual countries, 2013–2017 import prices were higher for Australian wine ($6.81/L), French wine ($5.01/L), and U.S. wine ($5.85/L), indicating that Chinese importers were sourcing higher-priced wine from Australia and the United States relative to other key suppliers, including France, on average, as the market grew.
The difference between Australian and U.S. market access will widen further in 2019, as the import tariff on Australian wine will become 0. Australia and Chile have gained market share in China over the past 5 years due in part to the lower tariff burden those countries face compared to other key suppliers. The United States is already outranked by five suppliers in the Chinese market, and the newly levied import tariffs on U.S. wine are expected to further damage U.S. potential in the Chinese wine import market.
To estimate the potential effects of the retaliatory tariffs on U.S. wine in China, we use elasticity estimates from Muhammad et al. (2014), who identified the own-price elasticity for U.S. wine in China to be around −1.20. Forecasts using elasticities are based on a general elasticity equation: %ΔQ/%ΔP = −1.20. Solving this for the “new” quantity we get the following forecast equation: Qnew = (−1.20 × %ΔP)/100 × Qold + Qold.
Based on fairly straightforward calculations,
%ΔP = 100×(Pnew − Pold)/Pold = 100 × (import price × (1.29 − 1.14)/import price × 1.14)),
a 15-percentage-point increase in the tariff from 14% to 29% results in a price increase of about 13.2% for U.S. wine in China, assuming that China incurs the full burden of the tariff increase. Thus, the results that follow could be seen as an upper-bound response. Given the ‑1.20 own-price elasticity for U.S. wine, this price increase results in a 16% decrease in Chinese imports of U.S. wine. Using 3-year (2015–2017) average imports as a baseline (9.8 million L for U.S. wine valued at approximately $6/L), imports decrease from 9.8 to 8.2 million L, which is a loss of $9.6 million at baseline prices. Note that these losses only reflect the trade diversion effect of the tariff. Losses could be even greater if the tariff results in trade destruction. Furthermore, we do not account for the likely case in which U.S. wine is shipped through Hong Kong for re-export to China, as is common with a variety of products (Carter, 2018). Accounting for potential increased exports to Hong Kong for final delivery in China could lessen the negative impacts of the increased import tariff level in our calculations.
Chinese retaliatory import tariffs on U.S. wine may threaten the already-weakening U.S. position in the Chinese market. Australia and Chile have preferential trade agreements that increase market access in China relative to other key suppliers, and the United States now faces the largest trade barrier for wine exports to China. There is concern that the new import tariff regime may damage relations between U.S. suppliers and Chinese importers and leave U.S. wine behind other exporters in China in an era of rapid growth in wine consumption among the wider Chinese population. This may lead to long-term damage to the overall competitiveness of U.S. wine in China.
While other wine import markets are stagnant or declining, China is one of the fastest growing per capita wine consumption countries in the world. The potential for the United States to make up lost potential sales to China, beyond re-export through Hong Kong, seems challenging. However, there may be potential for high-value U.S. wine suppliers to compete with other high-end labels in the future, despite tariff hikes. Many Chinese consumers make wine-purchasing decisions based on perceptions of quality and reputation and are willing to purchase expensive, quality wine, despite high prices. The United States has the potential to stay in the Chinese wine game by conveying an image of high quality, comparable to Old World suppliers, that can withstand the added pressure of price increases caused by retaliatory tariffs.
Alston, J., D. Sumner, and O. Sambucci. 2018, April 11. “Should California Winemakers Be Worried about China’s Tariffs?” The Conversation. Available online: https://theconversation.com/should-california-winemakers-be-worried-about-chinas-tariffs-94607
Anderson, K., and G. Wittwer. 2015. “Asia’s Evolving Role in Global Wine Markets.” China Economic Review 35:1–14.
ATO Guangzhou Staff, 2016. South China Wine and Beer Import Market Booming. Guangzhou, China: U.S. Department of Agriculture Foreign Agricultural Service. Gain Report Number CH166025, 19, October. Available online: https://gain.fas.usda.gov/Recent%20GAIN%20Publications/South%20China%20Wine%20and%20Beer%20Import%20Market%20Booming_Guangzhou_China%20-%20Peoples%20Republic%20of_10-19-2016.pdf
Balestrini, P., and P. Gamble. 2006. “Country-of-Origin Effects on Chinese Wine Consumers.” British Food Journal 108:396–412.
Bays, J. 2018, April 6. “At Least One Lodi Wine Shipment to China Has Been Canceled in Wake of Tariffs.” Lodi News, April 6.
Carter, C.A. 2018. “China’s Retaliatory Tariffs and California Agriculture.” Giannini Foundation of Agricultural Economics, University of California (21)4. Available online: https://s.giannini.ucop.edu/uploads/giannini_public/f9/93/f993f561-287e-42fa-bab6-4610c185532f/v21n4_1.pdf
Decanter Staff. 2018, April 10. “Chinese Importers Nervous over Tariffs on U.S. Wine.” Decanter. Available online: http://www.decanter.com/wine-news/chinese-importers-nervous-over-tariffs-on-us-wine-388398/
Dordevic, N., F. Camin, R.M. Marianella, G.J. Postma, L.M.C. Buydens, and R. Wehrens. 2013. “Detecting the Addition of Sugar and Water to Wine”. Australian Journal of Grape and Wine Research 19(3):324–330.
Global Trade Atlas. 2018. Database query. Available online: https://www.gtis.com/gta/
Holmberg, L. 2010. “Wine Fraud.” International Journal of Wine Research 2:105–113.
Inouye, A. 2018. China Imposes Additional Tariffs on Selected U.S.-Origin Products. Washington, D.C.: U.S. Department of Agriculture, Foreign Agricultural Service, Gain Report CH18017, April.
Lee, H., J. Huang, S. Rozelle, and D. Sumner. 2009. “Wine Market in China: Assessing the Potential with Supermarket Survey Data.” Journal of Wine Economics 4:94–113.
Liu, F., and J. Murphy. 2007. “A Qualitative Study of Chinese Wine Consumption and Purchasing Implications for Australia Wines.” International Journal of Wine Business Research 19:98–113.
Mitry. D., D.E. Smith, and P.V. Jenster. 2009. “China’s Role in Global Competition in the Wine Industry: A New Contestant and Future Trends.” International Journal of Wine Research 1:19–25.
Muhammad, A., A.M. Leister, L. McPhail, L., and C. Wei. 2014. “The Evolution of Foreign Wine Demand in China.” Australian Journal of Agricultural and Resource Economics 58:301–498.
New Zealand Trade and Enterprise. Regulations for Exporting Wine to China. Available online: https://www.nzte.govt.nz/about/news/resources/regulations-for-exporting-wine-to-china
Sun, B.B. 2009. National Wine Market People’s Republic of China. Washington, D.C.: U.S. Department of Agriculture, Foreign Agricultural Service, Gain Report CH9808, August.
U.N. Comtrade. 2018. Database query. Available online: https://comtrade.un.org/data/
USDA Foreign Agricultural Service. 2018. Global Agricultural Trade System (GATS) database query. Available online: https://apps.fas.usda.gov/gats/default.aspx
Wang, N. 2018, April 17. “China Lowers VAT Tax for Imported Wine.” Drinks Business.
Wilkes, E., M. Day, M. Herderich, and D. Johnson. 2016. “AWRI Reports: In Vino Veritas—Investigating Technologies to Fight Wine Fraud.” Wine and Viticulture Journal 31(2):36–38.
Zheng, Q., and H.H. Wang. 2017. “Market Power in the Chinese Wine Industry.” Agribusiness 33(1):30–42.

