Since 2012, China has become the predominant market for U.S. agriculture exports, accounting for 16% of U.S. agriculture export value in 2016. The value of exports to China increased 25.6% per year from 2002 to 2013 and added $23.4 billion to the U.S. agricultural export market over this time period. Exports to China in 2014 and 2015 declined slightly but began to rebound in 2016. In 2016, the four largest export markets for U.S. agricultural commodities and products—China, Canada, Mexico, and Japan—accounted for 52% of U.S. agriculture export sales (USDA, 2017a).
Strong growth in U.S. exports to China reflects significant changes in China’s domestic policies, which have created a more market-oriented economy with market-determined prices, and changing consumer preferences as incomes increased. China’s policies on trade, domestic agriculture, and food security have greatly affected trade with the United States. In China, strong income growth, increasing urbanization, an emerging middle class, and growing concerns about food safety have meant more diverse U.S. exports, including greater numbers of valued-added products.
The greatest growth in U.S. exports to China has been in commodities that do not conflict with China’s domestic policies for maintaining self-sufficiency and are in short supply. The best example is soybeans, which are needed for China’s expanding livestock industry. Hides and skins also pose no threat to China’s local industry. Consumer demand is strong for new products, especially those perceived to be healthy and have passed U.S. food safety regulations, particularly among higher income households in urban areas. Dairy imports, for example, increased after China’s melamine food safety issue in 2008.
Source: USDA, 2017a.
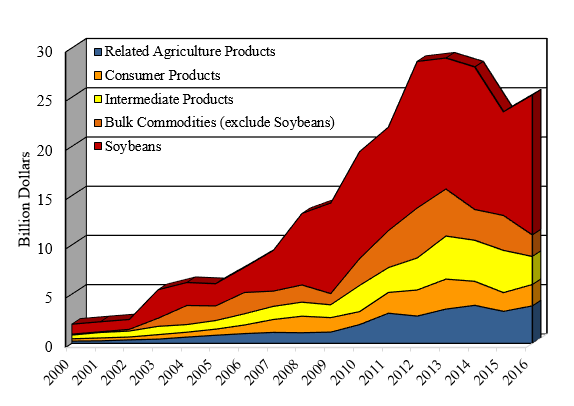
U.S. agriculture exports to China continuously increased through 2013, reaching almost $30 billion dollars, before declining the following two years (see Figure 1). The United States exported $25.2 billion of agricultural products to China in 2016.
Bulk commodities, especially soybeans, are the largest export category, followed by related agriculture products and intermediate and consumer products. Bulk commodities—grains, cotton, tobacco, pulses, soybeans and other oilseeds—now account for about 65% of the value of U.S. exports to China. The value of U.S. bulk commodities exported to China from the 1980s through the 1990s averaged $800,000 per year.
After China became a member of World Trade Organization (WTO) in December 2001, U.S. bulk commodity exports to China quickly increased from $1.2 billion in 2002 to $3.71 billion the following year. At the peak in 2012, bulk commodity exports totaled $19.9 billion. In 2016, soybeans accounted for 87% of bulk commodity exports and 62% of total U.S. agriculture exports to China (USDA, 2017a). The growth in soybean imports was driven by increased demand for meat and expanding livestock production resulting from the fast growth of China’s economy and incomes since the early 2000s.
China’s livestock sector has evolved from backyard production to large-scale commercialized operations, which increased demand for soybean meal in feed rations at a faster rate than the growth in domestic meat production. Although demand for soybean meal for livestock feed increased, China’s soybean production has not expanded over the past 20 years, but decreased. Soybean yield growth stagnated from 1996 to 2016. The area planted to soybeans declined from 2009–2015 due to lower profitability compared to alternative crops, such as corn, which have been supported by government programs and policies. There have been almost no constraints or restrictions on soybean imports.
Sorghum, cotton, and wheat are the next leading bulk commodities exported to China. Exports of sorghum increased due to China’s recent high corn support prices and policies limiting imports of lower-priced corn from the global market. Livestock producers began seeking alternative feeds that could be imported at lower prices, such as distillers’ grains, sorghum, and barley. China’s imports of United States distillers’ grains grew rapidly, reaching $1.6 billion by 2015. Beginning in 2012/13, China increased sorghum imports from the United States; by 2015/16, U.S. sorghum exports to China totaled over $2 billion.
However, exports of sorghum and distillers’ grains dropped significantly in 2016. Prices of alternative feeds—especially corn—decreased, making imported sorghum less competitive with domestic corn for livestock feed rations. China’s removal of price supports for corn led to lower domestic corn prices. Distillers’ grain imports decreased in 2016 due to China’s policy announcement of anti-dumping duties and potential countervailing duties on U.S. exports of dried distiller grains to China.
Many commodity analysts expected China to be a major importer of corn due to increasing feed demand for its growing livestock sector and expectations of a limited ability to expand the area under corn production. However, China did not begin to significantly import corn until 2011/12, with 5.2 million metric tons. Since then, China has only averaged 3.8 million tons per year. In contrast, Japan and Mexico each import at about 14 million metric tons per year (USDA, 2017b).
Many analysts thought corn area could not be expanded, but since 2000/01, China’s corn area increased from 23 million hectares to 38 million hectares by 2015/16. Corn production doubled over this time period. Expanded planting area was driven by government policies setting high procurement prices and import restrictions on corn, enabling corn to be more profitable than competing crops, such as soybeans. Much of the new corn area was achieved by expanding into marginal areas, especially in Northeast China.

Source: Global Trade Atlas, 2017.
The United States also faces strong competition in exporting corn to China. Beginning in 2014, Ukraine became the major exporter of corn to China (see Figure 2). In 2012, Ukraine and China signed a loan-for-crops contract worth $3 billion, which provided credit to Ukraine in exchange for corn supplies to China (Olearchyk and Blas, 2012). Increased imports from Ukraine may also be part of China’s new Silk Road plan, which is meant to revitalize trade with Europe and neighboring Asian countries and to diversify China’s import suppliers. Even though U.S. corn was priced lower in late 2014 and 2015, China significantly increased corn imports from Ukraine due to the financial risk of U.S. corn imports being rejected due to unapproved biotech traits (Anderson-Sprecher, Wei, and Liwen, 2015; Shuping and Stanway, 2015).
China’s corn imports are projected to increase to 6.1 million metric tons by marketing year 2026/27 (USDA, 2017c). Growing feed demand, new government policies reducing corn production on marginal land, and removal of high government support prices for corn will result in overall lower planted corn area and stock levels.
The United States faces competition to preserve and expand its market share of corn exports to China. This may prove difficult because, even given lower costs of production in the United States, Ukraine’s agreements with China may continue to boost corn imports from Ukraine.
China has the world’s largest leather-processing industry, which is driven by strong domestic demand for finished leather products, low environmental constraints for processing hides, historically low-priced labor, adoption of modern processing facilities, and a strong export market for finished leather products. China is the largest export market for U.S. hides and skins, accounting for 51% of the U.S. export world market share over the past five years. The next three largest export markets are South Korea, Mexico, and Canada. The United States exported $227 million worth of hides and skins to China in 2000, increasing to $1.65 billion by 2013. Exports in 2016 were valued at almost $1 billion.
Distillers’ grains and hay are the next largest categories of intermediate agricultural products exported to China. Hay exhibits strong export growth as China’s dairy industry continues to expand.
The value of U.S. consumer-oriented food products exported to China increased from almost $300 million in 2001 to $3 billion by 2013 before declining to a little over $2 billion in 2016 (see Figure 1). Consumer-oriented products include beef, pork, and poultry meats, dairy, fruits, vegetables, nuts, snack food, breakfast cereals, prepared foods, beverages, condiments, and other foods. Pork, dairy, tree nuts, and fresh fruits are major consumer food products exported to China. Exports of dairy products to China had been quite strong. In 2015, registration approval policies began to change, making it more difficult to export dairy products, as well as other food products, to China (Anderson-Sprecher, Wei, and Liwen, 2015).
Source: USDA, 2017a.
Source: Global Trade Atlas, 2017.
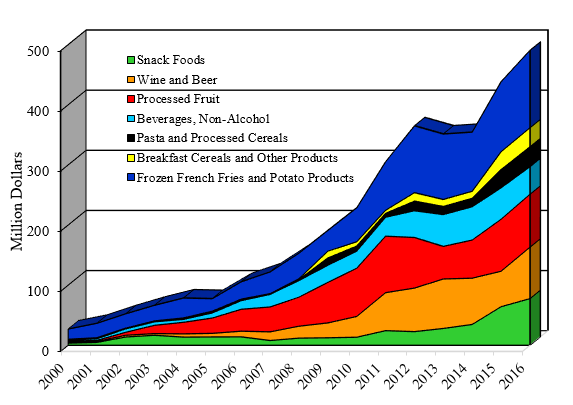
U.S. exports of processed foods to China have increased significantly since 2001 and have remained relatively stable (see Figure 3). A number of processed foods exported to China benefit from strong domestic demand. Sales have continued to increase even as exports of traditional bulk commodities and intermediate products to China have slowed in recent years. Demand for processed products is supported by rising incomes, expanding urbanization, an increasing middle class, growing health consciousness, convenience of processed foods, and easy access through retail outlets.
A major driving force in China’s domestic market is consumer awareness of food safety and nutritional value. Imported foods are often perceived to be safer than domestically produced foods, are associated with a higher nutritional value, and have more trusted nutritional labels. A number of food safety incidents and rising levels of pollution in China’s water, soil, and air have increased the level of concern many Chinese consumers have for food safety, especially for children’s food products.
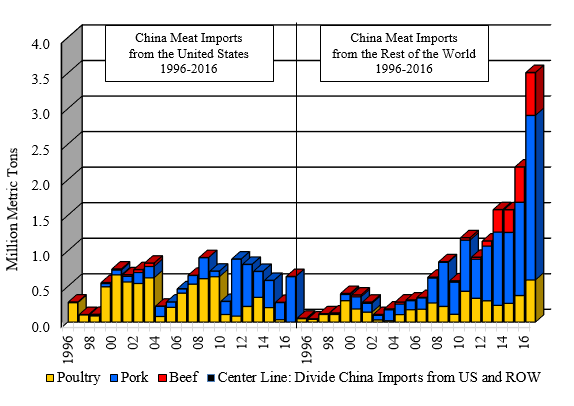
Current U.S. meat exports to China lost significant market share compared to exports in the early 2000s (see Figure 4). A number of countries placed a ban on U.S. beef imports based on the December 2003 bovine spongiform encephalopathy (BSE) case. China’s Ministry of Agriculture lifted the ban in September 2016, which is the first of three steps required in an ongoing process before the United States will be allowed to export beef to China (Inouye, 2016).
Prior to the ban on U.S. beef exports to China, U.S. beef exports were small but grew about 30% annually from 1995 through 2003, reaching almost 46,000 metric tons in 2003. During this same time period, beef exports to China from the rest of world grew only 14% annually.
In China, long-term business relationships are important and were partially lost during this import ban period. Brazil, Uruguay, and Australia are the largest beef exporters to China. Brazil is gaining market share as a low-cost producer, and exports to China grew over time. The United States will likely be able to successfully compete in higher-quality markets with grain-fed beef for specialized retail outlets, hotel, and restaurant sectors.
China produces and consumes half of the world’s pork and in 2016 became the largest importer of U.S. pork, followed by Japan and Mexico. The European Union (EU) is the largest pork exporter to China, with Germany and Spain the largest suppliers. In 2016, U.S. pork accounted for about 20% of China’s total pork imports.
China delisted a number of U.S. pork plants following positive tests for ractopamine (a feed additive) in 2014. All U.S. pork exports to China must be ractopamine-free. To prevent commingling, the United States has separate pork production and processing facilities for products exported to China. Beginning in 2016, previously delisted U.S. pork plants have started to gain approval by China.
About 66% of U.S. pork exported to China is edible offal, which includes ears, stomach, feet, snouts, and other parts. U.S. exports of swine breeding stock to China increased significantly from the early 2000s, to $19.8 million in 2013, as China’s herd expansion continued. However, U.S. exports dropped to previous levels as China contracted pig herds in 2015 due to increasing losses in pork production.
U.S. poultry exports to China have faced numerous barriers. In February 2004, a ban on U.S. imports due to avian influenza lasted one year. In 2010, China imposed new import tariffs on U.S. poultry and another ban was imposed in 2015 on U.S. poultry due to avian influenza (Bean and Jianping, 2004; Woolsey and Zhang, 2010; Li and Frederick, 2015; Xie and Marchant, 2015).
U.S. poultry exports to China consist mostly of offal and feet, for which there is little demand in the United States. The United States has also been the major exporter of grandparent flocks (the final generation of breeding birds) to produce white-feathered broiler chickens and, to a lesser degree, layers. Exports of U.S. live breeder chicks for broilers and layers to China averaged about $6.5 million per year in the 1990s. Exports grew to $38.7 million for broiler chicks by 2013 and accounted for about 20% of U.S. exports (USDA, 2017a).
Broiler chick exports dropped to $330,000 as China banned U.S. imports in January 2015 due to an outbreak of high pathogenic avian influenza (HPAI). South American countries have benefited from the continued import ban on grandparent stock for white-feathered poultry from the United States and some European countries, increasing their exports of broiler chicks to China.
Anderson-Sprecher, A., J. Wei, and C. Liwen. 2015. China Grain and Feed Annual. Washington, DC: U.S. Department of Agriculture, Foreign Agriculture Service, GAIN Report CH15014, May.
Bean, C. E., and Z. Jianping. 2004. China Poultry and Products Annual Poultry Report. Washington, DC: U.S. Department of Agriculture, Foreign Agriculture Service, GAIN Report CH4043, September.
Gale, F. 2015. Development of China's Feed Industry and Demand for Imported Commodities. Washington, DC: U.S. States Department of Agriculture, Economic Research Service, Feed Outlook No. FDS-15K-01, November.
Gale, F., J. Hansen, and M. Jewison. 2015. China’s Growing Demand for Agricultural Imports. U.S. Department of Agriculture, Economic Research Service, Economic Information Bulletin No. EIB-136, February.
Global Trade Atlas. 2017. Global Import/Export Commodity Trade Data: Chinese Customs Data. London: IHS Market, Global Trade Information Services. Available online: https://www.ihs.com/products/maritime-global-trade-atlas.html
Inouye, A. 2016. China Lifts Ban on U.S. Beef Exports. Washington, DC: U.S. Department of Agriculture, Foreign Agricultural Service, GAIN Report CH16050.
Li, W., and C. Frederick. 2015. China Poultry and Products Semi-annual: China’s Poultry Demand Remains Sluggish. Washington, DC: U.S. Department of Agriculture, Foreign Agriculture Service, GAIN Report 15007, February.
Olearchyk, R., and J. Blas. 2012, September 19. “Ukraine Agrees $3bn Loan-for-Corn Deal.” Financial Times.
Shuping, N., and D. Stanway. 2015, March 17. “China Orders over 600,000 ton Ukrainian Corn, Snubs U.S. Supplies.” Reuters.
U.S. Department of Agriculture (USDA). 2016. China Tree Nuts Annual. Washington, DC: U.S. Department of Agriculture, Foreign Agricultural Service, Office of Agricultural Affairs, GAIN Report CH16049, September.
U.S. Department of Agriculture (USDA). 2017a. Global Agricultural Trade System, Standard Query. Washington, DC: U.S. Department of Agriculture, Foreign Agricultural Service. Available online: https://apps.fas.usda.gov/gats/Default.aspx
U.S. Department of Agriculture (USDA). 2017b. Production, Supply and Distribution Data. Washington, DC: U.S. Department of Agriculture, Foreign Agricultural Service. Available online: https://apps.fas.usda.gov/psdonline/
U.S. Department of Agriculture (USDA). 2017c. USDA Agricultural Projections to 2026. Washington, DC: U.S. Department of Agriculture, Office of the Chief Economist, World Agriculture Outlook Board, Long-Term Projections Report OCE-2017-1, February. Available online: https://www.ers.usda.gov/publications/pub-details/?pubid=82538
Woolsey, M., and J. Zhang. 2010. China Poultry and Products Annual. Washington, DC: U.S. Department of Agriculture, Foreign Agriculture Service, GAIN Report CH10056, September.
Xie, C., and M. A. Marchant. 2015. “Supplying China’s Growing Appetite for Poultry.” International Food and Agribusiness Management Review, 18(A): 115–136.

