

Producers and consumers across the globe are concerned about the future impacts of a wealthier China. Many view its growing buying power as a potential market or investment opportunity while others worry that growing demand from China will stress natural resources or raise food prices. Still others view China as an emerging competitor.
In this article, we highlight major changes in China’s food demand and supply over the past three decades and discuss some of the factors behind those changes. Consumer demand in China has followed a path of rising animal protein consumption common among emerging countries, but we emphasize the role of prices in shaping consumption habits and production. The world food system can accommodate China’s changing diet if producers and consumers receive the right market signals about what commodities China needs—or doesn’t need.
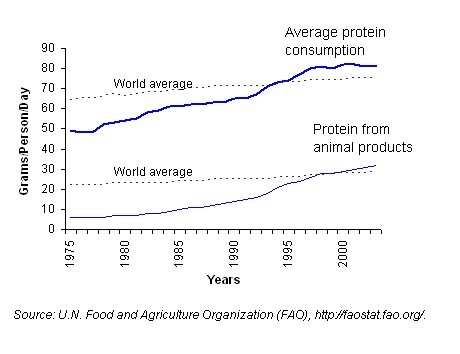
China’s agricultural sector has proven to be surprisingly resilient and flexible in responding to the country’s increasing and diversifying food intake (Lohmar et al.). In the three decades since China began its market-based reforms, rapid growth in per capita income has led to dramatic improvement in living standards and dietary change. According to FAO data, China’s per capita intake of calories, protein, and fat were all well below the world average in 1975, but each of these intakes is now well above the world average. Protein intake surpassed the world average in the mid-1990s, and protein from animal products surpassed the world average by the late 1990s (Figure 1).
At the same time food intake was rising, the share of Chinese households’ income spent on food fell from over half in the 1970s to about one-third now. The agricultural sector was able to generate a much-improved diet for Chinese citizens at low cost, allowing consumers to spend most of their income gains on nonfood items.
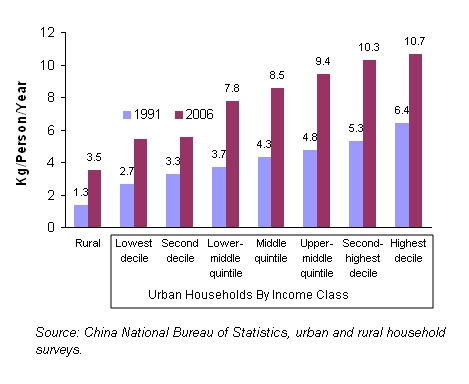
Changes in the diet are broad-based. High-income households with plentiful discretionary income are the main target for food marketers and retailers. China also has a large class of low-income and rural households who obtain as much as three-fourths of calories from staple grains (Jensen and Miller, 2008). But new consumption patterns are filtering down to the low-income population as well. For example, per capita poultry consumption rose sharply in every income class between 1991 and 2006. High-income households (the top decile) consumed about twice as much poultry per capita as did the lowest-income urban household strata in both years but the percentage increases were larger for low-income households (Figure 2). Consumption of poultry by the poorest urban households doubled. Rural households comprise more than half the population and now consume nearly 3.5 kg per person annually, about the same amount that was consumed by lower-middle-income urban households in 1991.
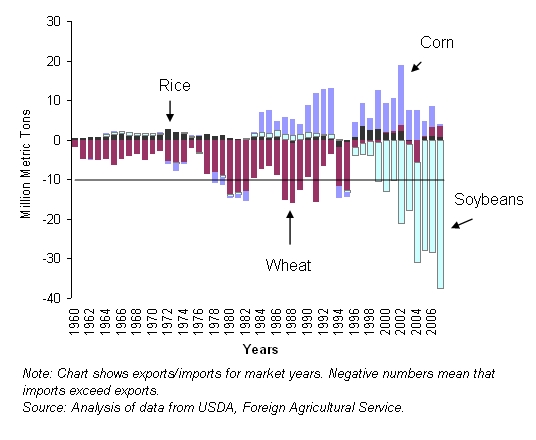
China is self-sufficient in most major commodities. Consumption of traditional staple grains—wheat and rice—has stagnated as diets diversified toward more meat. Once a major wheat importer, China’s wheat purchases have been modest in the most recent decade (Figure 3). Despite rising meat consumption, China remains an exporter of corn which is its most important feed grain. China imported large quantities of pork during 2007–08, but imports halted abruptly in 2008 as the domestic pork sector recovered from a temporary supply shortfall. China is a leading exporter of aquatic and horticultural products.
Imports have exploded for certain products—most prominently soybeans, vegetable oil and cotton. China has become the most important source of world demand for these products. Imports of soybeans surged from under 4 million metric tons in 1999 to 38 million metric tons in 2008. Imports of a host of other products have risen by smaller magnitudes. Its booming exports of textiles have made China the leading importer of cotton. China’s rising imports include premium products that are new to Chinese consumers: orange juice from Brazil and Israel; jasmine rice and tropical fruit from Southeast Asia; olive oil from Europe; and turkey meat from the United States. China is also a leading importer of barley for making beer and cassava for making starch and alcohol. It is a leading exporter of apples and apple juice, but it also imports premium-priced apples and oranges from the United States and Chile.
Most analyses attribute China’s dietary change to rising income, but changing relative prices have also played a role. Many of the major changes in Chinese diets occurred during the 1980s and early 1990s when most of the major distortions in prices created under central planning were eliminated. Allowing grain prices to rise in the 1980s and ‘90s encouraged farmers to plant more grain and induced the urban population to diversify their diets away from grains.
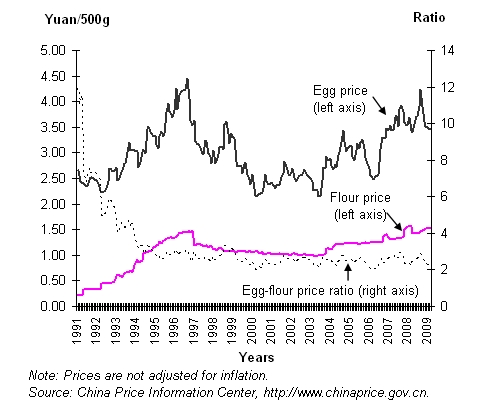
Consider, for example, the trend in prices of eggs versus wheat flour. In the early 1990s, consumer prices of staple grains—mainly rice and wheat flour—were controlled at low levels and products were rationed. Prices of “nonstaple” foods were mostly liberalized in the 1980s. In 1991, the retail price of eggs—a major source of protein in the Chinese diet—was about 12 times the price of flour (Figure 4). According to household surveys, urban people consumed 128 kg of grain products per capita that year, compared with just eight kg of eggs. As authorities relaxed controls on grain prices and abandoned rationing, the average retail price of both commodities (not adjusted for inflation) rose sharply, but grain prices rose faster. By 1995, the egg price was about three times the flour price. Since then, the ratio of egg to flour prices has been remarkably stable, fluctuating between two and three.
The decline in the relative price of eggs encouraged consumers to substitute eggs for grain. China’s egg consumption, as reflected by household surveys, rose sharply during the early 1990s period when the relative price of eggs was declining. Average urban per capita egg purchases rose from about seven kg per year in 1990 to about 11 kg in 1997. Per capita purchases of grain products fell sharply over that period. Interestingly, the rise in urban egg consumption stopped after 1997, a flattening of the trend that coincides with the leveling-off of the relative price of eggs.
China’s farmers are a fluid population of entrepreneurs always ready to enter or exit industries seeking the highest profits. China has seen big surges in production of dozens of commodities—fruits, vegetables, fish, poultry—induced by profit opportunities. Production of many commodities has expanded so fast that supply overwhelmed demand, driving prices down until profits were erased. For example, since 1991 egg production has tripled and the average egg price (with no adjustment for inflation) in figure 4 shows no discernable upward trend during 1991–2009. When the price rises, supply increases, knocking the price back down. The egg price has followed an upward trend at times, but it has dropped sharply at other times. The retail price of eggs in 2009 was about 3.3 yuan per 500 grams, roughly the same as 15 years earlier.
Poultry and eggs have been important contributors to dietary change and efficiency of resource use in China. Pork is traditionally the dominant meat consumed in China, but poultry and egg production and consumption has grown much faster. Chickens convert feed to meat and eggs more efficiently than pigs and cattle—the feed conversion ratio for poultry and eggs is less than 2:1 vs. 3:1 for pork. The increase in poultry and egg production provided animal protein efficiently at low cost. Since poultry feed has a high proportion of soybean meal, the growth of poultry has been an important factor behind China’s exploding soybean demand.
Chinese farmers still have a lot of potential to increase production efficiency (Lohmar et al., 2009). Officials have been pushing farm mechanization, new seed varieties and animal breeds, and a “modern agriculture” campaign that subsidizes breeding farms, greenhouse agriculture, “ecological” demonstration projects, and other measures. Chinese policymakers are experimenting with new types of rural credit institutions, cooperatives, and new ways of leasing and transferring land to create larger-scale farms (Gale, Lohmar, and Tuan, 2009). The vast central and western regions of China have considerable potential to raise productivity and integrate small farmers into modern supply chains. Some of the resources devoted to producing exports of corn, fruits, vegetables, and fish may be redeployed to produce for the domestic market if they receive the right price signals.
Policymakers in China acknowledge the important role of markets in resource allocation, but they try to engineer market outcomes using various subsidies, taxes and price controls. Their response to soaring pork prices in 2007 shows how policymakers can underestimate the role of market prices in resource allocation.
Chinese officials became gravely concerned when pork prices soared about 50–60 percent in 2007. Officials were worried that soaring prices could portend general inflation and erode the purchasing power of poor people. There were concerns that the supply was constrained by disease and rising feed costs. The government rolled out an aggressive package of subsidies designed to boost pork production, including a doubling of the per-head subsidy for breeding sows, a new subsidy for sow insurance, subsidies for breeding centers, barn construction, and immunizations. Local authorities were encouraged to attract pork processing and feed companies to invest in large vertically-integrated “production bases.” Corporate income taxes were waived for companies involved in hog farming.
Pork production is a prominent example of an industry in which farmers regularly expand and contract production as prices fluctuate. Most production is small scale with little fixed investment, so farmers can enter, exit, expand, or shrink production relatively easily. Authorities apparently did not anticipate that high pork prices would provide strong incentives for farmers to enter the hog industry. Nonfarm businesses also entered hog farming. In 2007–08, news articles reported many instances of foreign investment banks, Chinese real estate businesses, feed companies and large meat processors setting up farms raising thousands of hogs. It is likely that pork supplies would have rebounded without the policy inducements, as they had done in earlier up-down cycles.
By mid-2008 hog production was surging again and pork prices were falling rapidly. By the end of 2008, there were news reports of widespread losses and farmers began liquidating sows. The decline in pork prices accelerated in 2009 and the government announced intentions to implement a new pork stock-holding program intended to support hog prices.
The pork price surge also revealed Chinese consumers’ sensitivity to price. Per capita pork purchases reported in Chinese household surveys declined for all but the richest decile of urban households. The amount of the decrease in consumption and the percentage decrease was greater for lower-income households (Table 1). Those in the middle fifth of urban households reduced their purchases by 1.9 kg (9%) and those in the lowest income category decreased their purchases by 3.1 kg (19%). Rural households reduced consumption by 2.1 kg (14%). The larger response by low-income consumers is consistent with Zheng and Henneberry’s (2009) finding that low-income consumers are especially sensitive to both price and income changes.
The price-sensitivity of Chinese households means that consumption patterns are flexible. The Chinese diet is driven to some extent by the inertia of tradition, but it can be altered by changing relative prices. Pork has historically been the predominant meat consumed in China, but its consumption has stagnated as the supply of low-priced alternatives like poultry and farm-raised fish has risen.
Conversely, growth in beef consumption is limited by its relatively high cost. Beef and mutton are the most expensive meats in China--retail prices are about twice the price of chicken and 5 times the price of eggs. The high price of beef in China reflects the scarcity of rangeland and consequent high cost of raising ruminant animals. Beef consumption is rising in step with the proliferation of hamburger and hot pot restaurants and steakhouses, but its expense will probably prevent it from becoming a major component of the Chinese diet.
Farmers in China and overseas have shown that they can respond and adjust to changes in demand and resource scarcity in China when they receive the right price signals. For example, producers in South America and the United States have boosted soybean acreage to accommodate China’s booming demand. Traders and farmers in the United States are keenly attuned to China’s soybean demand. Similarly, market information websites in China carry daily reports on Chicago soybean prices.
The world does not always receive accurate signals from China. During the 2007–08 spike in world commodity prices, Chinese authorities imposed policies that shut off grain exports to prevent domestic prices from rising. There is some evidence that the export restraint on corn directly affected world prices—buyers from South Korea and other markets had to look elsewhere for corn when Chinese corn disappeared from the international market (Dollive, 2008). The grain export restraints also may have sent the world a false signal of scarcity. Articles in the news media and investment newsletters routinely referred to “demand from China” (for an example, see Krugman, 2008) as a cause of the global commodity price spike. Headey and Fan (2008) have argued that this was not a major cause, but at the time China’s withdrawal from the export market seemed to support this notion. One of the authors of the current article received an unusual surge of inquiries about China’s food consumption statistics from investment firms during this period, as financial newsletters began to recommend investments in commodities based on the prospect of rising demand from China.
When China cut off grain exports it still had vast amounts of grain in warehouses. China does not reveal how much grain it holds in reserve, but materials from China’s State Council indicated that reserves had grown 5 years in a row and were 35% of a year’s consumption in 2008 (Gale, Lohmar, and Tuan, 2009). Wheat reserves were believed to be particularly large because the government had been buying wheat at support prices for several years.
When world commodity prices began plummeting in the fall of 2008, China suddenly had a glut of most commodities. Chinese authorities began supporting prices and stockpiling wheat, rice, corn, sugar, pork, rapeseed, rubber and pork. The government purchased most of the northeastern region’s 2008 corn and soybean harvests. The high support price discouraged private sector purchases and the stockpiles of corn and soybeans overwhelmed warehouses. China’s soybean imports accelerated to a record pace in 2009 despite a good domestic harvest because imported soybeans were so much cheaper. Many soybeans remained unsold in farmers’ backyards. China’s booming demand for imported pork in 2008 dried up the following year as the recovery of the pork sector pushed hog prices down. By May 2009, the Chinese government was preparing to stockpile frozen pork to support prices.
It is likely that China’s role in international agricultural trade will grow. The country faces many challenges, such as widening income disparities, unemployment, and the prospect of an aging population, but more growth and dietary change is certain. Increasing animal protein consumption and other dietary changes are likely to continue as new consumption habits filter down to the general population.
As China grows, its limited resource base will constrain its ability to meet its growing demand for food and fiber. More integration with world markets is inevitable. The integration can proceed more smoothly if world markets receive accurate signals about China’s demand growth and resource scarcity.
China National Bureau of Statistics. China Statistical Yearbook. Beijing: China Statistical Press, various years. Available online: http://www.stats.gov.cn/english/statisticaldata/yearlydata/.
Dollive, K. (2008, September). The Impact of Export Restraints on Higher Grain Prices. (Working Paper). Office of Economics, U.S. International Trade Commission.
Gale, F., Lohmar, B, and Tuan, F. (2009, June). How Tightly Has China Embraced Market Reforms in Agriculture?” Amber Waves, Vol.7, pp. 30–35.
Headey, D., and Fan, S. (2008). Anatomy of a Crisis: the Causes and Consequences of Surging Food Prices. Agricultural Economics 39 supplement, pp. 375–91.
Jensen, R.T., and Miller, N.H. (2008). The Impact of Food Price Increases on Caloric Intake in China. Agricultural Economics 39(2008) supplement, pp. 465–76.
Krugman, P. (2008, April 7) Grains Gone Wild, The New York Times.
Lohmar, B., Gale, F. Tuan, F., and J. Hansen. (2009, April) China’s Ongoing Agricultural Modernization: Challenges Remain After 30 Years of Reform. USDA/ERS. EIB 51.
USDA, Foreign Agricultural Service. Production, Supply and Distribution. Available online: http://www.fas.usda.gov/psdonline/psdHome.aspx.
Zheng, Z., and Henneberry, S. (2009, April). Changes in Income Distribution and Food Demand in China . (Working Paper). Department of Agricultural Economics, Oklahoma State University.
| Type of household | Change in pork consumption | |
| Kg | Percent | |
| Urban households | -1.8 | -9 |
| Rural households | -2.1 | -14 |
| Urban households by income class: | ||
| Highest decile | 0 | 0 |
| Second-highest decile | -1.2 | -5 |
| Upper-middle quintile | -1.3 | -6 |
| Middle quintile | -1.9 | -9 |
| Lower-middle quintile | -2.1 | -11 |
| Second-lowest decile | -2.5 | -14 |
| Lowest decile | -3.1 | -19 |
Note: Rural data refer to consumption; urban data are purchases. Data do not include away-from-home consumption.
Source: Calculations based on National Bureau of Statistics household surveys.
This article is based on work supported by the U.S. Department of Agriculture’s Emerging Markets Program and Hatch Project No. 02702 of the Oklahoma State University Agricultural Experiment Station. The opinions expressed in this article are those of the authors and do not represent those of the U.S. Department of Agriculture