Meat and livestock producers have recently faced a confluence of challenges, leading to uncertainty about future supply, demand, and profitability. Drought, high feed prices, and the porcine epidemic diarrhea virus have accompanied concerns about “pink slime,” gestation crates, and climate change. Such current events have led to critical commentary in major media outlets (Bittman, 2014; and McWilliams, 2012), highlighting the need for timely information on consumer knowledge, beliefs, and sentiments. These issues have come about in the midst of record-high beef prices, which have also garnered significant media attention (Byron, 2014; and Gee and Newman, 2014) and have led to questions about the extent to which consumers are willing to trade concerns about technologies and practices, such as “pink slime,” for lower prices (Bunge and Gee, 2014).
Although supermarket scanner data is available to analyze immediate past behaviors, analyses based on such data are inherently backward-looking because they use historical data of market outcomes that happened in the past. Moreover, analyzing consumer demand using scanner data is tricky because it is hard to separate supply- from demand-side issues and because of unobserved quality variation and retail promotions. Current meat demand indices (Tonsor, 2010) provide useful information about trends in consumer preferences. However, these indices are aggregate, are released only quarterly, and attribute all price and quantity changes to shifts in demand. Although some marketing companies routinely track eating intentions and awareness of food issues, the data is proprietary and is not publically released in any uniform fashion. Moreover, their survey questions are not always designed using consumer research techniques, such as choice experiments, that require respondents to make trade-offs. These issues suggest the need for a consumer tracking survey.
Starting in May 2013, the Food Demand Survey (FooDS) has been conducted through partial funding provided by the Willard Sparks Endowed Chair and the Oklahoma Agricultural Experiment Station. (See Box.) The purposes of the project are to provide timely information on:
The overall goal of the project is to generate data to enable an understanding of trends in beliefs, demand and awareness, forecast changes in consumption, and complement existing sources of secondary data (for example, U.S. Department of Agriculture (USDA) disappearance or scanner data) in food-demand analysis.
FooDS tracks consumer preferences and beliefs about the safety, quality, and price of food with particular focus on meat demand. FooDS is a national monthly online survey with a sample size of at least 1,000 individuals each month. The results released each month are weighted to match the U.S. population in terms of age, gender, education, and region of residence. The survey consists of a series of questions that are asked in exactly the same way each month.
Each respondent answers nine choice questions, with nine alternatives. There are two beef options, two pork options, two chicken options, and two non-meat options, in addition to a “no purchase” option. Each question shows an image of each food type, and consumers are asked to pick which of the options they would choose from the grocery store for dinner. Prices are varied across choices so that, for example, the price of ground beef is uncorrelated with the price of steak or chicken breast. Statistical models are used to estimate preferences for each meal option relative to the “no purchase” option, and we calculate willingness-to-pay (WTP) as the projected price of each option that would lead the consumer to being indifferent to purchasing each option and not purchasing.
Average weekly food expenditures at home and away from home are measured each month. The questions are worded similarly to those used by the BLS in the quarterly Consumer Expenditure Survey. Respondents indicate the extent to which they agree or disagree (on a 1 to 5 scale) with eight statements corresponding to planned behavior or expectations in the next two weeks relative to the past two weeks. Statements include issues like “I plan to buy more beef” and “I expect the price of beef to be higher.” We report the results in terms of the percentage of respondents agreeing with each statement minus the percentage of respondents disagreeing with each statement.
To track awareness and concern over time, respondents are shown 16 issues. A 17th issue was later added in response to a news event. These issues are: Salmonella, E. coli, hormones, antibiotics, farm animal welfare, GMO, pink slime, swine flu, cloning, bird flu, mad cow, gestation crates, battery cages, greenhouse gas, bovine somatotropin encephalopathy (BSE), Zilmax, and beta-agonist. Initially, respondents are asked for each issue: “Overall, how much have you heard or read about each of the following topics in the past two weeks?” where 1= nothing; 2= a little; 3=a moderate amount; 4=quite a bit; 5=a great deal. Following this question, a similar table appeared with the same set of issues, asking, “How concerned are you that the following pose a health hazard in the food that you eat in the next two weeks?” where 1=very unconcerned and 5=very concerned.
Each month, we also track a number of other issues, such as relative food values, food challenges, food stamp participation, and food-borne illnesses, among others. In addition to the regular questions, two or three ad hoc questions are added each month to provide timely information on emerging food issues.
Each month, two to three ad hoc questions are added to the survey to gauge public opinion about current policy or marketing issues. Below are two recent examples:
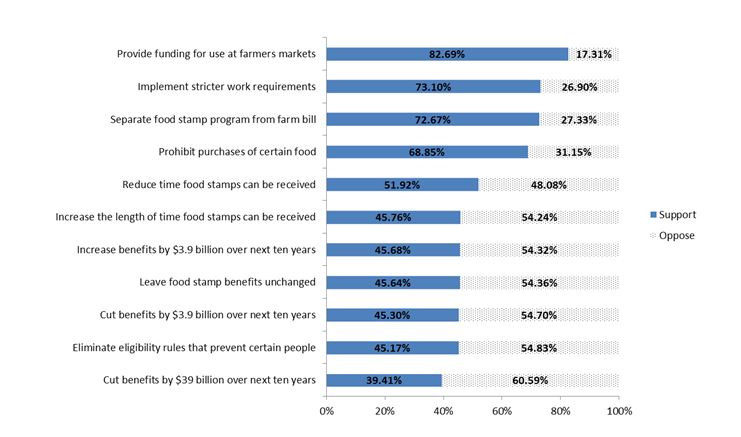
Figure 1 shows one example of an ad hoc question added to FooDS in October 2013 during the 2014 Farm Bill debate. One aspect of the debate related to the restrictions and budget cuts related to the supplemental nutrition assistance program (SNAP), also known as “food stamps.” In the October 2013 survey, respondents were asked to state whether they “support” or “oppose” 11 different proposed changes to the program. More than half of the participants were in support of providing funding for the use of food stamps at farmers’ markets, implementing stricter work requirements, separating the food stamp program from the farm bill, prohibiting the purchase of certain food items, and reducing the amount of time food stamps can be received. Large reductions in food stamp expenditures were least desired by the public, although this issue generated a high-profile debate in the U.S. House of Representatives during farm bill deliberations.
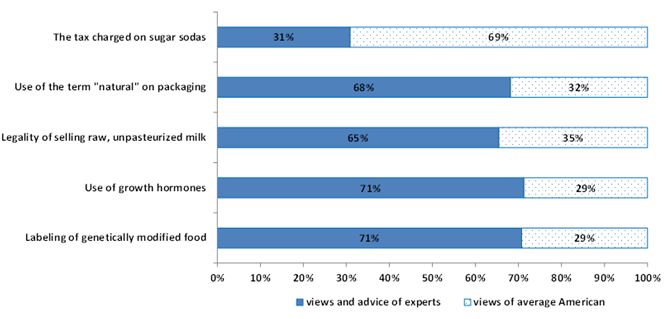
The emergence of local and state ballot initiatives on labeling of genetically engineered food and soda taxes, among other food issues, prompted the addition of the questions illustrated in Figure 2 in the July 2014 edition of FooDS. Of interest was whether the public prefers that particular food policy issues be determined by “experts” or the “views of the average American.” For most of the issues queried, such as labeling of genetically engineered food, respondents favored the opinions and advice of experts over that of the average American. The opposite was the case for taxes on sodas.
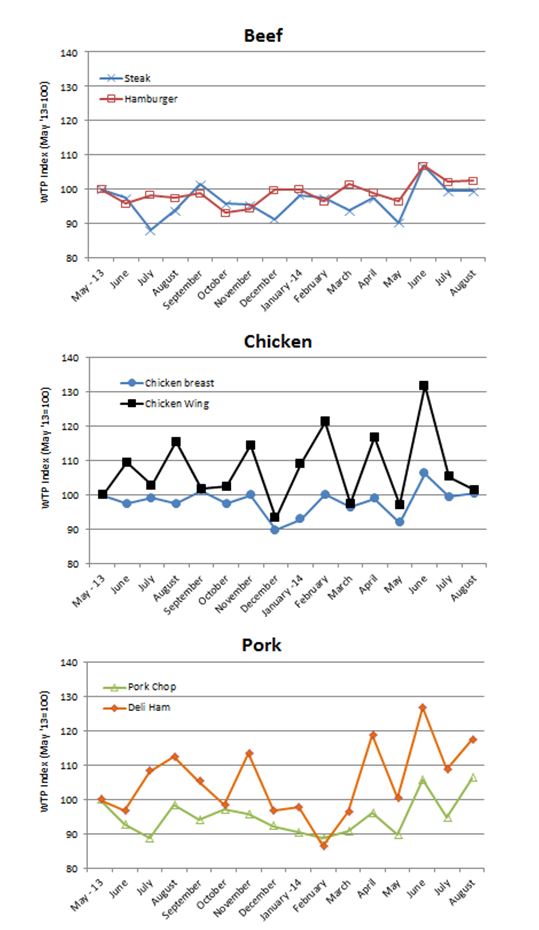
FooDS tracks willingness-to-pay (WTP) for eight food items by asking consumers a series of discrete choice questions (technical details are available in Lusk, 2013). Table 1 shows the outcomes over the course of the past 16 months (note: 95% confidence intervals for meat WTP values are approximately ± $0.20). Figure 3 shows WTP for each product in each month reported as an index value set relative to May 2013. For example, the WTP index for steak in April 2014 was 97.7, meaning WTP for steak in April 2014 was (97.7 – 100 = -2.3) 2.3% lower than in May 2013. WTP for chicken wings experienced a spike in February (which included the Super Bowl). WTP for steak and chicken breasts were at their highest in June 2014. While there is month-to-month variation, WTP for meat items has remained relatively stable and, if anything, WTP for steak and chicken wings appears to have trended upward over time. Such demand stability is remarkable in light of the large amount of negative publicity related to animal welfare issues, food safety, health, and environment that meat production and consumption has received in recent years.
| Willingness-to-Pay | Steak | Chicken Breast | Hamburger | Pork Chop | Deli Ham | Chicken Wing | Beans and Rice | Pasta |
| May-13 | $7.03 | $5.03 | $4.21 | $3.91 | $2.28 | $2.07 | $1.92 | $1.86 |
| Jun-13 | $6.87 | $4.90 | $4.03 | $3.63 | $2.21 | $2.27 | $2.26 | $3.45 |
| Jul-13 | $6.20 | $4.99 | $4.14 | $3.47 | $2.47 | $2.13 | $2.30 | $3.17 |
| Aug-13 | $6.60 | $4.90 | $4.11 | $3.85 | $2.57 | $2.39 | $2.29 | $3.21 |
| Sep-13 | $7.15 | $5.10 | $4.16 | $3.68 | $2.40 | $2.11 | $2.36 | $3.47 |
| Oct-13 | $6.74 | $4.91 | $3.92 | $3.80 | $2.25 | $2.12 | $2.18 | $3.22 |
| Nov-13 | $6.71 | $5.03 | $3.97 | $3.75 | $2.59 | $2.37 | $2.22 | $3.21 |
| Dec-13 | $6.42 | $4.52 | $4.20 | $3.61 | $2.21 | $1.93 | $1.97 | $3.40 |
| Jan-14 | $6.91 | $4.68 | $4.21 | $3.54 | $2.23 | $2.26 | $2.15 | $3.18 |
| Feb-14 | $6.87 | $5.04 | $4.06 | $3.47 | $1.97 | $2.51 | $2.04 | $3.18 |
| Mar-14 | $6.59 | $4.86 | $4.28 | $3.55 | $2.20 | $2.02 | $1.57 | $3.19 |
| Apr-14 | $6.87 | $4.98 | $4.17 | $3.76 | $2.71 | $2.42 | $2.27 | $3.13 |
| May-14 | $6.35 | $4.63 | $4.06 | $3.51 | $2.29 | $2.01 | $2.08 | $3.13 |
| Jun-14 | $5.35 | $5.35 | $4.50 | $4.14 | $2.89 | $2.73 | $2.62 | $3.82 |
| Jul-14 | $5.00 | $5.00 | $4.30 | $3.71 | $2.48 | $2.18 | $1.80 | $2.98 |
| Aug-14 | $7.01 | $5.05 | $4.32 | $4.16 | $2.68 | $2.10 | $2.08 | $3.36 |
| Minimum | $6.20 | $4.52 | $3.92 | $3.47 | $1.97 | $1.93 | $1.57 | $1.86 |
| Maximum | $7.52 | $5.35 | $4.50 | $4.16 | $2.89 | $2.73 | $2.62 | $3.82 |
| Date | Current weekly at home | Current weekly away from home | Anticipated change in at home in 2 weeks | Anticipated change in away from home in next 2 weeks |
| May-13 | $92.37 | $45.54 | -0.63% | -1.77% |
| June-13 | $92.54 | $43.60 | -0.60% | -2.13% |
| July-13 | $92.84 | $46.06 | -0.74% | -2.40% |
| August-13 | $91.87 | $46.35 | -0.50% | -2.09% |
| September-13 | $93.33 | $45.63 | -0.53% | -1.77% |
| October-13 | $96.52 | $44.84 | -0.85% | -1.79% |
| November-13 | $94.00 | $45.31 | 0.25% | -2.01% |
| December-13 | $91.40 | $43.95 | 0.21% | -1.63% |
| January-14 | $92.11 | $45.54 | -0.65% | -1.93% |
| February-14 | $94.37 | $48.81 | -0.13% | -1.32% |
| March-14 | $95.32 | $48.66 | -0.35% | -1.34% |
| April-14 | $91.68 | $45.57 | -0.16% | -1.51% |
| May-14 | $96.34 | $50.15 | -0.55% | -1.81% |
| June-14 | $94.34 | $46.89 | -0.16% | -1.63% |
| July-14 | $94.08 | $49.61 | -37.50% | -1.48% |
| August-14 | $93.22 | $48.90 | -0.36% | -1.41% |
| Minimum | $91.40 | $43.60 | -0.85% | -2.40% |
| Maximum | $96.52 | $50.15 | 0.25% | -1.32% |
Table 2 reports the estimated weekly food expenditures at home and away from home. In the most recent period reported, August 2014, consumers reported spending $93.22/week at home and $48.90/week away from home for their household. These data are reasonably consistent with that reported by the U.S. Bureau of Labor Statistics (BLS), which suggests average weekly expenditures on food at home, away from home, and alcoholic beverages of about $76, $50, and $9, respectively, over this time period (BLS, 2014).
Throughout the 16-week period, the stated expected change in at-home food expenditures remained highly stable, ranging from a low of -0.85% to 0.25%; however, the actual changes were something higher. For example, from April to May 2014, at-home expenditures increased from $91.68 to $96.34, a 5.08% increase. The results suggest that consumers’ expectations do not always match well with what they report as their actual expenditures. This is most readily apparent when looking at the stated, expected change in away-from-home expenditures. In all 16 weeks, consumers report that they plan to spend less on food away from home. Yet, looking at the month-to-month changes in stated away-from-home expenditures, they do not always decrease.
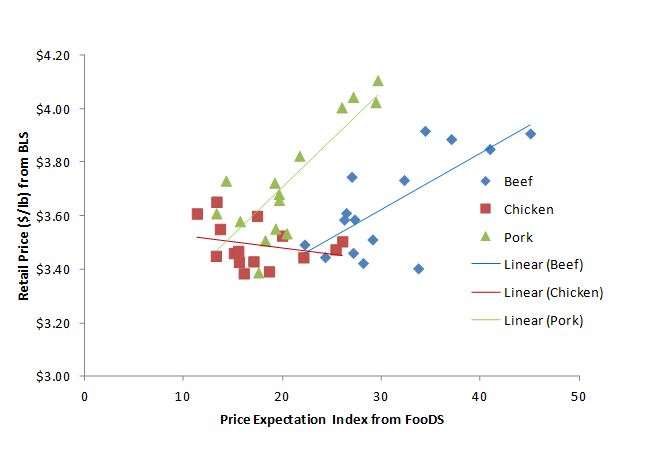
More consumers plan to buy more chicken than plan to buy less, regardless of the month of the survey (Table 3). The opposite was true for beef and pork for all time periods except the most recent which, for the first time since FooDS began, a larger proportion of consumers planned to buy more beef than planned to buy less. At the beginning of the period, the difference in consumers expecting beef prices to rise vs. fall was 27.14%, a value that rose to over 40% this summer. Price expectations for beef and pork rose alongside actual price increases over this time period. To illustrate, Figure 4 plots the FooDS price expectations index for beef, pork, and chicken against the same-month price data from the BLS on ground chuck, all pork chops, and boneless chicken breasts. For the first two meats, the correlations—a statistical measure of association, with 1.00 being a perfect correlation—between price expectations and actual prices are 0.72 and 0.83, showing a high correspondence between consumer expectations and actual prices. The correlation for chicken, however, was only -0.26. This latter result likely arises because actual prices for beef and chicken have trended up over this time period while chicken prices have not. However, consumers do not differentiate much between meat categories in their price expectations; the correlations among price expectations for beef, pork, and chicken are all above 0.89.
|
Table 3: Future Price and
Consumption Expectations
Note: Values reported are the differences in percent of consumers agreeing and disagreeing (%) with each statement.
|
Figure 4: Correlation between Price
Expectations from FooDS vs. Retail Prices Measured by BLS
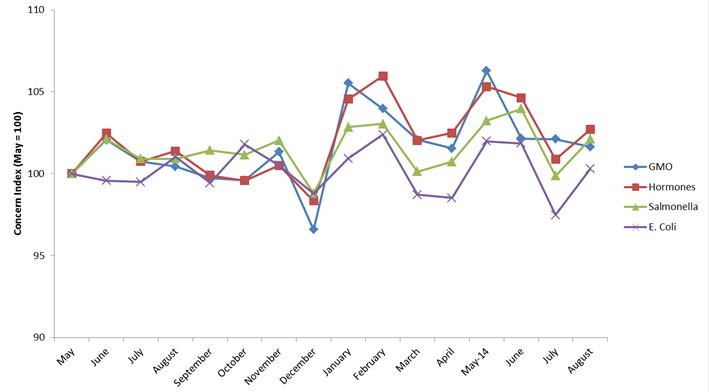
Figure 5: Trend in Awareness of Top
Four Issues in the News (May 2013 = 100)
|
||||||||||||||||||||||||||||||||||||||||||||||||||||||||||||||||||||||||||||||||||||||||||||||||||||||||||||||||||||||||||||||||||||||||||||||||||||||||
Awareness and concern for 17 food issues have been tracked over the course of the survey. GMOs, Salmonella, E. coli, and hormones have been the top four issues consumers report hearing most about in the news. As shown in Figure 5, a significant increase in awareness was seen for Salmonella in October 2013, likely as a result of a widely publicized outbreak in a California meat processor. Interestingly, spikes in awareness (for example, Salmonella in October 2013) do not always correspond with changes in concern.
GMOs, Salmonella, E. coli, and hormones were also ranked as the issues of most concern among consumers in the past year. Concern for all food issues fell in December and rose in January and February, as shown in Figure 6. In November 2013, Zilmax, a name-brand beta-agonist fed to cattle in order to improve feed efficiency and produce more lean beef vs. fat, was added to the list of awareness and concern issues in response to the issue appearing in the news. In February 2014, Zilmax was replaced with beta-agonist in both the awareness and concern categories.
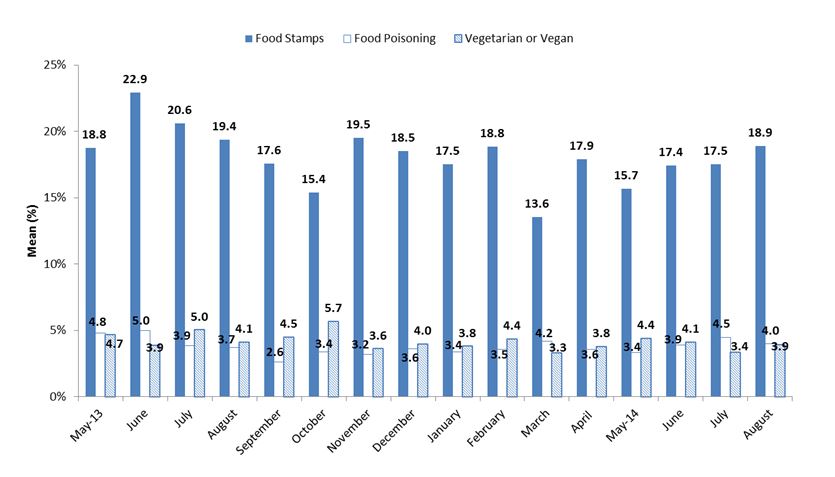
Each month, the percent of respondents who reported being on food stamps, being vegetarian or vegans, or have had food poisoning in the last month was calculated, and is reported in Figure 6. Food stamp participation has been a hot-button political issue after the rapid run-up in enrollment following the recession and it is a factor that could affect food and meat demand and, as such, FooDS tracks this statistic over time. June 2013 had the highest frequency of food-stamp participants. To our knowledge, there is not a good measure of vegetarian status over time; however, FooDS seeks to establish whether a trend emerges on this issue. October 2013 saw the largest percent of people who reported being vegetarian or vegan at 5.66%. Federal agencies, such as the U.S. Food and Drug Administration (FDA) and the Centers for Disease Control and Prevention (CDC), report the number of food recalls and the number of laboratory-confirmed infections from foodborne illness. However, not all food recalls lead to illness, and not all illnesses result in a visit to medical authorities. Thus, there is need for a measure of the number of people in the U.S. population who have experienced foodborne illness over time (Roberts, 2014). Figure 7 shows this statistic over time. Reported food poisoning was highest in June 2013 at 5.01%.
Tracking consumer awareness and concern of food-related issues and events can be used to analyze immediate past consumer behavior and predict changes in demand based on current issues. FooDS provides a means to keep a pulse on consumer sentiments about food that may one day be fruitfully combined with other sources of data to better explain and predict market behavior. No survey, including FooDS, is perfect. There are likely concerns with representativeness and hypothetical bias, among others. A key advantage of a tracking study like FooDS, however, is that these potential survey biases are likely to remain constant over time so that changes and trends in consumer preferences can provide meaningful information. As FooDS continues into the future, it is possible that the results could be used to forecast future price changes or consumption behavior. At present, the data is already providing key insights. For example, for a drop in per-capita consumption of beef, FooDS data helps support the view that this is a result of supply-side changes because beef demand has remained robust. To receive monthly updates from FooDS, or to suggest future ad hoc questions, contact info.survey@okstate.edu. Each month’s report can be found on the project website (Lusk, 2013).
Bittman, M. 2014, July 15 “The True Cost of a Burger.” New York Times. Available online: http://www.nytimes.com/2014/07/16/opinion/the-true-cost-of-a burger.html
Bunge, J. and K. Gee. 2014, May 23 “'Pink Slime' Makes Comeback as Beef Prices Spike.” Wall Street Journal. Available online: http://online.wsj.com/news/articles/SB10001424052702303749904579579991127674958
Byron, E. 2014, August 27. “High Food Prices Lead to Trade-offs Even in Upper-Income Households.” Wall Street Journal. Available online: http://online.wsj.com/articles/high-food-prices-lead-to-trade-offs-even-in-upper-income-households-1409094494
Gee, K. and J. Newman. 2014, June 29 “Restaurants, Grocers Respond to Rising Beef Costs.” Wall Street Journal. Available online: http://online.wsj.com/articles/restaurants-grocers-respond-to-rising-beef-costs-1404085844
Lusk, J. 2013. “Survey Questions and Methods.” Department of Agricultural Economics, Oklahoma State University. Available online: http://www.agecon.okstate.edu/agecon_research.asp
Lusk, J. and S. Murray. Food Demand Survey. Department of Agricultural Economics, Oklahoma State University. Available online: http://www.agecon.okstate.edu/agecon_research.asp
McWilliams, J. 2012, April 13 “The Myth of Sustainable Meat.” New York Times. Available online: http://www.nytimes.com/2012/04/13/opinion/the-myth-of-sustainable-meat.html?_r=0
Roberts, T. 2014 “Lack of Information Is the Root of U.S. Foodborne Illness Risk.” Choices. Available online: http://www.choicesmagazine.org/choices-magazine/submitted-articles/lack-of-information-is-the-root-of-us-foodborne-illness-risk
Tonsor, G.T. 2010. “Intuition and creation detail of beef demand indices.” AgManager.infoKansas State University. Available online: http://www.agmanager.info/livestock/marketing/graphs/Meat%20Demand/Index/IndexOverview_09-14-10.pdf
U.S. Bureau of Labor Statistics. 2014. “Consumer Expenditure Survey.” U.S. Department of Labor. Available online: www.bls.gov/res/#data