Food waste is an environmental, economic, and social problem, but defining and measuring the problem has proved a struggle (Roodhuyzen et al., 2017). Definitions to date have depended on the nature of the project. For example, Buzby, Wells, and Hyman (2014) define food waste as a component of food loss; that is, any edible item discarded at different levels of the supply chain (e.g., food discarded at the retail level due to external blemishes or at the consumer level for various reasons). Meanwhile, Wilson et al. (2017, p. 37) define premeditated food waste as “the expected amount of food waste consumers create based on the influence of date labels which affect consumers’ perceptions of a product’s quality and safety.”
Several studies (Bellamare et al., 2017; Buzby and Hyman, 2012; Gustavsson et al., 2011; Kummu et al., 2012; Stefan et al., 2013) attempt to measure food waste and food loss, but they are not consistent in their approach. For example, Gustavsson et al. (2011) use FAO food balance sheets from 2007 and find that food waste in North America and Europe amounted to 95–115 kg/person/year. Buzby and Hyman (2012) find that approximately 123.9 kg/person were lost in the U.S. food supply chain in 2008. This measurement problem often results from the lack of a clear definition of food waste. In this study, participants’ food waste was characterized as the quantity disposed as a share of ingredients or meals bought.
If it were integrated into CO2 emissions by various countries, food waste would rank third behind the United States and China as the largest CO2 emitters (FAO, 2013b). The U.S. Environmental Protection Agency (2018a) estimates that in 2015, 39.7 million tons of food waste were generated in the United States, and 30.3 million tons of that were sent to landfills. At the retail and consumer level, roughly 31% of food available for human consumption went uneaten in 2010, amounting to $161.6 billion in 2010 retail prices (Buzby, Wells, and Hyman, 2014).
While researchers can document the problem, a feasible solution to reducing food waste might be difficult to implement. Retailers focus on keeping shelves fully stocked and disposing of products that go bad. If they do not stock shelves, they face a potential shortage of certain products or a lack of variety for consumers, negatively impacting their business (Peterson, 2018). Consumers prefer variety in their food choices (Dixit and Stiglitz, 1977; Spence, 1976) and typically fail to plan grocery trips effectively (FAO, 2013b; Schanes, Dobernig, and Gözet, 2018). Consumers’ desire for convenience and struggle to plan for future food consumption contribute to the food waste problem. As a result, grocery store stocking decisions are complex, with much uncertainty about demand.
In this article, we assess consumer willingness to pay for foods prepared using a new food-processing technology, a pasteurization process based on microwave treatments called Microwave Assisted Pasteurization Systems (MAPS), which can improve the appearance, texture, and flavor of ready-to-eat meals and extend shelf life compared to other equivalent processing technologies (Tang, 2015). We also examine whether there are linkages between stated shelf life dates and estimated premeditated food waste for the different ingredients used in the choice experiment. We collected data using an online survey via Qualtrics in which we asked questions about premeditated food waste according to different shelf life dates and conducted a discrete choice experiment to compute willingness to pay for reduced food waste.
In the discrete choice experiment included in our survey instrument, we presented respondents with eight scenarios, each of which mimicked a shopper facing a choice at the grocery store to either purchase ingredients to make a recipe or purchase a ready-to-eat meal. We presented respondents with pictures of the two choices: a bundle of raw ingredients and a ready-to-eat meal. This bundle of raw ingredients (chicken, basil, garlic, cherry tomatoes, and broccoli) closely matched the ingredients in the ready-to-eat meal (chicken piccata with penne rigate and broccoli). For both choices, we used three attributes: price, expected food waste percentage, and shelf life. The price levels were $12, $14, and $16. These prices were based on both the estimated cost of the bundle of raw ingredients to feed a family of four and the cost of ready-to-eat meals with four servings, as displayed in grocery stores.
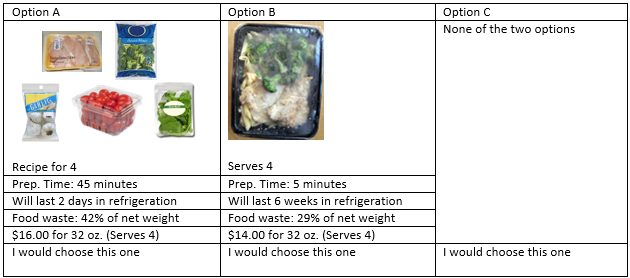
The percentages of expected food waste were 29%, 42%, and 61%. These percentages were based on findings from Wilson et al. (2017) of estimated premeditated waste for products such as salad, cereal, and yogurt with far, middle, and near expiration dates. The shelf-life levels were 2 days, 4 days, and 6 weeks. The 2 and 4 days of shelf were based on the shelf life of the most perishable ingredient in the bundle of raw ingredients, obtained from the Foodkeeper App (U.S. Department of Health and Human Services https://www.foodsafety.gov/keep/foodkeeperapp/index.html). The six weeks of shelf life was selected because it is the level obtained by using a food preservation technology based on microwave pasteurization. The food preservation technology is applied to ready-to-eat-meals that should be kept in refrigeration. Figure 1 depicts an example scenario comparing the bundle of raw ingredients in option A to the ready-to-eat meal in option B. We also gave respondents a no-buy option. All combinations of scenarios follow a fractional factorial design.
We found that consumers need to receive a discount of $5.82 to buy products that have the highest expected food waste percentage (61%) compared to products with the lowest expected food waste percentage (29%). Even the products with an expected food waste percentage of 42% needed to be discounted by $2.38, on average, for the consumer to buy that product over one with less food waste. Our findings suggest that respondents were willing to pay a premium for reduced food waste and for a product with a few more days of shelf life. Respondents were willing to pay around $2.27 more for products that had a shelf life of 4 days compared to 2 days. However, we found that the shelf life of 6 weeks is insignificant. This could be due to respondents associating long shelf life with a lack of freshness and reduced quality.
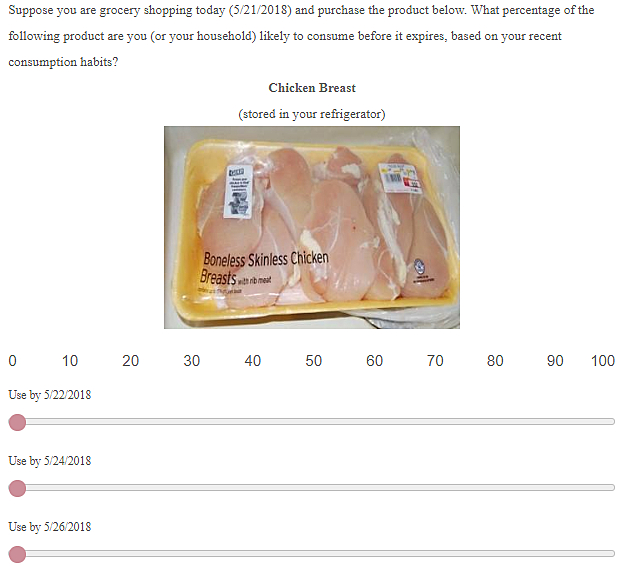
Our survey instrument included questions related to premeditated food waste. Similar to Wilson et al. (2017), we suggest a connection between food waste and shelf life. Date labels are a way for retailers to convey shelf life to consumers. However, date labels can be misleading and ambiguous (Newsome et al., 2014; Wansink and Wright, 2006; Wilson et al., 2017; WRAP, 2011). For example, one product may provide a “use by” date while another uses a “sell by” date. To prevent confusion, our survey calculates premeditated waste based on “use by” dates exclusively. Using the same ingredients as in the choice experiment section of the survey, we asked consumers what percentage of a given food product they would likely consume given various “use by” dates.
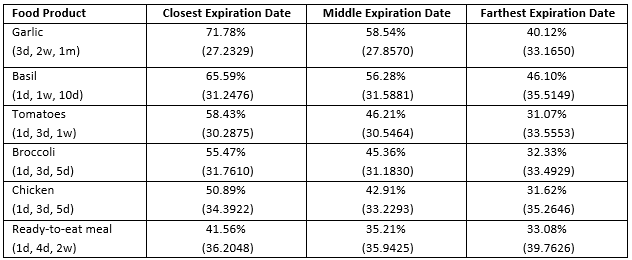
Note: Standard deviations are in parentheses.
Figure 2 shows an example where we use chicken breast as the product and three separate “use by” dates. Each product had an associated close, middle, and far date in terms of its expiration date relative to the day it was purchased. The close, middle, and far dates were selected based on each product’s expected shelf life. For example, for a more perishable item like chicken, the three dates were close together (1 day, 3 days, and 5 days after purchase), but for less perishable products like garlic the dates were further apart (3 days, 2 weeks, and 1 month after purchase). We asked respondents about six products: chicken breast, cherry tomatoes, garlic, basil, broccoli, and the ready-to-eat meal. The first five products correspond to the bundle of raw ingredients in the discrete choice experiment, and the premeditated waste for the ready-to-eat meal is included for consistency. Once we knew what percentage of the product a respondent would consume, we were able to ascertain how much they would waste by assuming that the unconsumed portion would be wasted.
Table 1 reports that products with “use by” dates closest to the purchase date had the highest premeditated waste across all the products. Chicken, with the closest expiration date, had one of the lowest premeditated waste of all the products presented, while garlic had the highest premeditated waste at the nearest expiration date. Our findings suggest that proteins such as chicken tend to have lower premeditated waste at the nearest expiration dates compared to products like basil and garlic. Another potential explanation is that there are often greater food safety concerns associated with chicken as opposed to a product like garlic. The amount consumers perceived wasting at the furthest expiration date was lower than the closer dates, suggesting that they would be less likely to waste it if there were more time before a product’s expiration date.
In estimating the average premeditated waste across each product for a particular date label (close, middle, far), we found that the average food-waste percentage for the furthest date is 36%. If we compare this with our lowest waste percentage in the choice experiment (29%), our survey respondents, on average, expect to waste 7 percentage points more at the furthest expiration date compared to percentages used in the choice experiment. Similarly, for the middle date, the average expected waste percentage was 47%, 5 percentage points higher than what was used in the choice experiment. Whereas, the average expected waste percentage for the closest date was 57%, 4 percentage points lower than what was used in the choice experiment. This information increases the reliability of our choice of 29%, 42%, and 61% levels for food waste used in the choice experiment portion.
Consumers are often confused about how to interpret date labels (Newsome et al., 2014; Wansink and Wright, 2006; Wilson et al., 2017; WRAP, 2011). Some freshness is lost over time, but it can take much longer for food to spoil and be unsafe to eat. Consumers may waste a lot of food if they confuse when a product is spoiled with when quality diminishes. Several food processing technologies exist commercially or are under development to help reduce food waste; one example is smart packaging with bio-sensors that change colors based on freshness or spoilage (Newsome et al., 2014). Making it easier for consumers to interpret food quality and safety will make it potentially easier for them to plan and reduce the amount they waste. While this packaging is more expensive, companies may be able to afford to invest in technologies conducive to reduce food waste if consumers are willing to pay a premium for lower-waste products.
From our findings on premeditated waste, we found that consumers would waste products like garlic and basil more when they are sold in larger quantities; grocery stores could therefore work to sell these products in smaller quantities. Retailers could also offer discounts on single-serving products as opposed to offering sizable discounts for buying in bulk. Single-person households tend to waste more food per person than bigger families (Schanes, Dobernig, and Gözet, 2018). As a potential solution, the government may be able to subsidize retailers for some single- or small-serving food items to make discounting single-serving products more worthwhile for retailers. Before implementing any of the suggested solutions, it is vital that companies perform detailed cost–benefit analyses to determine whether the extra effort to reduce food waste is worth the undertaking.
Another measure could consist of educating consumers on ways to reduce food waste. Institutions such as schools, hospitals, and retirement homes often generate much food waste as well. Comprehensive education programs could help younger generations develop habits that reduce overall food waste. One example of food-waste education is the “Love Food Hate Waste” campaign enacted by grocery stores in the United Kingdom, which has been quite successful at reducing food waste (Newsome et al., 2014). However, any education programs on the consumer side should be carefully crafted. To reduce food waste, we need to ensure that it also coincides with smaller portion sizes. Otherwise, if consumers take too much food on their plate and—to prevent waste—consume everything on their plate it could contribute to a different problem, obesity. Education on plate waste reduction would then have to also coincide with education on proper nutrition.
Along with education programs, the government could potentially tax food waste disposal (Katare et al., 2017). However, this is challenging due the government’s ability to monitor food disposal. The government could also subsidize companies that take strides to reduce food waste in their products. Likewise, they could provide awards or additional funding for institutions that meet certain food waste goals. Raising awareness and providing incentives may be a strategic way to reduce consumer-generated food waste.
Overall, consumers express concern with food waste and are willing to pay more for products with lower food waste and with longer shelf life. These findings hint at some potential benefits for grocery stores, food companies, and policy makers who take measures to reduce food waste. Some potential measures could include improved food packaging, increased awareness, and discounted food items with smaller portion sizes. However, before implementing such measures, it is essential that the costs associated with food waste reduction do not outweigh the benefits.
Bellemare, M., M. Çakir, H. Peterson, L. Novak, and J. Rudi. 2017. “On the Measurement of Food Waste.” American Journal of Agricultural Economics 99(5):1148–1158.
Buzby, J.C., H.F. Wells, and J. Hyman. 2014. The Estimated Amount, Value, and Calories of Postharvest Food Losses at the Retail and Consumer Levels in the United States. Washington, DC: U.S. Department of Agriculture, Economic Research Service, Economic Information Bulletin EIB-121, February.
Buzby, J. C., and Hyman, J. 2012. “Total and per Capita Value of Food Loss in the United States.” Food Policy 37:561–570.
Dixit, A.K., and J.E. Stiglitz. 1977. “Monopolistic Competition and Optimum Product Diversity." American Economic Review 67(3):297–308.
Food & Agriculture Organization of the United Nations (FAO). 2009. How to Feed the World in 2050. Rome: FAO.
———. 2013a. Food Wastage Footprint: Impacts of Natural Resources: Summary Report. Rome: FAO.
———.2013b. Reducing the Food Wastage Footprint: Toolkit. Rome: FAO. Available online: http://www.fao.org/3/a-i3342e.pdf.
Gustavsson, J., C. Cederberg, U. Sonesson, R. Van Otterdijk, and A. Meybeck. 2011. Global Food Losses and Food Waste. Rome: FAO.
Imperfect Produce. 2018. Available online: https://www.imperfectproduce.com/home.php.
Katare, B., D. Serebrennikov, H. Wang, and M. Wetzstein. 2017. “Social-Optimal Household Food Waste: Taxes and Government Incentives.” American Journal of Agricultural Economics 99(2):499–509.
Kummu, M., H. de Moel, M. Porkka, S. Siebert, O. Varis, and P.J. Ward. 2012. “Lost Food, Wasted Resources: Global Food Supply Chain Losses and Their Impacts on Freshwater, Cropland, and Fertiliser Use.” Science of the Total Environment 438: 477–489.
Newsome, R., C. Balestrini, M. Baum, J. Corby, W. Fisher, K. Goodburn, T.P. Labuza, G. Prince, H.S. Thesmar, and F. Yiannas. 2014. “Applications and Perceptions of Date Labeling of Food.” Comprehensive Reviews in Food Science and Food Safety 13(4):745–769.
Peterson, H. 2018, Jan.18. “‘Entire Aisles Are Empty’: Whole Foods Employees Reveal Why Stores Are Facing a Crisis of Food Shortages.” Business Insider. Available online: https://www.businessinsider.com/whole-foods-employees-reveal-why-stores-are-facing-a-crisis-of-food-shortages-2018-1
Roodhuyzen, D.M.A., P.A. Luning, V. Fogliano, and L.P.A. Steenbekkers. 2017. “Putting Together the Puzzle of Consumer Food Waste: Towards an Integral Perspective.” Trends in Food Science & Technology 68:37–50.
Schanes, K., K. Dobernig, and B. Gözet. 2018. “Food Waste Matters - A Systematic Review of Household Food Waste Practices and Their Policy Implications.” Journal of Cleaner Production 182:978–991.
Spence, M. 1976. “Product Selection, Fixed Costs and Monopolistic Competition.” Review of Economic Studies 43(2): 217-235.
Stefan, V., E. Van Herpen, A.A. Tudoran, and L. Lähteenmäki. 2013. “Avoiding Food Waste by Romanian Consumers: The Importance of Planning and Shopping Routines.” Food Quality and Preference 28:375–381.
Tang, J. 2015. “Unlocking Potentials of Microwaves for Food Safety and Quality.” Journal of Food Science 80:1776–1793.
U.S. Environmental Protection Agency (EPA). 2018a. Advancing Sustainable Materials Management 2015 Fact Sheet: Assessing Trends in Material Generation, Recycling, Composting, Combustion with Energy Recovery and Landfilling in the United States. Washington D.C., July. Available online: https://www.epa.gov/sites/production/files/2018-07/documents/2015_smm_msw_factsheet_07242018_fnl_508_002.pdf
———. 2018b. Basic Information about Landfill Gas. Available online: https://www.epa.gov/lmop/basic-information-about-landfill-gas
———. 2018c. Zero Waste Case Study: San Francisco. Available online: https://www.epa.gov/transforming-waste-tool/zero-waste-case-study-san-francisco
Wansink, B., and A.O. Wright. 2006. “‘Best If Used By…’ How Freshness Dating Influences Food Acceptance.” Journal of Food Science 71(4):S354–S357.
Wilson, N.L.W., B.J. Rickard, R. Saputo, and S.-T. Ho. 2017. “Food Waste: The Role of Date Labels, Package Size, and Product Category.” Food Quality and Preference 55(C):35–44.
Waste and Resources Action Programme (WRAP). 2011. Consumer Insight: Date Labels and Storage Guidance. May. Available online: http://www.wrap.org.uk/sites/files/wrap/Technical%20report%20dates.pdf

