For the last decade, growing attention has been focused on the “plight of the honey bees,” referring to concerns about honey bee colony health and abnormally high mortality rates. Far less attention has been paid to the “plight of the beekeepers,” who face the challenge of maintaining those struggling colonies. Honey bee colony health is often thought of as symbolic of the health of the natural environment, when in reality most honey bee colonies in the United States are managed as livestock by commercial beekeepers (Daberkow, Korb, and Hoff, 2009). Beekeepers all over the world have faced ever-increasing challenges with honey bee colony health, all while demand for honey bee pollination services has increased (Aizen and Harder, 2009).
In the United States, California almond production is the largest user of pollination services. This one-month pollination event beginning in mid-February has been called the “Super Bowl of beekeeping” (Lowe, 2018) and utilized an estimated 82% of the total U.S. population of honey bee colonies as of January 1, 2018 (USDA, 2018; CDFA and USDA, 2019). According to the U.S. Department of Agriculture (USDA), almond pollination revenues in 2016 made up roughly one-third of U.S. beekeeping income and is therefore one of the key influences on the economic sustainability of U.S. commercial beekeeping operations. Contractual arrangements determine the profitability of a beekeeper’s decision to partake in almond pollination. Specific contractual components for pollination services have been discussed anecdotally by prior research on pollination services (Cheung, 1973; Rucker, Thurman, and Burgett, 2012); until recently, the extent of contracting practices has remained unknown. This article discusses the results of a 2015 survey of almond growers, the first survey to outline basic components of pollination contracts. Many almond growers diversify their sources of pollination services using multiple beekeepers, often in addition to contracting through a pollination broker (Goodrich, 2017). Most almond pollination agreements include minimum requirements on the approximate number of bees in the colony (the colony’s strength). These requirements are included as a quality control to ensure adequate pollination, and almond growers are willing to pay higher fees per colony for those with higher strength guarantees (Goodrich, 2019); premiums for high-strength colonies range from 5.7% to 8.6% (Goodrich and Goodhue, 2016). Other important components of almond pollination agreements include those regarding pesticide use, colony thefts, late placement of colonies, and beekeeper access to colonies after placement (Goodrich, 2017).
Due to its scale and corresponding value of fees per colony, the California almond pollination market has become one of the most structured markets for pollination services in the world. If almond pollination fees continue to rise, formal contracting practices will likely increase due to increasing risk on both sides of the almond pollination agreement. Pollination services markets are developing and becoming more formal worldwide due to the increasing demand for managed pollination services. Beekeepers, growers, and brokers in these developing markets can utilize information and lessons learned from contracting practices in the California almond pollination market to ease the transition toward more formal transactions.
In 2018, there were over a million productive acres of almonds in California (CDFA and USDA, 2019). This acreage has more than doubled since 2000 (CDFA and USDA, 2001). Most almond varieties require cross-pollination, so to facilitate adequate pollination almond growers have traditionally used a rule of thumb of two honey bee colonies per acre of almonds. Consequently, the number of productive almond acres in 2018 required roughly 2 million colonies for adequate pollination.
The number of colonies required for almond pollination outnumbered the supply of colonies in California and the Pacific Northwest states by the late 1970s (Rucker, Thurman, and Burgett, 2012). Thus, the supply of colonies for California almond pollination relies heavily on out-of-state shipments, which steadily increased along with almond acreage. According to the California Department of Food and Agriculture (CDFA), colony shipments into California increased by 64% between 2008 and 2018. For the 2018 almond pollination season, 1.8 million colonies (of the 2.6 million the U.S. total on January 1, 2018) were shipped into California (USDA, 2018; CDFA, 2018).
A beekeeper must take into account many costs when deciding whether to contract for almond pollination services. Shipping costs alone can make up 25% of the almond pollination fee when coming from the eastern United States (Goodrich, Williams, and Goodhue, 2019). Additionally, in southern states such as Florida and Texas, there may be opportunities for honey production at the same time as almond bloom. Forgone honey revenue must be covered by the almond pollination fee. There are also costs to preparing colonies for the almond bloom, costs to bee health through the spread of pests and disease, potential pesticide exposure, and the stress of shipment (Agnew, 2007; Oliver, 2010; Krupke et al., 2012; Simone-Finstrom et al., 2016). A beekeeper must be reassured that all anticipated costs and forgone revenues will be covered by the almond pollination fee before she will agree to participate (see Cheung, 1973; Rucker, Thurman, and Burgett, 2012; Champetier, Sumner, and Wilen, 2015).
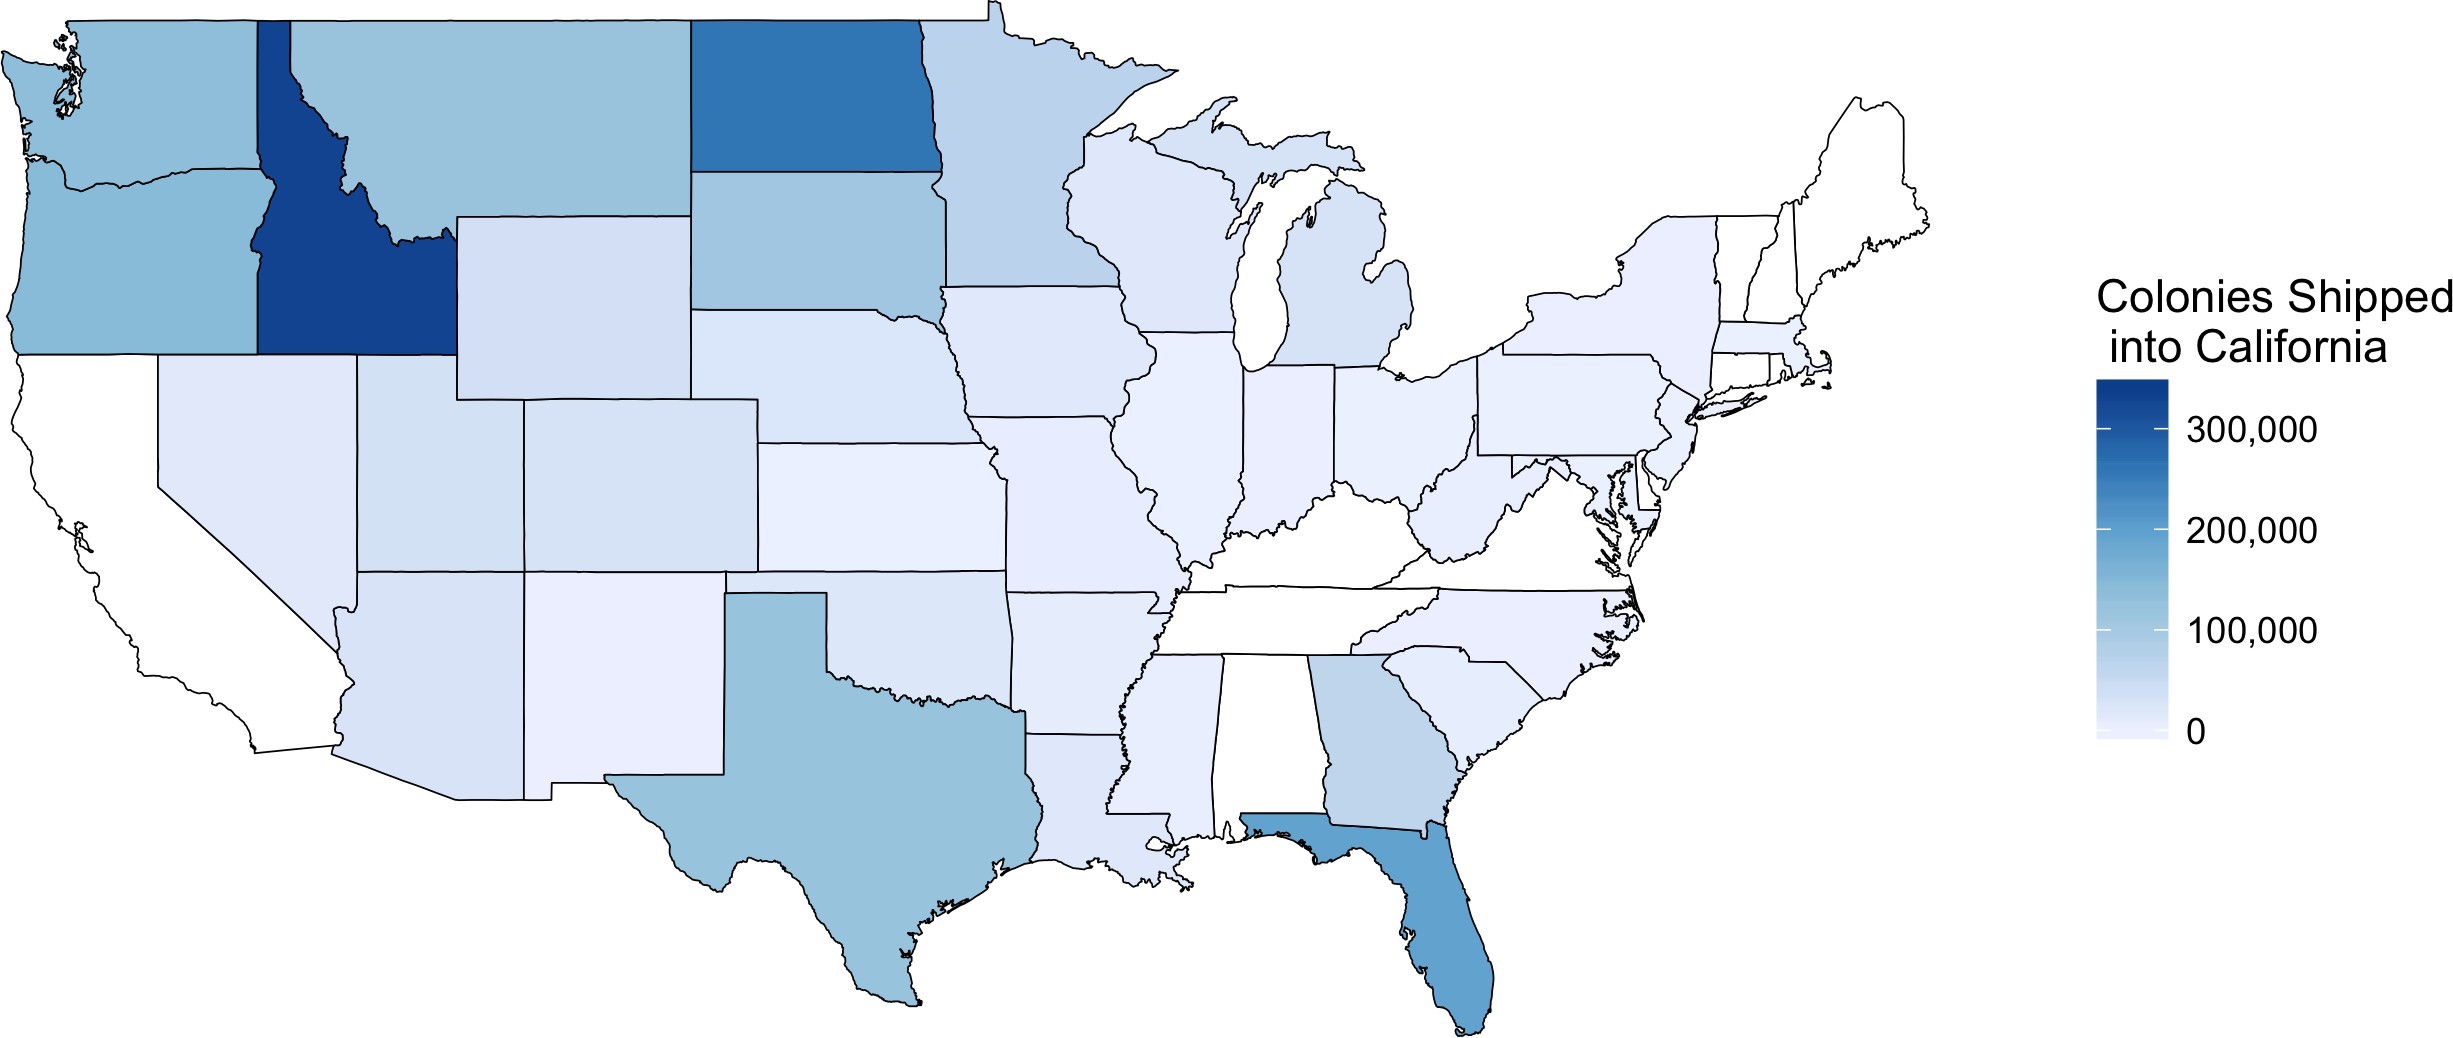
Source: Apiary Shipments through California Border Protection
Stations, CDFA Plant Health and Pest Prevention Services
(California Department of Food and Agriculture, 2018). Figure
originally published in Goodrich, Williams, and Goodhue (2019).
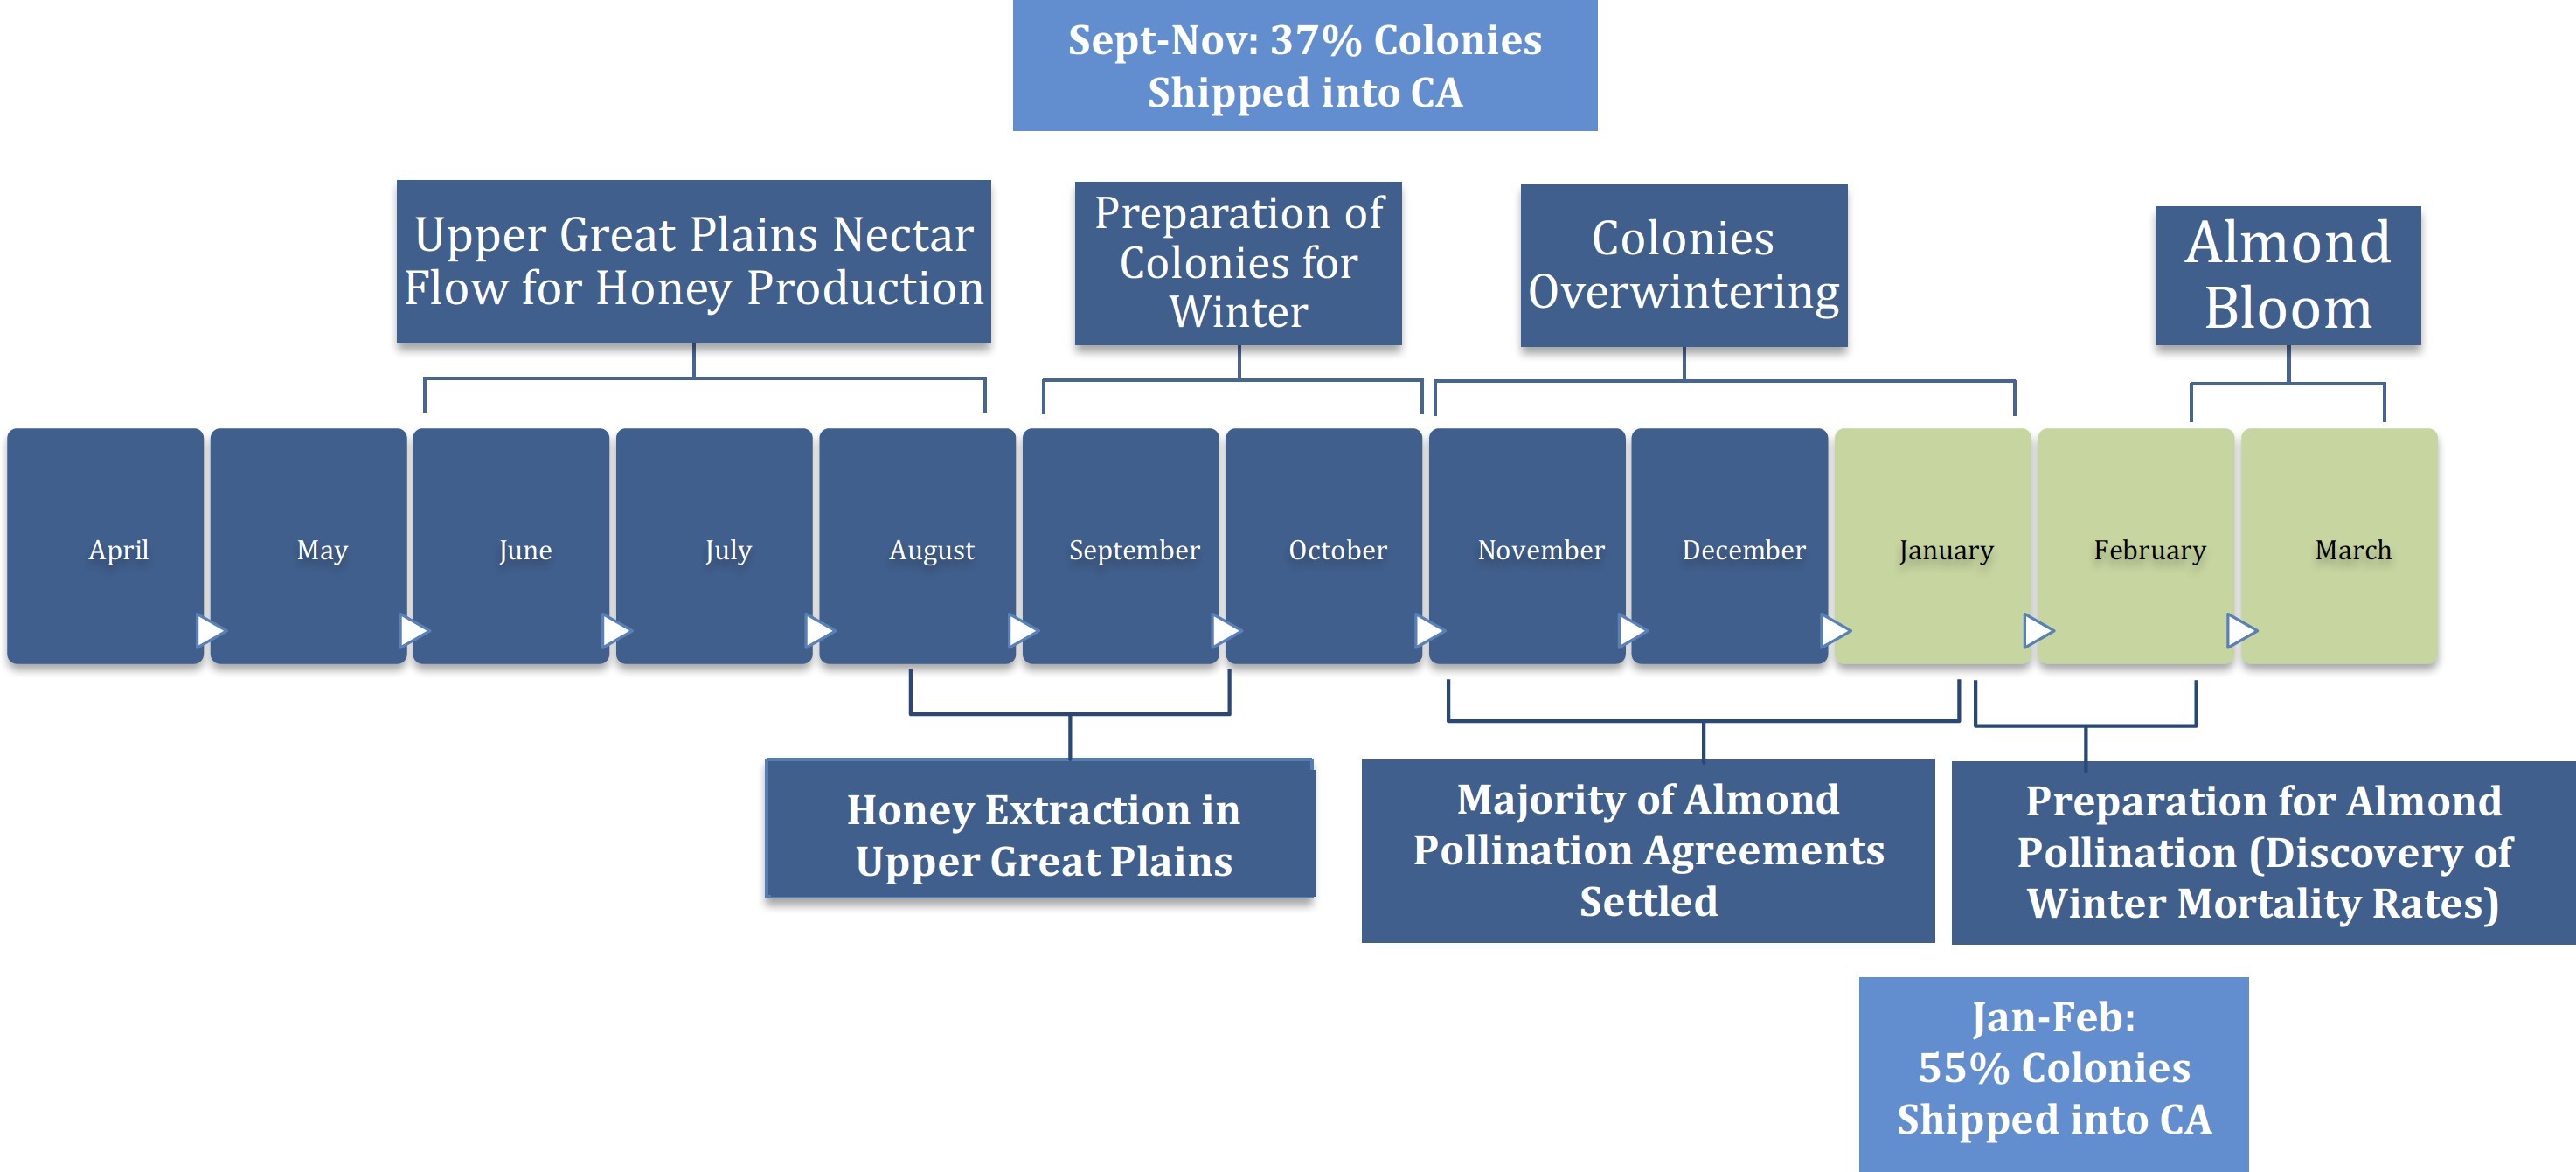
The figures below present a timeline and natural population
dynamics representative of a large portion of colonies contracted
for almond bloom (specific beekeepers’ practices may diverge
from this). Bond, Plattner, and Hunt (2014) estimate that well over
half of the commercial honey bee colonies in the United States
spend the summer producing honey in the Upper Great Plains
region (Minnesota, Montana, North Dakota, South Dakota).
During late fall, colder weather and shortening days trigger
colonies to shrink in size (Winston, 1992). This is because
blooming forage is scarce and temperatures are too low for bee
foraging to take place during winter across most of the United
States (Gary, 1992). Beekeepers prepare colonies for overwinter
dormancy by making management decisions in the fall, such as
the amount of honey to extract and pest treatments, to help
minimize losses over the winter months (Furgala and McCutcheon,
1992). After preparing for winter, most colonies are left untouched
in their dormant state until early spring, when forage becomes
available or colonies are prepared for almond pollination.
 Source: Adapted from Oliver (2006)
 The reliance on out-of-state shipments means that colony populations throughout the United States are a major influence on the supply of available colonies for almond pollination. Figure 1 shows a heat map of the number of colonies shipped into California for 2018 almond pollination from each state. The top five states shipping colonies into California were North Dakota, Idaho, Florida, Oregon, and Texas.
Box 1 presents a timeline of events important for almond pollination compared to the population dynamics of honey bee colonies. Industry participants indicate that many almond pollination agreements are settled well before almond bloom. Contracting in advance provides advantages for both beekeepers and growers; beekeepers can lock in a price that they expect will cover transportation and preparation costs, while almond growers guarantee they will receive colonies for adequate pollination. By locking in a price, beekeepers and growers risk missing out on advantageous price movements closer to bloom. However, the tendency for forward contracting in the industry suggests the benefits of forward contracting outweigh the potential costs.
The following section discusses the basics of almond pollination agreements interspersed with results from a 2015 survey of 114 almond growers conducted at the 2015 Almond Conference (Goodrich, 2017). This was the first survey to explore almond pollination agreements, so it provides baseline knowledge regarding pollination agreements and the extent to which contract components are used. The survey represents approximately 2% of almond operations in the industry.
Almond growers and beekeepers have many choices when it comes to their almond pollination agreements. One of the first is deciding whether to contract directly with the opposite party or to contract with a pollination broker, an intermediary who will facilitate the transaction. Brokers ensure that a grower gets adequate pollination services by guaranteeing a certain level of quality. Additionally, a broker contracts with many beekeepers, so if one comes up short due to high mortality rates, colonies from another beekeeper can usually be substituted easily. On the beekeeper side, brokers guarantee timely payments, so the broker takes on the risk of an almond grower not paying on time (or at all). Sometimes a broker (or beekeeper playing the role of broker) may even manage colonies in California while the beekeeper remains in their home state. Of course, these benefits come with a fee; brokers tend to charge the almond grower a higher fee than they pay the beekeeper and take the difference as payment for facilitating the transaction. Depending on the specific arrangement, brokerage fees can range from $2 to $20 per contracted colony.
In 2015, 53% of growers rented directly from a beekeeper, while 44% rented colonies directly from a beekeeper and also from an independent pollination broker; 3% of respondents rented colonies from an independent pollination broker only. The use of pollination brokers seems to be prevalent within almond pollination transactions: The Almond Board of California (2019) lists over 40 pollination brokers on their pollination directory.
Almond growers were also asked the number of beekeepers from which they received pollination services. While 44% of almond growers received colonies from only one source, 56% received colonies from two or more beekeepers. These findings suggest that many almond growers diversify their pollination sources. Another interesting finding was that of the respondents who contracted through a broker in 2015, 33% were unsure of the number of beekeepers utilized through that broker. This implies that the independent pollination broker incurs some of the logistical costs that a grower bears when contracting with a beekeeper directly.
Pollination brokers will typically have a formal written contract separately with each the beekeeper and almond grower. If an almond grower and beekeeper choose to contract directly, each must then decide whether they want to engage in a formal written agreement or a more informal, “handshake” agreement. From conversations with industry participants, it became clear that repeated handshake agreements are the norm in the market for almond pollination services, and oftentimes the suggestion of a written agreement can actually be seen as offensive, especially in long-term relationships. In economics, these repeated informal agreements are referred to as relational contracts, which can take the place of formal written contracts when the value of the relationship going forward exceeds the value of breaking the agreement in the current period (Levin, 2003).
| Agreement Form | Years Experience | Yield (lbs/acre) | Acreage |
| Written | 24 | 2,151 | 716 |
| Oral | 15 | 1,927 | 346 |
| Both | 23 | 2,282 | 1,694 |
Note: Using ANOVA methods, differences are statistically significant at the 10% level.
Almond growers reported whether they used written, oral (handshake), or both types of almond pollination agreements in 2015. Formal written and informal oral agreements were used to about the same extent; 43% of growers used pollination agreements in a formal written form, 42% of growers used pollination agreements that were informal oral agreements, and 12% of growers used a combination of written and oral agreements during 2015. Table 1 displays the relationships between the form of pollination agreement used and various respondent characteristics. Based on analysis of variance (ANOVA) methods, users of written agreements or combination of written and oral agreements had on average significantly more experience in almond production, higher yields, and more almond acreage than users of oral agreements.
The finding of similar formal and informal contract use was surprising giving the seemingly widespread use of relational contracts in the industry. Survey responses were likely biased toward relatively large operations (Goodrich, 2017). The disproportionate representation of contracts used by large operations likely overstates the formality of contracts used across all growers because large growers are more likely to use formal, written agreements. However, the representation of many large growers means the survey illustrates how a relatively large share of all colonies are contracted for almond pollination services.
Nearly 80% of almond growers worked with the same beekeeper (or broker) for at least four pollination seasons, and 29% had worked with the same beekeeper (or broker) for at least 11 pollination seasons. The preference for repeated working relationships is supported by growers’ stated preferences for selecting beekeepers each year. Nearly 80% stated that the prior contractual relationship with a beekeeper was the most important factor in selecting beekeepers each year. The second most common answer was that colony strength guarantees made by the beekeeper are the most important factor when selecting a beekeeper (11%). While another factor may be influential on their pollination provider decisions, many growers seemed to value repeated contractual relationships in almond pollination.
Growers find many benefits to working with the same pollination provider for multiple years. For example, time and effort savings occur because there is no need to search for a new pollination provider, and negotiating pollination contracts becomes easier due to the prior established agreement. In addition to these benefits, another factor—honey bee colony strength, or the approximate number of bees in a colony—is key in pollination transactions. Using the same pollination provider year after year can help a grower ensure access to reliable colonies for almond pollination each year. The following section discusses the role of colony strength in almond pollination contracts.
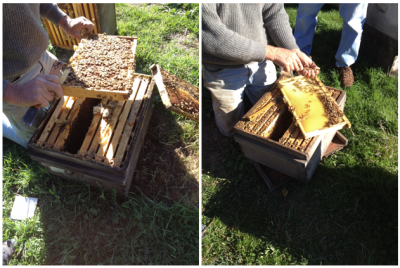
A hive is the physical container in which a honey bee colony
resides. A hive for almond pollination typically consists of two
stacked boxes, each filled with ten removable frames on
which bees construct comb to store honey and brood.
Honey bees’ tendency to cluster allows industry members
to visually inspect frames within a hive to estimate a
colony’s strength, or the number of bees in a colony. Colony
strength definitions can vary slightly (see Sagili and Burgett
(2011); Spivak (2011)), but a standard definition is that an
“active” frame meets one of two criteria: Bees cover at least
75% of both sides of a standard frame of comb, or there
are at least four bees per square inch of comb. The photos
shown below display examples of an active framecompared
with a nonactive frame of bees.
Growers can pay for a colony strength inspection by a
trained inspector. Growers who hired one of the largest
third-party inspection operations paid on average
$1.50–$2.00 per inspected hive in 2016,which corresponds
to roughly 1% of current pollination fees. The inspector
opens some (typically 10%–25%) of the hives provided to
an orchard and counts the number of active frames in
each hive. The number of active frames per hive is averaged
to estimate the beekeeper’s average colony strength for all
of the hives in that orchard.
(a) Active Frame |
(b) Not an Active Frame |
 |
|
Source: The Pollination Connection (2016); vanEngelsdorp
et al. (2011, 2012); Spleen et al. (2013); Steinhauer (2013);
Lee et al. (2015); Seitz et al. (2016); and Kulhanek et al.
(2017). Figure originally published in Goodrich (2019).
| Category | Average | Standard Deviation |
| High colony strength | $179.36 | 12.36 |
| Low colony strength | $169.66 | 14.71 |
| No colony strength | $165.22 | 15.22 |
Note: High colony strength: Contracts with minimum average
colony strength > 8 frames. Low colony strength: Contracts with
minimum average colony strength ≤ 8 frames. No colony strength:
Contracts with no colony strength requirement.
In almost any market for agricultural products, some measure of quality exists. Everything from feeder cattle to wine grapes has some sort of agreed-upon quality measures, many of which are regulated by the USDA Agricultural Marketing Service (e.g., USDA Prime Beef, USDA Grade AA Eggs, U.S. Extra Fancy Apples). The almond pollination industry is no different. The industry uses colony strength as an approximation of the quality of pollination services performed by a colony. The idea is that the more bees in the colony, the more pollination services it performs, ultimately resulting in more almonds. Box 2 outlines the industry definition of colony strength and the basics of a colony strength inspection.
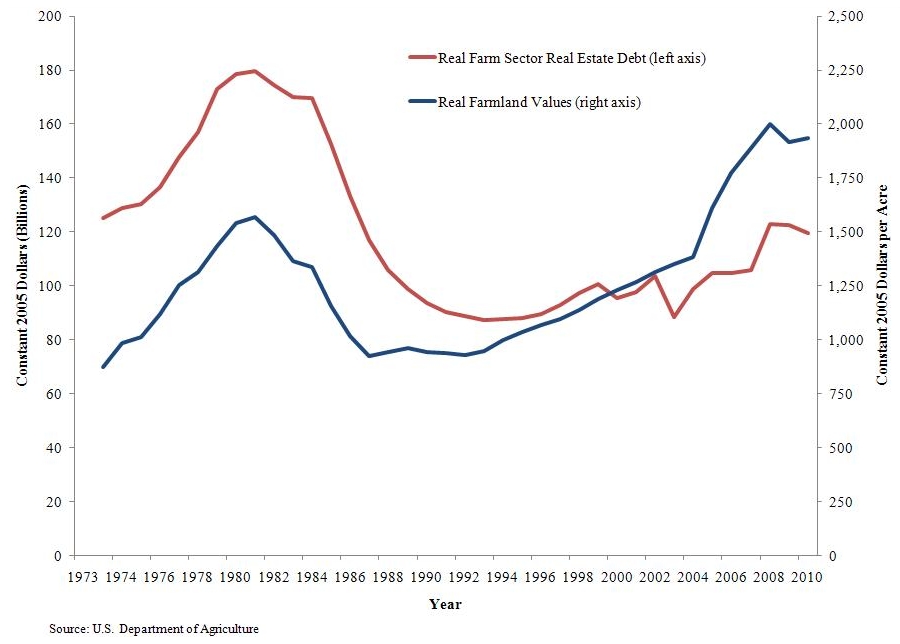
Higher colony strength can result in a higher value of almond production, especially in the weather that commonly occurs during bloom. Bees will not leave the hive to pollinate in temperatures below 55◦F or if it is raining or windy (Gary, 1992). Almond growers tend to pay higher fees for higher delivered colony strength to ensure proper pollination in suboptimal weather (Goodrich, 2017, 2019). Colony strength is crucial in almond pollination transactions because almonds bloom in mid-February, when colonies are naturally at their smallest size (see Box 1). Beekeepers must feed colonies supplemental food in early winter so that colonies will begin increasing in population before almonds begin to bloom (Furgala and McCutcheon, 1992; Winston, 1992). Over the winter, aging bees within the colony are under considerable stress and additional factors such as winter weather, pests, and diseases, can cause colonies to decrease in strength over this period and, in extreme cases, completely perish (Oliver, 2013). When a beekeeper’s winter mortality rate is high, it is likely that the surviving colonies are also stressed, so their populations would be low. As seen in Figure 2, U.S. average winter mortality rates are highly (negatively) correlated with average colony strength as reported by third-party inspections.
Almond pollination agreements can contain provisions specifying a minimum average level of colony strength across all colonies or a minimum colony strength for each individual colony as well as enforcement mechanisms, such as monetary penalties, that may be used in the case that colony strength requirements are not met. Approximately 78% of growers required a minimum average frame count in their pollination agreement, ranging from fewer than 5 to more than 10 active frames. (See Box 2 for active frame definition.) Nearly half of all growers indicated their minimum average frame count was eight active frames—the current industry standard—and 20% of growers said they offered a per frame bonus to incentivize beekeepers to provide high-strength colonies. For example, a per frame bonus contract would give a base pollination fee per colony for an eight-frame average and if the beekeeper provides colonies of more than an eight-frame average the beekeeper would receive a bonus per colony for the number of frames above the eight-frame average.
Because pollination markets have historically been small and therefore relatively informal, there is a lack of data in this sector. Even though there is a well-known correspondence between almond pollination fees and colony strength within the industry, the direct relationship is difficult to pin down by researchers and policy makers. Past research has explored this relationship, though more robust data is necessary to further explore the issue. Using the California State Beekeeper’s Association (CSBA) pollination fee survey for 2008–2016, Goodrich (2019) finds that this relationship holds true: For a beekeeper, a decrease in the delivered colony strength decreases the per colony almond pollination fee she collects. Additionally, Table 2 displays average fees reported by almond growers in the 2015 survey by colony strength category. At the 5% level, there is a statistically significant difference in mean pollination fees between colonies contracted with a minimum average frame count of more than eight frames and colonies contracted with a lower or no minimum average frame count (Goodrich and Goodhue, 2016). It is clear that respondents requiring minimum average frame counts higher than the industry standard pay a premium compared to others with lower colony strength requirements. On average respondents paid a 5.7% premium for colonies contracted at strengths above an eight-frame minimum average compared to colonies contracted at an eight-frame minimum average or below. Similarly, respondents paid an 8.6% premium on average for colonies contracted at strengths above the industry standard compared to colonies contracted with no colony strength requirement.
Cheung (1973) noted that the standard colony strength for colonies rented for almond pollination in 1973 was four active frames, while the current standard is eight active frames. Supporting this conclusion, University of California Co-operative Extension recommended that each hive should contain at least five active frames of bees in 1998 and recommended at least eight active frames per hive in 2016 (Hendricks et al., 1998; Duncan et al., 2016). This is important to consider when comparing almond pollination fees over time. Either gradually over the last four decades or within a shorter interval during that period, the standard colony strength for almond pollination has doubled, suggesting that—all else equal—pollination fees should also have increased given the findings of Goodrich (2019) and Goodrich and Goodhue (2016). Prior economic analyses have not captured this change over time and consequently have not been able to fully explain substantial per colony fee increases for almond pollination.
| Clause | Percentage |
| Pesticide application | 29.6 |
| Colony theft | 18.4 |
| Colony collapse disorder (CCD) | 7.1 |
| Late colony placement | 28.6 |
| Bloom percentages for approximate colony placement and removal dates | 23.5 |
| Beekeeper access after colony placement | 33.7 |
| Inspection specifics (inspecting party, time of day, etc.) | 25.5 |
| Unpaid balances | 14.3 |
| Minimum number of colonies per dropa | 23.5 |
| None of the above | 36.7 |
Note: a“Drop” refers to the number of colonies placed together within an orchard. Logistically,
it is easier for beekeepers to place many colonies next to one another rather than spreading
them out.
Additional clauses in pollination agreements other than colony strength requirements can outline conditions that may be beneficial during almond pollination for reducing risks or costs to growers, beekeepers and pollination brokers. The Almond Board of California (2018) highlights that in addition to the number and strength of colonies provided, the following should be included in the almond pollination agreement: dates for placement and removal of colonies, temperature and time of day of the colony strength inspection, payment terms, and the beekeeper’s access to colonies. The survey asked almond growers to select various other clauses that were included in their pollination agreements. Table 3 reports the percentage of respondents, with both written and oral agreements, who indicated that their agreement contained a specific clause. A “clause” is assumed to be included in an oral pollination agreement if the respondent and beekeeper had made arrangements for dealing with any of the issues listed prior to almond pollination. The three most common clauses used in respondents’ pollination agreements related to (i) beekeepers having access to colonies after initial colony placement in the almond orchard, (ii) pesticide application while colonies are in the almond orchard, and (iii) late colony placement. Over one-third of respondents did not have any of the listed contract clauses in their pollination agreements.
Clauses regarding the placement of colonies in orchards can be important on both sides of the agreement. Almond growers want colonies to be in the orchards shortly before or at the beginning of bloom to guarantee adequate pollination. Consequently, agreements may include penalties to deter late placement. Additionally, beekeepers want easy access to colonies in the orchards for regular maintenance and colony health checks.
Pesticide exposure poses a risk for any colony located on or near agricultural land, so beekeepers and almond growers may want to lay out specifics to mitigate some of this risk. For example, the contract may include statements regarding the time of day pesticides may be applied, which pesticides should be avoided, or what happens if colonies are harmed by pesticides applied by the grower. The Almond Board of California (2018) has outlined best management practices for when honey bees are in almonds in an effort to reduce the risk of pesticide exposure.
Colony thefts seem to be a growing issue for beekeepers, especially when colonies are in close proximity in remote almond orchards during bloom (Souza, 2019; Ebersole, 2019). Nearly 20% of respondents in 2015 had clauses related to colony theft in their almond pollination agreements. For example, a beekeeper may be willing to provide a discount on the pollination fee to locate colonies in an almond orchard that contains a locked gate. Due to increasing pollination fees, clauses regarding bee thefts may become common in almond agreements going forward.
Because the demand for almond pollination services continues to grow while already utilizing most U.S. colonies, many are concerned about where additional colonies will come from. Goodrich, Williams, and Goodhue (2019) find that beekeepers in the eastern United States have been more responsive to almond pollination fee increases than those in regions near California. Based on the number of colonies that are still available to participate in almond pollination, it is likely that Florida, Texas, Georgia, and Louisiana will provide additional colonies as almond acreage increases going forward (Goodrich, Williams, and Goodhue, 2019).
As the demand for almond pollination services creeps closer to the point of exceeding the total number of available U.S. colonies, it is unclear what market adjustments will take place to accommodate the additional demand. On the supply side, the number of colonies could increase if beekeepers are properly incentivized. So far, beekeeping operations have not expanded substantially, even in areas close to California almond orchards (Goodrich, Williams, and Goodhue, 2019). This is likely due to the lack of year-round forage on which to expand operations (Durant, 2019).
On the demand side, almond growers may start decreasing the number of colonies per acre of almonds in response to increasing pollination expenses, which are currently around 20% of annual operating costs (Duncan et al., 2016). One way to decrease the number of colonies per acre is for growers to plant self-fertile almond varieties that do not require cross pollination. Many almond growers with traditional varieties have stuck to using the rule of thumb of two colonies per acre, even though colony strength can be used as a substitute for the number of colonies per acre. Many in the industry hold the opinion that the rule of thumb has remained in use because federal crop insurance required two colonies per acre. Beginning in 2013, USDA Risk Management Agency changed the appraisal policy to incorporate colony strength into pollination requirements (U.S. Department of Agriculture, 2012). This change gives almond growers some flexibility. If per colony fees continue to rise, almond growers may begin to seriously consider renting fewer colonies per acre at a higher strength to cut down on pollination costs. If this takes place, it would likely place more emphasis on colony strength requirements in almond pollination agreements.
As the demand for colonies for almond pollination services continues to grow, risk likely increases on both sides of almond pollination agreements. Increased emphasis on colony strength requirements means that colony health issues become an even bigger risk for beekeepers in their almond pollination transactions. When a beekeeper’s winter mortality rate is high, revenue losses compound through a decreased quantity (fewer colonies to rent out for almond pollination) in addition to a decreased price (remaining colonies do not meet colony strength requirements). Goodrich (2019) finds that a 10% increase in winter mortality rates can decrease a commercial beekeeper’s revenue from almond pollination by 15%. Higher fees mean the beekeeper’s current value of breaking a long-term informal agreement may outweigh its value going forward, thus it may become more advantageous for growers to engage in formal contracts. It is well established in economics that contracts are often used to transfer risk (Hudson and Lusk, 2004; Gillespie and Eidman, 1998; Kliebenstein and Lawrence, 1995; Knoeber and Thurman, 1995; Goodhue, 2000); raising the stakes on both sides of almond pollination agreements therefore likely means a trend toward more formal contracts and away from relational contract use. Additionally, the finding that growers with more experience tend to use more formal agreements suggests that as the industry progresses and growers gain more experience, formal contracts may gain in popularity among growers.
This article discussed contracting practices in the largest market for pollination services in the United States: California almonds. Contracting decisions in the almond pollination market will grow more valuable for beekeepers and growers as the demand approaches the total number of available U.S. colonies. Similarly, global demand for managed honey bee pollination has been increasing faster than the population of colonies (Aizen and Harder, 2009), so these conclusions reach further than the United States. For example, Australia’s almond pollination industry is also growing and has struggled to get participation from beekeepers for pollination services (Le Feuvre, 2017). In the years to come, continued research on pollination services agreements will be helpful for beekeepers, growers, and others involved with developing pollination services markets all over the world.
Agnew, S. 2007. “The Almond and the Bee.” SFGate. Available online: http://www.sfgate.com/magazine/article/The-Almond-and-the-Bee-2518870.php.
Aizen, M.A., and L.D. Harder. 2009. “The Global Stock of Domesticated Honey Bees Is Growing Slower than Agricultural Demand for Pollination.” Current Biology 19: 915–918.
Almond Board of California. 2018. Honey Bee Best Management Practices for California Almonds: A Guide for Pollination Stakeholders. Available online: http://www.almonds.com/BeeBMPs.
———. 2019. Almond Pollination Directory. Available online: https://www.almonds.com/pollination.
Bond, J., K. Plattner, and K. Hunt. 2014. Fruit and Tree Nuts Outlook: Economic Insight. U.S. Pollination-Services Market. Washington. DC: U.S. Department of Agriculture, Economic Research Service, Situation and Outlook FTS-357SA.
California Department of Food and Agriculture. 2018. “California Border Protection Stations Apiary Shipments.” Unpublished.
California Department of Food and Agriculture and U.S. Department of Agriculture. 2001. 2000 California Almond Acreage Report. Sacramento, CA: California Department of Food and Agriculture cooperating with the U.S. Department of Agriculture National Agricultural Statistics Service.
———. 2019. 2018 California Almond Acreage Report. Sacramento, CA: California Department of Food and Agriculture Cooperating with the U.S. Department of Agriculture National Agricultural Statistics Service.
Champetier, A., H. Lee, and D.A. Sumner. 2019. “Are the Almond and Beekeeping Industries Gaining Independence?” Choices, forthcoming.
Champetier, A., D.A. Sumner, and J.E. Wilen. 2015. “The Bioeconomics of Honey Bees and Pollination.” Environmental and Resource Economics 60: 143–164.
Cheung, S.N. 1973. “The Fable of the Bees: An Economic Investigation.” Journal of Law and Economics 16: 11–33.
Daberkow, S., P. Korb, and F. Hoff. 2009. “Structure of the US Beekeeping Industry: 1982– 2002.” Journal of Economic Entomology 102: 868–886.
Duncan, R., B. Holtz, D. Doll, K. Klonsky, D.A. Sumner, C.A. Gutierrez, and D. Stewart. 2016. Sample Costs to Establish an Orchard and Sample Costs to Establish an Orchard and Produce Almonds: San Joaquin Valley North Micro-Sprinkler Irrigation. Davis, CA: University of California Cooperative Extension.
Durant, J.L. 2019. “Where Have All the Flowers Gone? Honey Bee Declines and Exclusions from Floral Resources.” Journal of Rural Studies 65: 161–171.
Ebersole, R. 2019. “Beekeepers Hit Hard by Thefts of Hives.” National Geographic. Available online: https://www.nationalgeographic.com/animals/2019/05/bee-thieves-cost-beekeepers-thousands/.
Furgala, B., and D. McCutcheon. 1992. “Wintering Productive Colonies.” In J.M. Graham, ed. The Hive and the Honey Bee. Hamilton, IL: Dadant and Sons, pp. 829–925.
Gary, N.E. 1992. “Activities and Behavior of Honey Bees.” In J.M. Graham, ed. The Hive and the Honey Bee. Hamilton, IL: Dadant and Sons.
Gillespie, J.M., and V.R. Eidman. 1998. “The Effect of Risk and Autonomy on Independent Hog Producers’ Contracting Decisions.” Journal of Agricultural and Applied Economics 30: 175–188.
Goodhue, R.E. 2000. “Broiler Production Contracts as a Multi-Agent Problem: Common Risk, Incentives and Heterogeneity.” American Journal of Agricultural Economics 82: 606–622.
Goodrich, B.K. 2017. The California Almond Pollination Market: Contracts and Honey Bee Colony Health. Davis, CA: University of California, Davis.
———. 2019. “Do More Bees Imply Higher Fees? Honey Bee Colony Strength as a Determinant of Almond Pollination Fees.” Food Policy 83: 150–160.
Goodrich, B., and R.E. Goodhue. 2016. “Honey Bee Colony Strength in the California Almond Pollination Market.” ARE Update 19: 5–8.
Goodrich, B.K., J.C. Williams, and R.E. Goodhue. 2019. “The Great Bee Migration: Supply Analysis of Honey Bee Colony Shipments into California for Almond Pollination Services.” American Journal of Agricultural Economics 101: 1353–1372.
Hendricks, L., R. Duncan, P. Verdegaal, K. Klonsky, and P. Livingston. 1998. Sample Costs to Establish an Almond Orchard and Produce Almonds: San Joaquin Valley North Microsprinkler Irrigation. Davis, CA: University of California Cooperative Extension.
Hudson, D., and J. Lusk. 2004. “Risk and Transactions Cost in Contracting: Results from a Choice-Based Experiment.” Journal of Agricultural & Food Industrial Organization 2: 1–19.
Kliebenstein, J.B., and J.D. Lawrence. 1995. “Contracting and Vertical Coordination in the United States Pork Industry.” American Journal of Agricultural Economics 77: 1213–1218.
Knoeber, C.R., and W.N. Thurman. 1995. “‘Don’t Count Your Chickens...’: Risk and Risk Shifting in the Broiler Industry.” American Journal of Agricultural Economics 77: 486–496.
Krupke, C.H., G.J. Hunt, B.D. Eitzer, G. Andino, and K. Given. 2012. “Multiple Routes of Pesticide Exposure for Honey Bees Living Near Agricultural Fields.” PLoS One 7: e29268.
Kulhanek, K., N. Steinhauer, K. Rennich, D.M. Caron, R.R. Sagili, J.S. Pettis, J.D. Ellis, M.E. Wilson, J.T. Wilkes, D.R. Tarpy, R. Rose, K. Lee, J. Rangel, and D. vanEngelsdorp. 2017. “A National Survey of Managed Honey Bee 2015–2016 Annual Colony Losses in the USA.” Journal of Apicultural Research 56(4): 328–340.
Lee, K.V., N. Steinhauer, K. Rennich, M.E. Wilson, D.R. Tarpy, D.M. Caron, R. Rose, K.S. Delaplane K. Baylis, E.J. Lengerich, J. Pettis, J.A. Skinner, J.T. Wilkes, R. Sangili, and D. vanEngelsdorp. 2015. “A National Survey of Managed Honey Bee 2013–2014 Annual Colony Losses in the USA.” Apidologie 46(3): 292–305.
Le Feuvre, D. 2017. “Honeybee Pollination Services for the Australian Almond Industry.” Australasian Agribusiness Perspectives 20:194–205.
Levin, J. 2003. “Relational Incentive Contracts.” American Economic Review 93: 835–857.
Lowe, J. 2018. “The Super Bowl of Beekeeping.” New York Times. Available online: https://www.nytimes.com/2018/08/15/magazine/the-super-bowl-of-beekeeping.html.
Oliver, R. 2006. “IPM 3 Fighting Varroa 3: Strategy – Understanding Varroa Population Dynamics.” Scientific Beekeeping. Available online: http://scientificbeekeeping.com/ipm-3-strategy-understanding-varroa-population-dynamics/
———. 2010. “Sick Bees. Part 1.” American Bee Journal 150. Available online: http://scientificbeekeeping.com/sick-bees-part-1/
———. 2013. “Winter Colony Losses.” American Bee Journal 153: 961–965.
The Pollination Connection. 2016. Colony Strength Inspection Data. Unpublished.
Rucker, R.R., W.N. Thurman, and M. Burgett. 2012. “Honey Bee Pollination Markets and the Internalization of Reciprocal Benefits.” American Journal of Agricultural Economics 94: 956–977.
———. 2019. “Honey Bees: Mortality, Markets, and the Food Supply.” Choices, forthcoming.
Sagili, R., and D. Burgett. 2011. “Evaluating Honey Bee Colonies for Pollination.” Pacific Northwest Extension Publications 623: 1–8.
Seitz, N., K.S. Traynor, N. Steinhauer, K. Rennich, M.E. Wilson, J.D. Ellis, R. Rose, D.R. Tarpy, R.R. Sagili, D.M. Caron, K.S. Delaplane, J. Rangel, K. Lee, K. Baylis, J.T. Wilkes J.A. Skinner, J.S. Pettis, and D. vanEngelsdorp. 2016. “A National Survey of Managed Honey Bee 2014–2015 Annual Colony Losses in the USA.” Journal of Apicultural Research 54(4): 292–304.
Simone-Finstrom, M., H. Li-Byarlay, M.H. Huang, M.K. Strand, O. Rueppell, and D.R. Tarpy. 2016. “Migratory Management and Environmental Conditions Affect Lifespan and Oxidative Stress in Honey Bees.” Scientific Reports 6: 320–323.
Souza, C. 2019. “BeeWhere Program Aims to Protect Hives.” AgAlert. Available online: http://www.agalert.com/story/?id=12450.
Spivak, M. 2011. “Pollination Contracts and Evaluating Honey Bee Colony Strength.” Available online: https://fruit.wisc.edu/wp-content/uploads/sites/36/2011/05/Pollination-contracts-and-evaluating-honey-bee-colony-strength.pdf.
Spleen, A.M., E.J. Lengerich, K. Rennich, D. Caron, R. Rose, J.S. Pettis, M. Henson, J.T. Wilkes, M. Wilson, J. Stitzinger, K. Lee, M. Andree, R. Snyder, and D. vanEngelsdorp. 2013. “A National Survey of Managed Honey Bee 2011–12 Winter Colony Losses in the United States: Results from the Bee Informed Partnership.” Journal of Apicultural Research 52(2): 44–53.
Steinhauer, N.A., K. Rennich, M.E. Wilson, D.M. Caron, E.J. Lengerich, J.S. Pettis, R. Rose, J.A. Skinner, D.R. Tarpy, J.T. Wilkes, and D. vanEngelsdorp. 2013. “A National Survey of Managed Honey Bee 2012–2013 Annual Colony Losses in the USA: Results from the Bee Informed Partnership.” Journal of Apicultural Research 53(1): 1–18.
U.S. Department of Agriculture. 2012. Almond Loss Adjustment Standards Handbook 2013 and Succeeding Crop Years. Washington, DC: U.S. Department of Agriculture Federal Crop Insurance Corporation and Risk Management Agency, FCIC25020-3.
U.S. Department of Agriculture. 2018. Honey Bee Colonies. Washington, DC: U.S. Department of Agriculture, National Agricultural Statistics Service, August.
vanEngelsdorp, D., D. Caron, J. Hayes, R. Underwood, K. R. M. Henson, A. Spleen, M. Andree, R. Snyder, K. Lee, K. Roccasecca, M. Wilson, J. Wilkes, E. Lengerich, and J. Pettis. 2012. “A National Survey of Managed Honey Bee 2010-11 Winter Colony Losses in the USA: Results from the Bee Informed Partnership.” Journal of Apicultural Research 51: 115–124.
vanEngelsdorp, D., J. Hayes Jr, R.M. Underwood, D. Caron, and J.S. Pettis. 2011 “A Survey of Honey Bee Colony Losses in the United States, Fall 2009 to Spring 2010.” Journal of Apicultural Research 50: 1–10.
Winston, M. 1992. “The Honey Bee Colony: Life History.” In J.M. Graham, ed. The Hive and the Honey Bee. Hamilton, IL: Dadant and Sons, pp. 73–101.

