For the first time since the series began in 1980, the Dietary Guidelines for America 2010 (DGA 2010) call for coordinated efforts from all sectors to improve the U.S. food environment to promote healthful choices that could lead to a decrease in rates of obesity and overweight. This article discusses the rise in numbers of overweight and obese people in the United States and reasons for concern about the increase in average body weight. It presents an overview of scientific literature on the likely causes for the rapid increase in obesity in the past 30 years. Finally, it examines the possible steps that could make the DGA 2010 more effective at managing the national waistline.
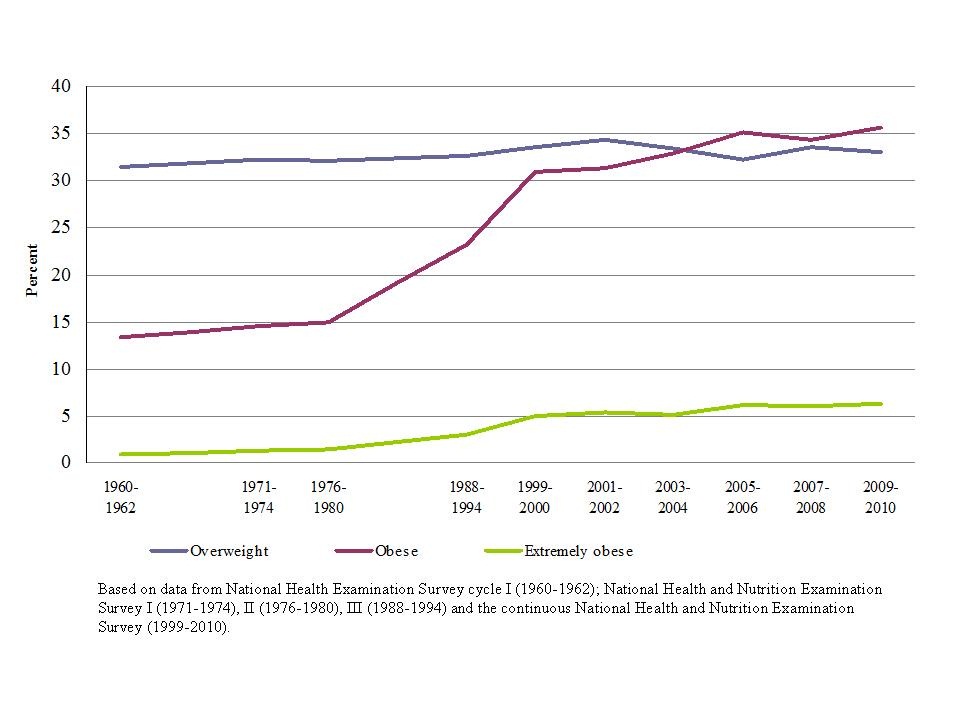
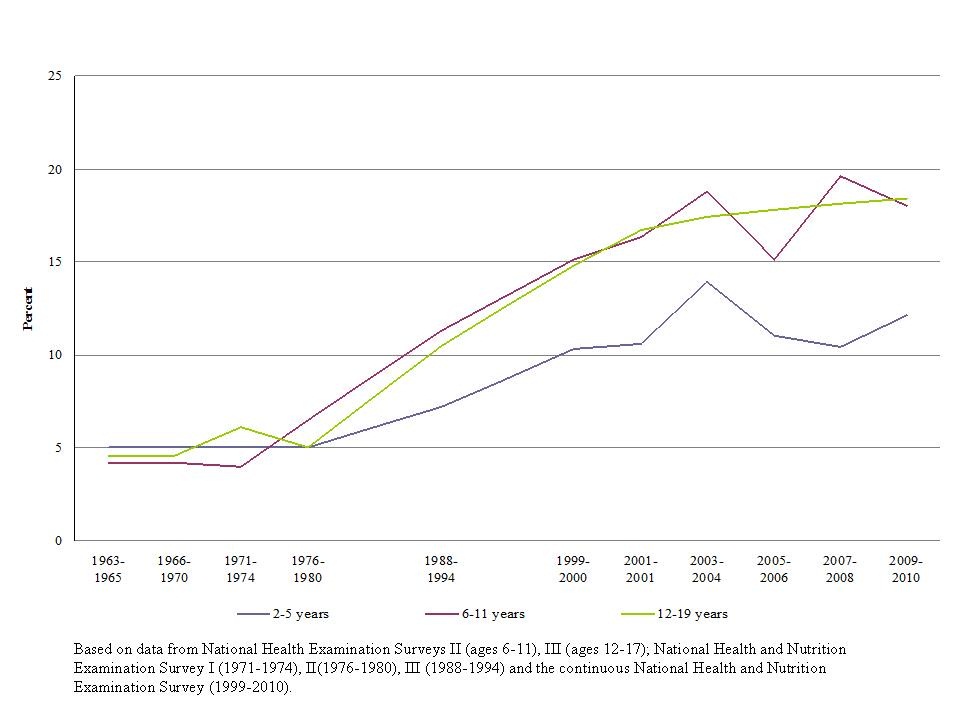
Although early versions of the guidelines directly targeted consumers, since 2005 the guidelines have been a policy document, intended for policymakers to use to design and carry out nutrition-related programs and for nutrition educators and health professionals who directly interact with consumers. The increased focus on overweight and obesity in the DGA 2010 comes as a response to dramatic increases in rates of obesity in the United States over the past decades. The popular media abound with stories about the "obesity epidemic," and it is broadly understood that Americans have grown fatter. Figure 1 shows U.S. adult overweight and obesity rates from the 1960s to the present. Figure 2 shows obesity rates for children and adolescents. Obesity rates for all three age groups remained relatively stable until the late 1970s, but increased sharply after that time. Currently, two out of three adult Americans are overweight or obese (Flegal et al., 2012). For children, since the 1970s, the prevalence of obesity has tripled, rising from around 5% to almost 17% (Ogden et al., 2012).
Obesity, especially at higher levels, is linked to premature death (Flegal et al., 2005; Engeland et al., 2004). It is linked to cardiovascular disease, type 2 diabetes, fatty liver disease, gallstones, breathing and joint problems, gastro-esophageal reflux, and poor mental health (NIH, 1998; Strine et al., 2008). Total national healthcare costs from obesity were recently estimated at $147 billion, with the costs paid by third-party payers, including Medicare, over $1,400 higher per year for people who are obese (Finkelstein et al., 2009). Indirect costs from income lost due to health conditions and the opportunity cost of future earnings are also part of the economic toll of obesity (Wolf and Colditz, 1998; Wellman and Friedberg, 2002). Adding to the economic burden of obesity, adults, especially white women, may face discrimination in the job market because of their weight (Cawley, 2004; Puhl and Brownell, 2001). Hence, concern over the national obesity rates, discussed at length in the DGA 2010, appears well justified from both medical and economic perspectives.
To classify people as overweight or obese, body mass index (BMI) is the most common measure. For adults, BMI is calculated using weight in relation to height, specifically the adult’s weight in kilograms divided by the square of his or her height in meters. BMI does not measure body fat directly, but for most people, BMI is closely related to percentage body fat. BMI does not accurately assess body fat for pregnant women, athletes with significant muscle mass, or adults over age 65. For children and adolescents (aged 2-19 years), a different category of BMI is used because their composition of body fat varies as they age and varies between boys and girls. A child’s weight status is determined using an age and sex specific percentile.
Source: DGA 2010 (USDA and USDHHS, 2010)
| Weight Category | Adults (BMI) | Children and Adolescents, ages 2-19 (BMI for Age Percentile Range) |
|---|---|---|
| Underweight | < 18.5 | < the 5th percentile |
| Healthy Weight | 18.5 to 24.9 | 5th percentile to the < 85th percentile |
| Overweight | 25.0 to 29.9 | 85th percentile to < the 95th percentile |
| Obese | > 30.0 | > the 95th percentile |
It seems clear, given the rapid rise in obesity rates, that Americans have not followed recommendations of maintaining a healthy weight, which have been included in the DGA since the series began. A related question involves how well we have complied with the recommendations targeting diet quality, which have also been highly consistent through the years. The Healthy Eating Index, or HEI, measures the quality of Americans' diets relative to the DGA. The current version, HEI-2005, has 12 components: total fruit; whole fruit; total vegetables; dark green and orange vegetables; total grains; whole grains; milk products and soy beverages; meat and beans; oils; saturated fat; sodium; and calories from solid fats, alcoholic beverages, and added sugars (SoFAAS) (Guenther, Reedy, and Krebs-Smith, 2008). Index values can range from 0 to 100, with higher scores associated with a higher-quality diet.
Researchers evaluated the diet quality of lower- and higher-income Americans, ages two and older, using dietary data from the 2003-04 rounds of a national survey (USDA, CNPP, 2008). The average score, across all income levels, was 57.5 out of the possible 100 points. Respondents did especially poorly on dark green and orange vegetables, whole grains, sodium, and calories from SoFAAS. Surprisingly, total HEI-2005 scores were about the same for lower- and higher-income respondents. There were, however, differences in the ways in which low- and high-income respondents failed to meet the targets. (See the article by Palma and Jetter elsewhere in this issue for details on the differences across income groups.)
The DGA series has included explicit recommendations on physical activity levels since 2000. The DGA 2010 physical activity recommendations are based on the “Physical Activity Guidelines for Americans,” released in 2008 by the U.S. Department of Health and Human Services. For adults, the DGA 2010 encourages a minimum of 150 minutes per week of moderate-intensity aerobic activity or 75 minutes of high-intensity aerobic activity. For children six and older, an hour a day of physical activity is recommended. Many Americans fail to meet these targets. According to the Healthy People website, more than 80% of adults and adolescents do not meet the guidelines for both aerobic and muscle-strengthening activities (USDHHS, Healthy People 2020, 2012a).
Evidence indicates that most Americans have not followed recommendations in previous editions of the DGA in terms of maintaining a healthy weight, eating a high quality diet, and getting sufficient exercise. Given the costs to our society of obesity, poor diet quality, and lack of exercise, an important question is what can be done to make the 2010 DGA more effective in altering people's behaviors to reduce their risk of obesity? To answer that question, it is first important to understand the factors believed to be associated with rising rates of obesity.
The DGA 2010 calls our current environment "obesogenic," meaning that it promotes over-consumption of energy and discourages physical activity. With such striking changes in rates of obesity since the 1970s, significant changes affecting food intake or energy expenditure must have occurred in a short span of time. From a physiological standpoint, the cause of obesity is well understood: An individual incurs a persistent energy imbalance, consuming more energy through food and drink than is expended by physical activities. The excess energy is stored as body fat. However, the complex economic causes and consequences of obesity are yet to be understood (Finkelstein et al., 2005). No paper of this size can do much justice to the extensive range of investigations that have been made by economists, nutrition and health researchers, and other scientists concerning the factors that may be linked to rising obesity rates; however, some of the major theories and findings are briefly discussed here.
Evidence concerning changes in activity levels over time is mixed, with some studies (Church et al., 2011; Lakdawalla and Philipson, 2002) suggesting a decrease, while others finding no significant changes since the mid-1970s that would account for the surge in obesity rates (Westerterp and Speakman, 2008). There is, however, very strong evidence that average daily energy intake, in the form of kcal—or "calories"—has increased substantially since the 1970s, although estimates of the magnitude of the increase have varied from around 200 calories per day (Leonard, 2010) to over 550 calories per day (Duffey and Popkin, 2011). The increased energy intake has been attributed to changes in dietary patterns, such as an increase in consumption of high-calorie and low-nutrition snacks including sugary beverages, larger portion sizes, and more food consumed away from home (Popkin, Duffey, and Gordon-Larsen, 2005; Duffey and Popkin, 2011; Zizza, Siega-Riz, and Popkin, 2001).
One of the first rules of economics is that price matters. As a percentage of income, food, especially highly caloric food, has become cheaper. But while food prices overall have declined since the 1970s, fruit and vegetable prices have increased (Christian and Rashad, 2009). The low relative cost of "energy-dense" foods has been hypothesized to be a factor in obesity (Drewnowski, 2004). The difference in relative prices for different types of food may also explain some of the differences in rates of obesity found among different economic groups (Drewnowski and Specter, 2004). The time-cost of food has also fallen. For most Americans, food is now readily available and highly convenient (Cutler, Glaeser, and Shapiro, 2003).
The "built environment," or the human-made environment that provides the setting for our day-to-day activities, has been extensively studied in terms of dietary intake and physical activity (Papas et al., 2007). Long commutes; highways without crosswalks, sidewalks or bicycle lanes; and high speed limits on crowded roads discourage pedestrian traffic and bicycle-riding. Additionally, we have more access to prepared food. According to the DGA 2010, the number of fast-food restaurants in the United States has doubled since the 1970s, and people of all ages who eat out regularly, particularly at fast-food restaurants, increase their risk for overweight or obesity (USDA and USDHHS, 2010, page 11).
A study from the Economic Research Service of the U.S. Department of Agriculture (USDA) shows that foods eaten away from home are more energy-dense than foods prepared at home (Guthrie, Lin, and Frazao, 2002), and some economists have linked higher restaurant availability to higher obesity rates (Chou, Grossman, and Saffer,2004). However, other research has found that while there is a link between food eaten away from home and obesity, the effect is small (Cai et al., 2008). For fast-food restaurants, the effect may be concentrated on females and minorities living in medium-density population areas, rather than broadly affecting the population (Dunn, 2010). Absence of full-service grocery stores, especially in areas with high rates of poverty, has also been posited as a problem that contributes to poor nutrition and health, but the current state of research on the issue of "food deserts" may not be sufficient for economists to draw conclusions about the impact of this possible problem (Bitler and Haider, 2010).
The effect of portion sizes on food consumption has been studied, and experiments have shown that people will consume more total calories when the amount served to them increases (Rolls, Morris, and Roe, 2002; Orlet Fisher, Rolls, and Birch, 2003). Portion sizes in the United States began to increase in the 1970s and then rose sharply in the 1980s. In fast food restaurants, portions of French fries, hamburgers, and soda are now two to five times larger than when first introduced to consumers (Young and Nestle, 2002). In many U.S. fast-food restaurants, the dramatic increase in portion size has led to situations where consumers can take in almost a day's worth of energy and more than the recommended daily amount of sodium with one low-cost, fast-food meal, a fact that can be easily verified by checking the online nutritional information provided by the restaurant chains. The increase in portion size is not limited to restaurants. Portions at home have also increased (Nielsen and Popkin, 2003).
While the food environment in America can be characterized as one in which a wide variety of convenient food is readily available for consumption, a substantial percentage of the population also faces a condition known as "food insecurity," meaning such people have limited or uncertain abilities to acquire sufficient, nutritionally adequate, and safe foods in socially acceptable ways (Andersen, 1990). In 2010, 14.5 percent of U.S. households were food insecure at least some time during that year, with a little over a third of that number experiencing more severe forms of food insecurity (Coleman-Jensen et al., 2011). Food insecurity is highly related to poverty, but not all poor households are food insecure. Food insecurity is linked to a variety of health problems and also to obesity, although not all researchers have found that food insecurity, independent of poverty, is linked to poor health. (See Gundersen, Kreider, and Pepper, 2011, for a thorough review of the literature on food insecurity.)
Federal nutrition programs, which are designed to alleviate food insecurity and improve dietary choices, have also been implicated by some people in the rise of obesity among the poor. Some research links the Supplemental Nutrition Assistance Program (SNAP, formerly called "food stamps") to higher rates of obesity (Gibson, 2003) and the increased consumption of added sugars and fats (Wilde, McNamara, and Ranney 2009). Other research, however, indicates that the effect of food stamps on obesity rates is small (Baum, 2011; Fan, 2010) and, at least for children, the impact on obesity rates may occur primarily in areas with high food costs (Kimbro and Rigby, 2010). Further, researchers have found that other forms of federal food aid that subsidize children's meals at schools or daycare centers may be protective against childhood obesity (Kimbro and Rigby, 2010).
The relative prices of fruits and vegetables compared to foods high in added fats and sugars, the quest for convenience, and an environment saturated with high-fat, high-sugar snacks and drinks may have more consequences than over-consumption of energy. Poor diets lead to increased risk of chronic diseases, such as type 2 diabetes, hypertension, and certain cancers, as well as micronutrient deficiencies (CDC, 2012). Lack of exercise is similarly linked to heightened risk for diseases, apart from its effect on body weight.
The consensus is clear that the current rates of obesity and overweight, with the contributory problems of poor diet quality and lack of exercise, are linked to a number of medical, social, and financial problems. There is less agreement on what, if anything, should be done about America's waistline. The DGA 2010 provides advice for individuals, such as focusing on the total number of calories consumed; monitoring food intake; choosing smaller portions or lower-calorie options when dining out; preparing, serving, and consuming smaller portions at home; eating a nutrient-dense breakfast; getting sufficient exercise; and limiting screen time. Unlike past editions, which recommended specific quantities, the 2010 key recommendations for dietary choices indicate increasing consumption of some foods and decreasing consumption of others, which may be easier for most people to understand. All told, these recommendations are sensible and, if undertaken, would likely lower an individual's risk of obesity and otherwise contribute to his or her health. However, we have seen that many Americans are clearly not following these recommendations.
The first step in making the DGA 2010 more effective in combating obesity is ensuring that everyone understands the message. Estimating the energy content of foods is an area of difficulty for many Americans, and research has shown that larger portion sizes add to the difficulty of accurate estimation (Geier and Rozin, 2009). Another area of information distortion is that people either may not understand what is meant by a "healthy" weight or they may reject the medical community's standards. A Harris poll found high rates of body size misperception, with 30% of overweight people thinking they were normal size, 70 percent of obese people viewing themselves as overweight, and 39% of morbidly obese people saying they were overweight but not obese (Harris Interactive, 2012).
Nutritional information for packaged food is already widely available, certainly far more available than it was 30 years ago when obesity rates were much lower. Under the 1990 Nutrition Labeling and Education Act (NLEA), all packaged food must bear nutrition labeling in a standard format, including calories per serving. Economic evaluation of the 1990 NLEA in terms of impact on obesity has been limited; however, one study shows these nutrition labels had a beneficial impact on reducing body weight, but only among non-Hispanic, white females (Variyam and Cawley, 2006). The 1990 NLEA may also have encouraged food processors to develop a wider range of low-fat products available to consumers (Arsenault, 2010).
As a provision of the 2010 health care reform legislation, restaurant chains with 20 or more stores will be required to post nutrition information on their standard menu items. Many such chains already provide this information voluntarily. Currently, four states (California, Maine, New Jersey, and Oregon) have menu labeling laws (TFAH and RWJF, 2011). Again, research on the impact of this type of labeling is limited, but one study indicates posting calories leads to a decrease of 6% in the number of calories per transaction (Bollinger, Leslie, and Sorensen, 2011).
Segmenting the consumer market may be a beneficial approach to making the DGA 2010 more relevant. Previous research on dietary behavior has identified three types of women consumers, "better eaters," "fair eaters," and "poor eaters" (Loughrey et al., 2001). Both the "better eaters" and the "fair eaters" were concerned about making healthful food choices, while the "poor eaters" were less likely than the "better eaters" to believe in the importance of eating a healthy diet. Finding a means to provide these different groups with different messages could be a helpful approach. While the "better eaters" may need only simple tips and encouragement to maintain or improve their current diet, the "fair eaters" may need more extensive messages appealing to their interests in taste and convenience. Finally, reaching the "poor eaters" will require the most intensive effort. Cultural relevance of the nutrition message is also important. Finding the budget to ensure that targeted and culturally relevant messages are delivered frequently may be difficult in our current economic environment, however.
The DGA 2010 goes beyond providing individual recommendations that could be translated into a nutrition education campaign; they advocate a society-wide, coordinated approach to the problem of obesity, involving families, communities, policy-makers, and educators. A Social-Economic Model in the DGA 2010 includes individual factors; the environmental settings; sectors of influence, which include government, public health and health care systems, agriculture, community design, industry, and media; and social and cultural norms and values. The publication states: "Interventions should extend well beyond providing traditional education to individuals and families about healthy choices, and should help build skills, reshape the environment, and re-establish social norms to facilitate individuals’ healthy choices" (page 57). Suggested strategies include expanding access to healthy foods for all segments of the population, partnering with producers and food suppliers to promote appropriate portions of nutritious food, implementing the U.S. National Physical Activity Plan (USDHSS, 2008), ensuring that education on nutrition and physical activity is provided to young people and that school meals and snacks are consistent with the dietary guidelines, limiting food and beverage marketing to children, and promoting physical activity for children year-round.
In considering any sort of policy intervention, analysts will generally want answers to three questions: Will the policy be effective? Will it be equitable? Will it be politically and socially acceptable? Rashad (2005), in discussing the possible causes of the obesity epidemic, notes that government intervention to change adult behavior can be controversial, and that the government "should get involved only in one of three cases: there is imperfect information, there are externalities, or people do not behave rationally" (page 35). What constitutes "rational" behavior in respect to diet, exercise, and obesity may be a matter for debate, however.
A pair of articles in a recent issue of the Australian Economic Review provides an illustration of two distinct approaches to obesity, the "rational-choice" economic model (Mavromaras, 2008) and the "public health" model (Moodie, 2008). The rational-choice economic model starts with the notion that our current obesity levels may not be optimal from a medical standpoint, but that these levels may be chosen freely by consumers as a willing trade-off in terms of their enjoyment of convenient and palatable food. If such is the case, no government intervention to change behavior is justified, at least for adults, although mechanisms, such as increased health insurance premiums, could possibly be explored to shift some or all of the excess medical costs to the consumers who "choose" obesity. As Philipson and Posner (2003) state, ". . . in a model of human behavior in which people are assumed to be rational actors, there is no such thing as being 'overweight.'"
By contrast, the public health model views obesity as a problem to be corrected because it is affecting so many people and its consequences are severe. Under a public health model, where the goal is to protect and promote the public's health and well-being, policy intervention to counter the rise of obesity may be viewed as justified if consumers are not seen as behaving "rationally" when it comes to satisfying short-term choices for food and exercise at the expense of their long-term health. Proponents of the public health model may point to the anti-smoking campaign as a successful intervention that helped reduce disease and mortality. The anti-smoking campaign had several components. Information about the risks of smoking was prominently displayed on tobacco product packages and similar messages were conveyed through the mass media. Hefty taxes were levied on cigarettes and other tobacco products. Advertising of cigarettes and other products was severely curtailed. Finally, physicians were enlisted to bring the message to their tobacco-using patients that these products were harmful to their health. In more recent years, bans on smoking in public places have made smoking inconvenient.
A recent article in “Lancet” provides an overview, based on available literature, of various strategies that could potentially reduce obesity rates (Gortmaker et al., 2011). Although diet and exercise, low-fat diets, family counseling for obese children, and gastric banding were among the reported strategies with the strongest scientific evidence of effectiveness, these individual interventions were not judged the most cost effective in terms of overall societal benefits, as measured by disability-adjusted life years saved. The three most cost-effective strategies, according to this article, might instead be environmental interventions similar to those used in the anti-tobacco campaign: taxing "unhealthy" foods and beverages, using front-of-pack "traffic light" labeling, and reducing "junk food" advertising to children. Scientific evidence for the effectiveness of these strategies is not always strong, however (Gortmaker et al., 2011; Avenell and Goode, 2008).
According to the DGA 2010, solid fats and added sugars make up a little over one-third of the typical American's daily energy intake, without otherwise contributing importantly to the nutrient quality of the diet. The goal of so-called "junk food" taxes would be to increase the prices of products high in solid fats and added sugars so that consumers would purchase fewer of them. Thirty states already tax soda more than other foods, but the tax rates are modest, averaging around 6% (Bridging the Gap Program, 2011) and demand for sugar-sweetened beverages is generally agreed to be inelastic, meaning it takes a relatively large hike in price to affect consumption to an appreciable degree (Zhen et al., 2010; Lin et al., 2011). The potential costs and benefits of a "soda tax" have been discussed thoroughly in a recent issue of this journal (Choices, Issue 14, 2011) and thus will not be discussed in detail here. However, economists have pointed out the importance of considering substitutes for the taxed beverages and that the long-run and short-run effects of the tax may differ (Dharmasena and Capps, 2011; Zhen et al., 2010).
By nature, any consumption tax is highly regressive, meaning it falls more heavily on those with lower incomes, especially if lower-income individuals are less willing or able to switch to other, non-taxed items. As such, consumption taxes may fail the "equity" test for interventions unless the revenue generated benefits the low-income consumers enough to off-set their cost. Because low-income people are especially vulnerable to increased risk of obesity, using the money generated by the tax to fund public health programs may make these policies more equitable. Indeed, public support for soda taxes has been shown to be high when the money raised from the tax has gone to such purposes (Chaloupka, Powell, and Chriqui, 2011). However, no research is yet available to show that taxes on soda, or other "junk food" such as salty snacks, would be economically efficient in terms of benefits and costs (Lusk and Schroeter, 2011; Kuchler, Tegene, and Harris, 2005.)
"Traffic light" labeling involves a "green light," "yellow light," or "red light" symbol prominently displayed on the front of the food package, with "green light" foods being those considered most healthful, and "red light" foods the least healthful. Overseas, where traffic light labeling is being pioneered, the symbols appear for total fats, saturated fats, sodium, and sugars. On the surface, the "traffic light" symbols would appear to provide a simple visual cue, which might help some individuals make dietary choices more in line with the DGA 2010. However, while little research is yet available on the impact of this type of labeling on consumer choices, the existing evidence does not show this labeling scheme to be effective in changing purchasing patterns (Sacks et al., 2011; Sacks, Rayner, and Swinburn, 2009).
The U.S. Institute of Medicine was recently charged with reviewing front-of-pack nutrition labeling and has issued two reports. These reports indicate that there is some limited evidence that simple and clear front-of-pack labeling may encourage the selection of healthier products; however, research to date has not targeted children or other vulnerable population groups (Institute of Medicine, 2010 and 2011). The second report included the recommendation that the Food and Drug Administration and the USDA should develop, test, and implement a standard front-of-pack labeling system for all food and beverage products, along with deploying a promotional and awareness campaign (Institute of Medicine, 2011).
Every year, billions of dollars are spent on food and beverage advertising in the United States. Limiting advertising of low-nutrient, high-calorie foods and beverages to children may seem a reasonable step, given that children are more impressionable than adults. However, protections on free speech may make a U.S. advertising ban infeasible or, at the least, unpopular. An alternative would be to eliminate the tax deductibility of such advertisements. Economists have estimated that elimination of tax deductibility for fast food ads would reduce their viewing by 40% for children and 33% for adolescents. In turn, this move would reduce the number of overweight children by 7% and the number of overweight adolescents by 5% (Chou, Rashad, and Grossman, 2008). Such a policy would have the added advantage of increasing tax revenues.
In a public health model, physicians would be important players in the goal of reducing obesity. However, research shows that there are important barriers to their participation in this effort, including inadequate training in diet and weight-loss counseling (Forman-Hoffman, Little, and Wahls, 2006). Further, physicians, like the rest of the public, are not immune to being overweight and obese, and doctors who do not maintain a healthy weight are less likely to counsel their obese patients about weight loss (Bleich et al., 2012). Obesity counseling by primary care physicians, even when offered, is not always found to be effective (Noël et al., 2011).
Thus, based on available research evidence, the type of public health tools that proved effective for reducing tobacco use may not work as well at reversing the obesity epidemic. Unlike tobacco use, obesity springs from a complex interaction of genetics and behavior, influenced by multiple factors in the environment. Further, many foods include a combination of healthful and less healthful ingredients—for example, fruit pies—or healthy ingredients prepared in less healthful ways—for example, fried chicken—making the parallel to tobacco uncertain and the targeted products for taxation or advertising restrictions far less clear.
A bridge between the "rational choice" economic model and the "public health" model may possibly be found in the field of behavioral economics. Behavioral economics addresses the problem of self-control in an economic framework that views long-run decisions as sometimes running contrary to short-run behavior. People may desire to save more for retirement or, in the context of this article, to eat better, exercise more, and achieve or maintain a healthy weight. However, short-term temptations thwart these long-run plans, leaving the consumer worse off than if he or she could muster more self-control. If such a model accurately describes human behavior, then "soft paternalism" or a form of presenting choices in such a way as to lead to better outcomes may be justified. An example of "nudging" people into making choices more consistent with their long-term goals is arranging food in a cafeteria line so that healthier choices are more prominently displayed (Thaler and Sunstein, 2008). Modifying the built environment so that people have more opportunities to walk or bicycle would be another way of presenting people with more choices, rather than constraining their options. However, bike lanes, pedestrian crossings, and green spaces all come at a cost, and either higher local taxes or other items of potential benefit to taxpayers—for example, better highway maintenance—may be the trade-offs. (See Cash and Schroeter (2010)) for more discussion on how behavioral economics might help frame choices that affect obesity rates.)
Finally, changes in certain government nutrition programs may be seen as a way to affect obesity rates, at least for targeted groups. The Healthy, Hunger-Free Kids Act of 2010 provides the USDA with the ability to make significant changes in the school lunch and breakfast programs, including improvements to the nutritional quality of the meals. This Act also gives the USDA authority to set nutritional standards for all foods sold in schools, including in vending machines, the "a la carte" lunch lines, and school stores. Some have advocated limiting purchases with SNAP benefits to healthful foods (Townsend, 2006). However, only Congress can decide what constitutes eligible food under SNAP, and there are currently no standards on what constitutes "healthy" or "unhealthy" food. Further, limiting food choices would be likely to increase the complexity and cost of administering the program (USDA, FNS, 2012). The article by Palma and Jetter, elsewhere in this issue, provides an extended discussion of the array of federal nutrition programs and how these programs may be affected by the DGA 2010.
The White House Task Force on Childhood Obesity recently issued a report to the President, advocating a multi-disciplinary, multi-pronged approach to reduce childhood obesity. Among other strategies, the report calls for improved labels on food and menu items, reduced marketing of some food products considered unhealthful to children, and improved health care services, including body mass index (BMI) measurement for all children (White House Task Force on Childhood Obesity, 2010). These recommendations specifically target children and do not address the problem of adult obesity, which may be more intractable. However, if childhood obesity can be curtailed in the current generation, in the long-run adult obesity could also be reduced.
Despite decades of consistent dietary recommendations from the U.S. government, many Americans eat a diet that considerably misses the nutritional targets. Poor diet quality is linked to higher body weight and poor health. As seen in the shift of the DGA target audience from individual consumers to policymakers, the federal government has realized that obesity is more than an individual-level problem. If we are to significantly reduce the levels of overweight and obesity in this country, more aggressive measures may be necessary beyond the periodic updating of healthy eating guidelines. The difficultly lies in determining the path such efforts should follow.
To inform the policy debate, it is necessary to expand our research on plausible policy alternatives and their consequences. How do we expand access to healthy foods for all segments of the population, partner with producers and food suppliers to promote appropriate portions of nutritious food choices, ensure that education on nutrition and physical activity is provided to young people, and that school meals and snacks fit the dietary guidelines? At the national level we have few tools available beyond tax incentives or penalties, along with measures such as control of purchasing choices of SNAP recipients and related government food assistance programs. But even these choices are wrought with potential problems and concerns. Only through an expanded and focused research agenda can each alternative be vetted and a responsible plan developed. However, in today’s budgetary environment, finding public money to support such an effort may be more difficult than curbing the obesity epidemic itself.
Andersen S.A., ed. (1990). Core indicators of nutritional state for difficult-to-sample populations. Journal of Nutrition, 120, (Suppl 11):1559S–1600S.
Arsenault, J. E. (2010). Can nutrition labeling affect obesity? Choices, 25, (3). Available online: http://www.choicesmagazine.org/magazine/article.php?article=140.
Avenell, A., and Goode, A. (2008). Assessing the evidence base for interventions to prevent the further increase in obesity. Australian Economic Review, 41, (1), 97-104.
Baum, C.L. (2011). The effects of food stamps on obesity. Southern Economic Journal,77 (3), 623-651.
Bitler, M. and Haider, S. J. (2010). An economic view of food deserts in the United States. Journal of Policy Analysis and Management, 30, (1), 153-176.
Bleich, S.N. Bennett, W.L., Gudzune, K.A., and Cooper, L.A. (2012). Impact of physician BMI on obesity care and beliefs. Obesity. Available online: http://www.nature.com/doifinder/10.1038/oby.2011.402.
Bollinger B., Leslie, P., and Sorensen, A. (2011). Calorie posting in chain restaurants. American Economic Journal: Economic Policy, 3 (1), 91-128.
Bridging the Gap Program. (2011). University of Illinois at Chicago. State Sales Tax on Regular, Sugar-Sweetened Soda (as of July 1, 2011). Available online: http://www.bridgingthegapresearch.org.
Cai, Y., Alviola, P.A., IV, Nayga, R.M., Jr., and Wu, X. (2008). The effect of food-away-from-home and food-at-home expenditures on obesity rates: A state-level analysis. Journal of Agricultural and Applied Economics, 40 (2): 507-521.
Cash, S.B., and Schroeter. C. (2010). Behavioral economics: A new heavyweight in Washington? Choices, 25 (3). Available online: http://www.choicesmagazine.org/magazine/article.php?article=142.
Cawley, J. (2004). The impact of obesity on wages. Journal of Human Resources, 39 (2), 451–74.
Center for Disease Control and Prevention (CDC). (2012). Nutrition resources for health professionals. Available online: http://www.cdc.gov/nutrition/professionals/
Chaloupka, F.J., Powell, L.M., and Chriqui, J.F. (2011). Sugar-sweetened beverages and obesity: The potential impact of public policies. Journal of Policy Analysis and Management, 30 (3), 645-655.
Christian, T., and Rashad, I. (2009).Trends in U.S. food prices, 1950–2007. Economics and Human Biology, 7 (1), 113–120.
Chou, S.Y., Grossman, M., and Saffer, H. (2004). An economic analysis of adult obesity: Results from the behavioral risk factor surveillance system. Journal of Health Economics, 23 (3), 565-587.
Chou, S.Y, Rashad, I., and Grossman, M. (2008). Fast-food restaurant advertising on television and its influence on childhood obesity. Journal of Law and Economics, 51 (4), 599-618.
Church, T.S., Thomas, D.M., Tudor-Locke, C., Katzmarzyk, P.T., Earnest, C.P., Rodarte, R.Q., Martin, C.K., Blair, S.N., and Bouchard, C. (2011). Trends over 5 decades in U.S. occupation-related physical activity and their associations with obesity. PLoS ONE 6, (5), e19657. doi:10.1371/journal.pone.0019657.
Coleman-Jensen, A., Nord, M., Andrews, M. and Carlson, S. (2011). Household Food Security in the United States in 2010. Economic Research Report No. (ERR-125). Available online: http://www.ers.usda.gov/Publications/ERR125/.
Cutler, D.M., Glaeser, E.L., and Shapiro, J.M. (2003). Why have Americans become more obese? Journal of Economic Perspectives, 17 (3), 93–118.
Dharmasena, S., and Capps, O. Jr. (2011). Intended and unintended consequences of a proposed national tax on sugar-sweetened beverages to combat the U.S. obesity problem. Health Economics. Available online: http://onlinelibrary.wiley.com/journal/10.1002/(ISSN)1099-1050/earlyview.
Dunn, R. (2010). The effect of fast-food availability on obesity: An analysis by gender, race, and residential location. American Journal of Agricultural Economics, 92 (4), 1149-1164.
Drewnowski, A. (2004). Obesity and the food environment: Dietary energy density and diet costs. American Journal of Preventive Medicine, 27 (3 Suppl), 154–162.
Drewnowski, A., and Specter, S.E. (2004). Poverty and obesity: The role of energy density and energy costs. American Journal of Clinical Nutrition, 79 (1), 6-16.
Duffey, K.J., and Popkin, B.M. (2011). Energy density, portion size, and eating occasions: Contributions to increased energy intake in the United States, 1977–2006. PLoS Medicine, 8 (6), e1001050. doi:10.1371/journal.pmed.1001050.
Engeland, A., Bjørge, T., Tverdal, A., and Søgaard, A.J. (2004). Obesity in adolescence and adulthood and the risk of adult mortality. Epidemiology, 15 (1), 79-85.
Fan, M. (2010). Do food stamps contribute to obesity in low-income women? Evidence from the National Longitudinal Survey of Youth 1979. American Journal of Agricultural Economics, 92 (4): 1165–1180.
Finkelstein, E.A., Ruhm, C.J., and Kosa, K.M. (2005). Economic causes and consequences of obesity. Annual Review of Public Health, 26, 239-257.
Finkelstein, E.A., Trogdon, J.G., Cohen, J.W., and Dietz, W. (2009). Annual medical spending attributable to obesity: Payer- and service-specific estimates. Health Affairs, 28, (5), w822-w831.
Flegal, K.M., Graubard, B.I., Williamson, D.F., and Gail, M.H. (2005). Excess deaths associated with underweight, overweight, and obesity. Journal of The American Medical Association [JAMA], 293 (15), 1861-1867.
Flegal, K.M., Carroll, M.D., Kit, B.K., and Ogden, C.L. (2012). Prevalence of obesity and trends in the distribution of body mass index among US adults, 1999-2010. Journal of The American Medical Association [JAMA], 307 (5): doi:10.1001/jama.2012.39. Available online: http://jama.ama-assn.org.
Forman-Hoffman, V., Little, A., and Wahls, T. (2006). Barriers to obesity management: a pilot study of primary care clinicians. BMC Family Practice, 7, 35.
Geier, A.B. and Rozin, P. (2009). Univariate and default standard unit biases in estimation of body weight and caloric content. Journal of Experimental Psychology: Applied, 15 (2), 153–162.
Gibson, D. (2003). Food stamp program participation is positively related to obesity in low income women. Journal of Nutrition, 133, 2225–2231.
Gortmaker, S. L., Swinburn, B.A., Levy, D., Carter, R., Mabry, P.L., Finegood, D.T., Huang, T., Marsh, T., and Moodie, M.L. (2011). Obesity 4. Changing the future of obesity: Science, policy, and action. Lancet, 378 (9793), 838-847.
Guenther, P.M., Reedy, J., and Krebs-Smith, S.M. (2008). Development of the healthy eating index-2005. Journal of the American Dietetic Association, 108 (11), 1896-1901.
Gundersen, C., Kreider, B., and Pepper, J. (2011). The economics of food insecurity in the United States. Applied Economic Perspectives and Policy, 33 (3), 281–303.
Guthrie, J.F., Lin, B.H., and Frazao, E. (2002). Role of food prepared away from home in the American diet, 1977–78 versus 1994–96: Changes and consequences. Journal of Nutrition Education and Behavior, 34 (3), 140–150.
Harris Interactive. (2012). "Overweight? Obese? Or Normal Weight? Americans Have Hard Time Gauging Their Weight." Available online: https://www.harrisinteractives.com/NewsRoom/HarrisPolls/tabid/447/mid/1508/articleId/558/ctl/ReadCustomDefault/Default.html
Institute of Medicine. (2010). Front of Pack Nutrition Rating Systems and Symbols, Phase I Report. Wartella, E.A., Lichtenstein, A.H., and Boon, C.S., Editors. Washington, D.C.: The National Academies Press.
Institute of Medicine. (2011). Front of Pack Nutrition Rating Systems and Symbols: Promoting Healthier Choices. Wartella, E.A., Lichtenstein, A.H., Yatkine, A., and Nathan, R., Editors. Washington, D.C.: The National Academies Press.
Kimbro, R.T., and Rigby, E. (2010). Federal food policy and childhood obesity: A solution or part of the problem? Health Affairs, 29 (3), 411-418.
Kuchler, F., Tegene, A., and Harris, J.M. (2005). Taxing snack foods: Manipulating diet quality or financing information programs? Review of Agricultural Economics, 27, (1), 4-20.
Lakdawalla, D., and Philipson, T. (2002). The growth of obesity and technological change: A theoretical and empirical examination. National Bureau of Economic Research Working Paper Series No. 8946.
Leonard, W. R. (2010). Size counts: Evolutionary perspectives on physical activity and body size from early hominids to modern humans. Journal of Physical Activity and Health, 7 (Suppl 3), S284-S298.
Lin, B.H., Smith, T.A., Lee, J.Y., and Hall, K.D. (2011). Measuring weight outcomes for obesity intervention strategies: The case of a sugar-sweetened beverage tax. Economics and Human Biology, 9, 329–341.
Loughrey K., Basiotis, P., Zizza, C., and Dinkins, J.M. (2001). Profiles of selected target audiences: promoting the Dietary Guidelines for Americans. Family Economics and Nutrition Review, 13 (1): 3-14.
Lusk, J., and Schroeter, C. (2011). When do fat taxes increase consumer welfare? Health Economics. Available online: http://onlinelibrary.wiley.com/doi/10.1002/hec.1789/pdf.
Mavromaras, K. (2008). Economics and obesity. Australian Economic Review, 41, (1), 78–84.
Moodie, R. (2008). Fat is good for business. Australian Economic Review, 41, (1), 85-89.
National Institutes of Health (NIH). (1998). Clinical guidelines on the identification, evaluation, and treatment of overweight and obesity in adults – The evidence report. NIH Publication 98-4083. Available online: http://www.nhlbi.nih.gov/
Nielsen, S.J., and Popkin, B.M. (2003). Patterns and trends in food portion sizes, 1977-1998. The Journal of The American Medical Association [JAMA], 289 (4), 450-453.
Noël, P.H., Wang, C.P., Bollinger, M.J., Pugh, M.J., Copeland, L. A., Tsevat, J., Nelson, K.M., Dundon, M.M., and Hazuda, H.P. (2011). Intensity and duration of obesity-related counseling: Association with 5-year BMI trends among obese primary care patients. Obesity. Available online: doi:10.1038/oby.2011.335.
Ogden, C.L., Carroll, M.D., Kit, B.K., and Flegal, K.M. (2012). Prevalence of obesity and trends in body mass index among U.S. children and adolescents, 1999-2010. Journal of The American Medical Association [JAMA], 307 (5), doi:10.1001/jama.2012.40. Available online: http://jama.ama-assn.org.
Orlet Fisher, J., Rolls, B.J., and Birch, L.L. (2003). Children’s bite size and intake of an entrée are greater with large portions than with age-appropriate or self-selected portions. American Journal of Clinical Nutrition, 77 (5), 1164–1170.
Papas, M.A., Alberg, A.J., Ewing, R., Helzlsouer, K.J., Gary, T.L., and Klassen, A.C. (2007). The built environment and obesity. Epidemiologic Reviews, 29, 129–143.
Philipson, T.J., and Posner, R.A. (2003). The long-run growth in obesity as a function of technological change. Perspectives in Biology and Medicine, 46, (3 Suppl), S87-S107.
Popkin, B.M., Duffey, K., and Gordon-Larsen, P. (2005). Environmental influences on food choice, physical activity and energy balance. Physiology & Behavior, 86 (5), 603-613.
Puhl, R., and Brownell, K.D. (2001). Bias, discrimination, and obesity. Obesity Research, 9 (12), 788–805.
Rashad, I. (2005). Whose fault is it we’re getting fat? Obesity in the United States. Public Policy Research, 12 (1), 30-36.
Rolls, B. J., Morris, E. L., and Roe, L.S. (2002). Portion size of food affects energy intake in normal-weight and overweight men and women. American Journal of Clinical Nutrition, 76 (6), 1207–1213.
Sacks, G., Rayner, M., and Swinburn, B. (2009). Impact of front-of-pack “traffic-light” nutrition labeling on consumer food purchases in the UK. Health Promotion International, 24 (4), 344-352.
Sacks, G., Tikellis, K., Millar, L., and Swinburn, B. (2011). Impact of ‘traffic-light’ nutrition information on online food purchases in Australia. Australian and New Zealand Journal of Public Health, 35 (2), 122-126.
Strine, T.W., Mokdad, A.H., Dube, S.R., Balluz, L.S., Gonzalez, O., Berry, J.T., Manderscheid, R., and Kroenke, K. (2008). The association of depression and anxiety with obesity and unhealthy behaviors among community-dwelling US adults. General Hospital Psychiatry, 30 (2), 127-137.
Thaler, R. H. and Sunstein, C. R. (2008). Nudge: Improving Decisions About Health, Wealth, and Happiness. New Haven, CT: Yale University Press.
Townsend, M.S. (2006). Obesity in low-income communities: Prevalence, effects, a place to begin. Journal of the American Dietetic Association, 106, (1), 34-37.
Trust for America's Health and Robert Wood Johnson Foundation (TFAH and RWJF). (2011). F as in Fat: How Obesity Threatens America’s Future, 2011 Issue Report. Available online: http://www.healthyamericans.org/report/88/
U.S. Department of Agriculture, Center for Nutrition Policy and Promotion (USDA, CNPP). (2008). Diet quality of low-income and higher income Americans in 2003-04 as measured by the Healthy Eating Index-2005 Nutrition Insight 42. Available online: http://www.cnpp.usda.gov/Publications/NutritionInsights/Insight42.pdf.
U.S. Department of Agriculture, Food and Nutrition Service (USDA, FNS). (2012). Implications of restricting the use of food stamp benefits -- Summary. Available online: http://www.fns.usda.gov/ora/menu/Published/snap/FILES/ProgramOperations/FSPFoodRestrictions.pdf.
U.S. Department of Agriculture and U.S. Department of Health and Human Services (USDA and USDHHS). (2010). Dietary Guidelines for Americans 2010. 7th Edition, Washington, DC: U.S. Government Printing Office.
U.S. Department of Health and Human Services (USDHHS). (2008). 2008 Physical Activity Guidelines for Americans. Washington (DC): U.S. Department of Health and Human Services. Office of Disease Prevention and Health Promotion Publication No. U0036. Available online: http://www.health.gov/paguidelines/
U.S. Department of Health and Human Services (USDHHS), Healthy People 2020. (2012a). Physical Activity: Overview. Available online: http://www.healthypeople.gov/2020/topicsobjectives2020/overview.aspx?topicid=33.
U.S. Department of Health and Human Services (USDHHS), Healthy People 2020. (2012b). Nutrition and Weight Status. Available online. http://www.healthypeople.gov/2020/topicsobjectives2020/overview.aspx?topicId=29.
Variyam, J. N., and Cawley, J. (2006). Nutrition labels and obesity. National Bureau of Economic Research, Inc., NBER Working Papers: 11956.
Wellman, N.S., and Friedberg, B. (2002). Causes and consequences of adult obesity: Health, social and economic impacts in the United States. AsiaPacific Journal of Clinical Nutrition, 11 (Suppl 8), S705-S709.
Westerterp, K.R., and Speakman, J.R. (2008). Physical activity energy expenditure has not declined since the 1980s and matches energy expenditures of wild mammals. International Journal of Obesity, 32 (8), 1256-1263.
White House Task Force on Childhood Obesity. (2010). Report to the President -- Solving the Problem of Childhood Obesity within a Generation. Available online: http://templatelab.com/task-force-on-childhood-obesity-report/
Wilde, P.E., McNamara, P.E., and Ranney, C.K. (1999). The effect of income and food programs on dietary quality: A Seemingly Unrelated Regression analysis with error components. American Journal of Agricultural Economics, 81, (4), 959-971.
Wolf, A.M., and Colditz, G.A. (1998). Current estimates of the economic cost of obesity in the United States. Obesity Research, 6, (2), 97-106.
Young, L.R. and Nestle, M. (2002). The contribution of expanding portion sizes to the US obesity epidemic. American Journal of Public Health, 92 (2) 246-249.
Zhen, C., Wohlgenant, M.K., Karns, S., and Kaufman, P. (2010). Habit formation and demand for sugar-sweetened beverages. American Journal of Agricultural Economics, 93 (1), 175–193.
Zizza, C., Siega-Riz, A.M., and Popkin, B.M. (2001). Significant increase in young adults' snacking between 1977-1978 and 1994-1996 represents a cause for concern. Preventive Medicine, 32 (4), 303-10.

