The job of an economist is not to explain what should be,
but rather to observe what is and help explain why it makes sense to be so.
(—Anonymous)
Farmland values are driven by a complex set of factors, including variables that affect expectations about future agricultural returns, alternative investment options, and macroeconomic conditions. Farmland prices also vary across locations due to urban influence, differences in agricultural production practices, crop suitability, and local policies. In addition, several structural characteristics of farm real estate markets—including idiosyncratic property features, ownership concentration, unique rental market features, and very thin transaction markets —may make farmland price dynamics appear to be more complex than those of traditional financial assets. Farmland markets may also be impacted by broader trends that affect other assets. With the stock market at record highs and bond yields near historically low levels, investors are paying higher multiples for future anticipated income—essentially, price-to-earnings ratios have risen or, alternatively, capitalization rates have declined. Because farmland generates income well out into the future, a similar effect could occur in farmland valuations if farmland markets behave similarly.
These characteristics have simultaneously puzzled some financial market observers and induced others to make claims of irrational values. In recent years, about the same number of commentators have indicated expectations of “bubbles” as have touted the asset class for its relatively strong performance and desirable diversification benefits. The popular press continues to devote significant coverage to links between land value and lease rates, with questions about future turning points, or substantial recalibrations from one direction to the other. Participants in the brokerage industry continue to report that many areas are still experiencing low volumes of sales but that there seems to be some strength returning in prices, with farmers remaining the primary buyers.
This article explains how interest rates impact farmland returns in the context of traditional capitalization arguments. Additional context is provided by considering characteristics of the farmland asset class and the changing interest rate environment that could affect how rising interest rates impact farmland returns. The intent remains to improve the basic understanding and appreciation of what is, not to claim that particular relationships are out of balance or to predict a future that is different from the present.
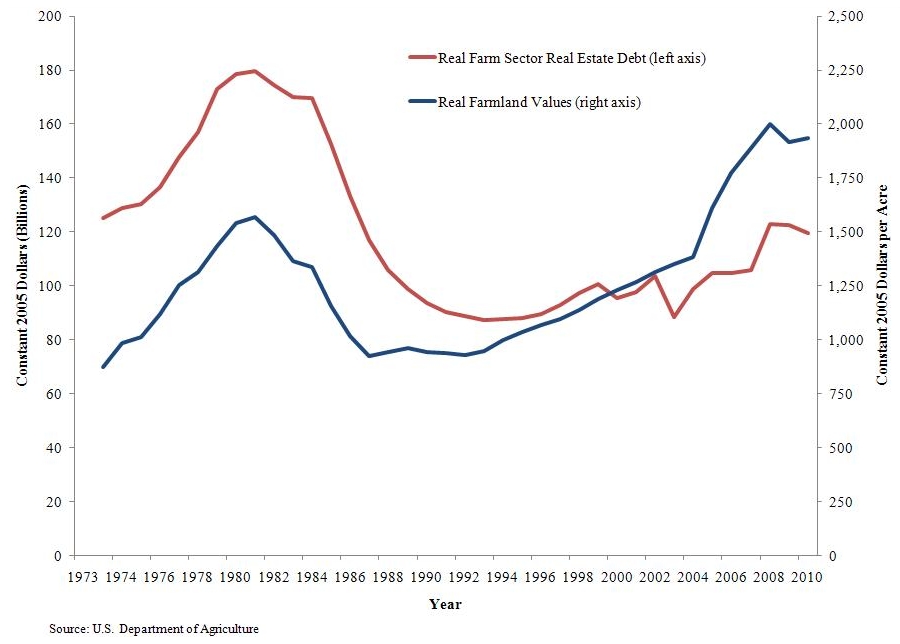
Farmland has historically been and remains a key input in agricultural production as well as an important asset for U.S. farmers. In 2017, just over 83% of the sector’s $3 trillion in assets were held in real estate (U.S. Department of Agriculture, 2018). Data also show that national farm real estate assets have increased at an annual rate of 6.5% since 2010 and by 3.3% in 2017 alone, providing a source of capital gains in addition to annual income streams from operating or renting the land. In row-crop regions of the United States, asset values have had a remarkably common pattern of appreciation through roughly 2014, with varying but smaller relative declines for the years thereafter. Many observers of Midwestern land markets have begun to indicate that a soft bottom seems to be forming and have noted that overall price changes have been less responsive relative to current incomes than is typical in other real asset markets.
Amazingly, total farm real estate debt was only $236 billion in 2017, or 9.4% of farm real estate asset values—representing far lower leverage than exists in most other sectors. If farmland were viewed as a traditional investable asset class, the relatively low aggregate leverage would represent a potentially attractive aggregation feature. Assets with low leverage but returns that are higher than the cost of debt capital can often be combined and borrowed against to increase the return on equity. However, historically isolated ownership of individual farmland parcels and low cash flow relative to total returns have limited the ability for individual owners to actively adjust the level of debt capital or to actively manage the optimal capital structure in individual farmland holdings.
Notes: CMT-10 is the 10-year constant maturity Treasury bond yield, Mortgage
rate (30-year) is the average yield on new 30-year residential mortgages, All
REITS is from the NAREIT series averaging all public REITS returns, NCREIF
is the National Council of Real Estate Investment Fiduciaries Farmland Index
returns, available from 1991 to present.
Source: TIAA Center for Farmland Research.
Farmland performance data are somewhat difficult to assemble as most farmland is held by individuals and returns data are not collected or reported to any single source. Moreover, the annual production cycle of most crops means agricultural income is only determined annually. However, the U.S. Department of Agriculture conducts annual surveys of farm-level performance including a variety of indicators, and the National Council of Real Estate Investment Fiduciaries (NCREIF) publishes an aggregated index of returns reported under identically enforced standards across all members who own and manage farmland. The TIAA Center for Farmland Research assembles these yearly and develops measures of returns standardized across asset classes, including a series aggregating equally weighted cropland returns across the 32 states with the top agricultural production (32-state farmland aggregate).
Table 1 compares the returns to farmland investments (income plus capital gain less property taxes), as measured by the NCREIF and the 32-state farmland aggregate, to alternative asset classes. The comparison is provided across various sub-periods along with summary correlation measures of aggregate farmland returns to other key investment categories. Interestingly, the mean farmland returns are generally in the upper end among the asset classes compared during each period analyzed. The NCREIF returns, which are representative of farms managed for active investment, tend to have higher—but slightly more variable—returns.
Farmland also exhibits characteristics that make it a potentially attractive diversification option. The reported correlations, which are all relative to the 32-state farmland aggregate, illustrate that farmland has displayed negative correlation with equities, near zero correlation with fixed income investments, and a positive correlation with inflation for virtually any sub-period examined. Diversification most effectively reduces risk when asset returns are uncorrelated or negatively correlated and inflation erodes the value of an investment. These characteristics of farmland returns can make them both effective for portfolio diversification and wealth preservation.
At a basic level, farmland markets should behave similarly to other income-generating assets and have prices that reflect underlying expectations about future income, income growth potential, and the cost of capital supporting the investment in the asset. The use of a simple theoretical model relating income expectation and current values can be insightful to understand how farmland values may react to changes in their fundamentals. To this end, farmland is commonly modeled as an asset earning income (R) at each period (t), indefinitely into the future. While the exact present value of future returns is unknown, farmland values should reflect some form of current expectations of the present value of these returns:
(1)  Under the simplifying assumptions of constant discount rate (r) and growth in future income (g), the model can be simplified to find that current farmland values are a function of today’s income and the growth adjusted capitalization rate:
(2)  Both equations highlight that farmland values are determined by fundamental determinants: income, the growth rate in income, and discount rates. Of course, individual owners can also choose to abstract from these features and implicitly accept lower returns or create higher returns through superior management of specific assets, but, in general, one might expect that typical financial constructs hold at the margin. Accordingly, an upward (downward) shift in future returns, or the growth of returns, should result in higher (lower) farmland values (Schnitkey and Sherrick, 2011). Since prevailing interest rates are often used to discount future returns to today’s dollars, they are also a fundamental determinant of farmland values in the capitalization framework. All else equal, rising interest rates would be expected to reduce the value of farmland by decreasing the present value of future returns, while a lower interest rate environment would support higher values (Schnitkey and Sherrick, 2011).
Sources: Federal Reserve H.15, U.S. Department of
Agriculture (2017), and TIAA Center for Farmland Research.
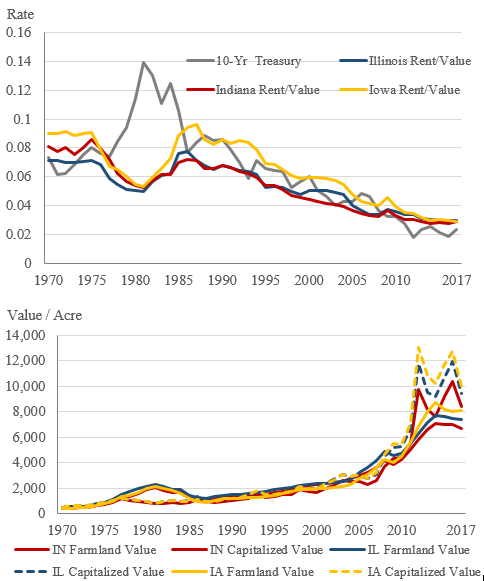
Figure 1 shows two related concepts applying the capitalization framework to farmland values in Iowa, Illinois, and Indiana. The top panel shows the implied capitalization rates, calculated as each state’s rent-to-value ratio, which are fairly consistent with the 10-year constant maturity U.S. treasury (CMT-10) yield; the implied capitalization rates tend to track the CMT-10 except in the early 1980s, when the divergence from fundamentals was fueled by idiosyncratic policies and lending practices that largely do not exist today. The farmland capitalization rates for each state have also remained above the 10-year CMT interest rate for the last several years. The bottom panel shows actual farmland values versus those implied when a simple version of the capitalization framework is used and current income is divided by the most recent CMT-10 rate. While the two graphics illustrate similar information, the lower panel highlights that the end of the sample period shows a pattern where farmland values did not fully adjust upward to the implied levels found by capitalizing current income.
A past analysis of the sensitivity of Illinois farmland values to rising interest rates suggested that the current gap between implied and actual farmland values could provide some cushion if rates increase; however, if interest rates move toward the long-run policy goals stated by the Federal Reserve’s Federal Open Market Committee (FOMC), there could be substantial downward pressure on Illinois farmland values (Schnitkey, 2016). But one complication is that factors leading interest rates higher are also likely to impact the growth rate in earnings, muddling the impact of higher interest rates on the farmland capitalization rate. As presented earlier in Table 1, farmland returns have historically been positively correlated with the Consumer Price Index, which is a measure of inflation. As inflation often leads to increases in nominal income generated by commodity producing assets, this correlation could temper the impact of a rising rate environment on farmland values. Additionally, characteristics of the changing interest rate environment may affect the impact of rising interest rates on farmland values.
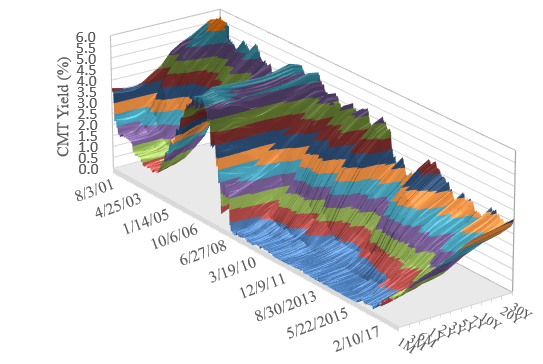
Note: M=month; Y=year.
Source: Federal Reserve H.15 Series.
Figure 2 shows a long period of weekly U.S. treasury yields, with the vertical axis indicating the interest rate, the front axis showing the time from early 2001, and the right axis showing the length of time to maturity. Following the housing crisis of 2008, the shorter-maturity end of the yield curve has been stable at historically low levels. Although the short end of the yield curve has gradually increased in response to the FOMC’s five federal funds rate increases since December 2015, the impact has not propagated forward to longer-term yields. The 10-year constant maturity U.S. treasury (CMT-10) rates, often used as a proxy for farmland capitalization rates, have thus far been less affected by the Federal Reserve’s interest rate policy normalization. The low and relatively stable interest rate markets have likely contributed to the continued resilience of farmland values, despite current lower farm income levels.
Potential structural changes related to additional investment in lower-yielding, short-term assets and the possible “permanentization” of lower interest rate levels, along with low inflation pressures, could also influence how interest rate changes impact farmland values. The amount of common equity capital at financial firms has roughly doubled since 2008, and most of this capital has been invested in lower yielding assets at shorter terms to maturity. Higher demand for shorter-maturity assets and lower interest rate levels in fixed income markets could spur investment in other classes as investors search for higher yield. In turn, this extra demand can drive valuations higher for other assets by increasing their current price relative to unchanged future income streams, an effect commonly cited as expansion of the valuation multiples.
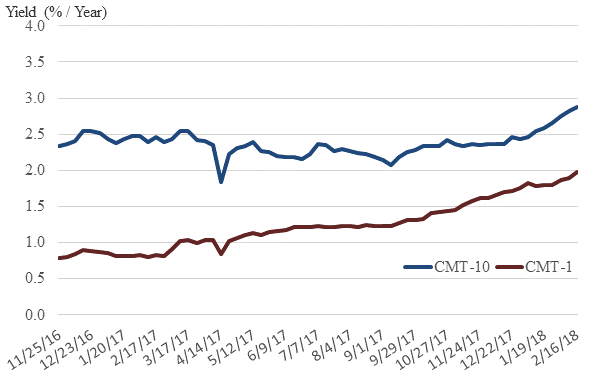
Source: Federal Reserve H.15 Series.
A “new normal” of a sustained lower and flatter yield curve would be consistent with increases in prices paid for future income and would favor assets with longer-term income streams. Given the relatively long duration of farmland, this could also support higher values moving forward if a similar relationship holds in farmland markets. Figure 3 compares the 1-year and 10-year CMT yields from a few weeks prior to the December 2016 FOMC rate increase through February 16, 2018. This illustrates the flattening of the yield curve, as the 1-year treasury yield has risen in response to Federal Reserve Rate increases, while the CMT-10 yield has remained largely range bound until 2018, when a set of news events began pushing yields upward.
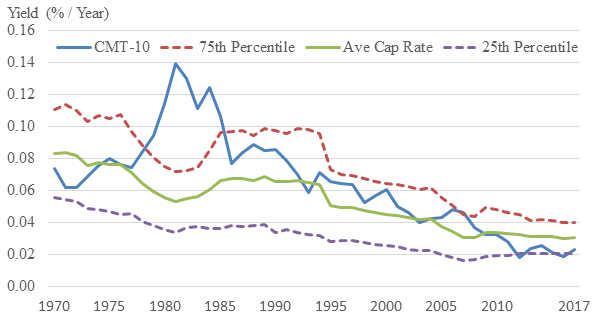
Source: Author’s calculations using U.S. Department of
Agriculture (2017) and Federal Reserve H.15 Series.
To further explore the relationship between farmland returns patterns and interest rate conditions, the implied cap rate was calculated for each of the states included in the 32-state farmland aggregate used in Table 1 from 1970 to the present. For each year, a simple average of the implied cap rates and the 25th and 75th percentiles across these 32 states were identified (both directly and under a parameterized version with virtually identical results). Figure 4 shows these results through time and visually confirms the same information suggested by the analysis of Iowa, Illinois, and Indiana presented earlier. Moreover, the early period shows a far greater dispersion of capitalization rates across the 32 states—as measured by the spread between the 25th and 75th percentiles—when interest rate markets were at generally higher and more volatile levels. Interestingly, the 10-year CMT has been below the average cap rate for farmland in the top 32 agricultural states since the housing crisis and has recently hovered around the 25th percentile. These presentations help highlight why institutional investors have renewed interest in the asset class, as it provides an alternative potential returns pattern that appears favorable in terms of relative levels – even at these historically low rates.
Of course, historical farmland valuations may not appear irrational in the capitalization framework for several reasons. For example, farmland values may not have fully responded to increases in income in the mid-2010s because the income increases were viewed as transitory. Farmland, like other long-duration, inflation-sensitive assets, might also increase in value relative to other assets under declining and stabilizing capital-cost environments. Alternatively, the flattening of the yield curve could have allowed a small risk premium in farmland assets to show up as an increase in yield relative to a constant-term, risk-free security, all else equal. While space prevents a more complete presentation of the nuances of these arguments, farmland prices overall seem rational relative to the implications of capitalization arguments. The flip side of that argument would be that farmland values would also be expected to fall if interest rates and the cost of capital underlying farmland were to rise dramatically, all else equal.
Given the above discussion and the historic performance of the asset class, one might expect it to be offered in a deeply traded and well-understood platform. However, there is no broadly available, well-functioning equity market for agricultural real estate, and individual owners still represent a large share of operators. Development of ag-related funds and institutional agricultural investment platforms holds promise for increased standardization or access to equity investments in the asset space. But the total fraction of the $3 trillion sector represented in these cases remains small. For context, the value of land held in the NCREIF index comprises less than 0.5% of the total value of all farm real estate. Even if one were to eliminate non-cropland real estate and small and hobby farm holdings and make other adjustments to approach what might be thought of as institutionally appropriate farmland (perhaps less than 50% of the total), institutionally held farmland would remain a relatively small proportion of the total. While the pace toward more complete financialization is difficult to predict, this could be a source of additional future farmland demand.
But the acquisition and management platforms required to meaningfully operate in this space represent substantial investments and cannot be expected to exist for one-time rebalancing efforts. A few institutional investors have made the significant commitment to the infrastructure needed to operate in this space and have done so with an internationally active scope as well. TIAA (Nuveen) has the single largest fund structure and has by far the largest acquisition and management platform, with significant scale international investments as well. Several publicly traded Farmland real estate investment trusts (REITs) have also emerged as farmland investment options. While the two most visible publicly traded REITs in the United States (Farmland Partners (ticker: FPI) and Gladstone (ticker: LAND) have begun to make inroads, they are each still very small relative to the scale of the sector. Still, these are viewed as critically important efforts in the ongoing maturation of the market and the eventual development of an equity market that allows direct access to returns from investments into farmland.
Another feature of the asset class that could explain why higher-than-expected returns seem to have been sustained is the incredibly low primary turnover in farmland markets. Only about 1% of farmland turns over at arm’s length each year, even though considerably more changes title due to estate settlement within families and transfers among related parties (Sherrick, 2012). Simply put, farmland is a difficult asset to acquire at scale in a short period of time, and the “excess returns” found in relatively naïve assessments of historic performance would be forfeited through market frictions and liquidity premia if one tried to acquire and dispose of it in shorter periods.
Farmland markets have received substantial attention, partly due to the relatively attractive historic performance and partly due to what many perceive as puzzling stability relative to income variation through time. While no claim is made that all transactions are rational or that the market is particularly efficient relative to other, more developed financial markets, the aggregate measures provided relating returns and capital costs to values do not show any notable aberrations from the commonly used capitalization concept. This means rising interest rates may put downward pressure on farmland values. But this impact could be less than the capitalization model would suggest if structural changes result in the “permanentization” of relatively a relatively lower and flatter yield curve, leading investors to pay higher multiples for future income.
Characteristics of the farmland asset class could also affect how a rising interest rate impacts farmland values. The presented comparison of farmland returns and correlations to other asset classes illustrate both the relatively strong level of farmland returns, and its potential diversification benefits. These benefits likely mean there will be continued interest in expanding farmland investment options. Combined with the relatively low turnover of farmland, this additional demand could also help support values.
Continued investment interest in farmland could also help improve the information and technology available to assess land’s production potential. This could make the investment class more routine and easily interpreted, potentially leading to less-sensationalized income movements or revaluations occurring in response to changes in future income and capital cost changes. The continued evolution of the farmland market will ensure it remains an interesting asset class to study.
Board of Governors of the Federal Reserve System. Selected Interest Rates (Daily) – H.15. Available online: http://www.federalreserve.gov/releases/h15/data.htm
Schnitkey, G. 2016. “Rising Interest Rates and Farmland Prices.” farmdoc daily (6):236, Available online: http://farmdocdaily.illinois.edu/2016/12/rising-interest-rates-and-farmland-prices.html
Schnitkey, G .D., and B. J. Sherrick. 2011. “Income and Capitalization Rate Risk in Agricultural Real Estate Markets”. Choices 26(2).
Sherrick, B. J. 2012. “Farmland Turnover in Illinois.” farmdoc daily, Available online: http://farmdocdaily.illinois.edu/2012/11/farmland-turnover-in-illinois.html
Sherrick, B. J. 2017. “Updated Farmland Values and Indexing Tools - 2017“ farmdoc daily (7):146, Available online: http://farmdocdaily.illinois.edu/2017/08/updated-farmland-values-indexing-tools-2017.html
U.S. Department of Agriculture. 2017. Quickstats Database. Washington, DC: U.S. Department of Agriculture, National Agricultural Statistics Service. Available online: https://www.nass.usda.gov/Quick_Stats/
U.S. Department of Agriculture. 2018. Farm Income and Wealth Statistics. Washington, DC: U.S. Department of Agriculture, Economic Research Service. Available online: http://www.ers.usda.gov/data-products/farm-income-and-wealth-statistics.aspx

