

Growth in supply of agricultural commodities is primarily driven by growth in productivity, especially as land and water resources for agriculture have become more constrained. Hence, the future path of agricultural productivity will be the key determinant of the future of the world food equation. Here we present and assess trends in agricultural productivity growth over recent decades as a first step to informing views about likely agricultural supply and food security outcomes worldwide over the decades ahead.
Our emphasis is on global trends in selected partial factor productivity measures that express output relative to a particular input such as land or labor. These include crop yields, which measure the quantity produced of a particular output relative to a particular input, land. Descriptions of more-complete measures of productivity for selected key agricultural countries or regions of the world, including Canada, China, the former Soviet Union (FSU) and Eastern Europe, and the United States, are presented in the articles that follow. These agricultural economies are each quite distinctive (Table 1), and productivity developments within them have global consequences, given that they collectively produce around one-half of the world’s agricultural output value.
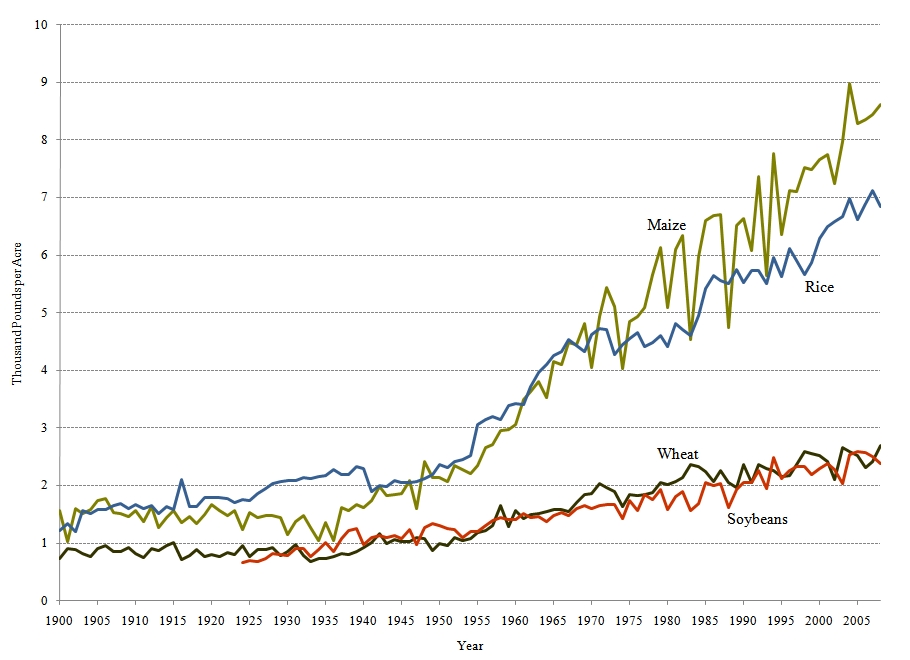
Measuring and interpreting productivity and its rate of growth is difficult enough, let alone changes in productivity growth rates. The substantial annual variation in input use and uncontrolled factors such as weather together drive the year-to-year variation in aggregate output. This makes it difficult to discern the onset, magnitude, and duration of any structural shifts in agricultural productivity trends (Figure 1). Year-to-year variations in measured productivity growth might reflect the influences of short-term, transient factors such as weather impacts or policy changes; they might also be the result of measurement errors such as those associated with variable utilization rates of capital or land. In addition, measured growth rates are sensitive to the choices of starting and ending dates, and more so when the intervals are shorter.
Figure 2 includes yield growth rates for selected U.S. crops—including maize, wheat, rice, and soybeans—for various time periods. For maize, wheat, and rice, yield growth rates accelerated in the second half of the 20th Century relative to the first half; in the second half of the century wheat and maize yields grew at around three times the growth rate in the first half century. For soybeans, in contrast, the rate of growth of yields after 1950 was half that for 1924-1950. However, for all four crops, the average annual rates of yield growth were much lower in 1990-2008 than in 1950-1990. For example, maize yields increased by 2.83% per year during 1950-1990, but only 1.45% per year thereafter, while the growth in wheat yields slowed from 2.18% per year to just 0.71% per year.
Global annual average rates of yield growth are reported in Table 2, which includes separate estimates for high-, middle-, and low-income countries and the world as a whole, for two sub-periods: 1961-1990 and 1990-2007. The slowdown evident for the global averages (Table 2) mirrors the slowdown in U.S. crop yield growth (Figure 2), although beginning from comparatively low yields, low-income countries had increasing rates of growth in wheat and rice yields since 1990. Thus low-income countries gained some ground since 1990, however the rebound in yield growth in this part of the world failed to fully make up for the comparatively low growth rates they experienced in 1961-1990. Consequently, significant yield gaps persist: the low-income-country versus world relativities of average maize, wheat, and rice yields in 2007 have fallen below the corresponding 1961 relativities. Low-income countries had average soybean yields that were about 50% of the world average in 1961, and that same gap persisted through to 2007.
For all four commodities, in both high- and middle-income countries—collectively accounting for between 78.8 and 99.4% of global production of these crops in 2007—average annual rates of yield growth were lower in 1990-2007 than in 1961-1990. The growth of wheat yields slowed the most and, for the high-income countries as a group, wheat yields barely changed over 1990-2007. Global maize yields grew at an average rate of 1.77% per year during 1990-2007 compared with 2.20% per year for 1961-1990. Likewise rice yields grew at less than 1.0% per year during 1990-2007, less than half their average growth rate for 1960-1990. Again, paralleling productivity developments in the United States, the slowdown in crop yields is quite pervasive. In more than half of the countries that grew these crops, yields for rice, wheat, maize, and soybeans grew more slowly during 1990-2007 than during 1961-1990. More critically, the slowdown was generally more widespread than among the top ten producing countries worldwide.
The slowdown is also pervasive and even more pronounced when countries are aggregated in terms of harvested area. Looking at the period after 1961, the growth in yields of wheat, rice, and soybeans slowed after 1990 in countries accounting for more than 70% of the world’s harvested area; for corn around 65% of harvested area was in countries with slower yield growth after 1990. Latin America is the only continent where countries accounting for more than half the harvested area for all four crops had yields growing at more rapid rates after 1990 than before. Notably, countries accounting for more than 90% of the harvested area among the high-income countries saw the pace of growth of maize and rice yields slow after 1990, while all of the high-income countries had wheat and soybean yields growing at a slower rate in the more recent period.
Moving beyond crop yields to more broadly construed productivity measures, global productivity trends show a 2.4-fold increase in aggregate output per harvested area since 1961, equivalent to annual average growth of 2.0% per year. Accompanying this increase in land productivity was a 1.7-fold increase, or 1.2% per year growth, in aggregate output per agricultural worker (Table 3). These productivity developments reflect global agricultural output growing relatively quickly compared with the growth in the use of agricultural land and labor—0.3% and 1.1% per year, respectively.
In parallel with the global crop yield evidence presented above, the longer-run growth in land and labor productivity masks a widespread—albeit not universal—slowdown in the rate of growth of both productivity measures during 1990-2005 compared with the previous three decades. China and Latin America are significant exceptions, both having considerably higher growth rates of land and labor productivity since 1990. Among the top 20 producing countries according to their 2005 value of agricultural output, land and labor productivity growth was substantially slower in 1990-2005 than in 1961-1990 once the large, and in many respects exceptional, case of China is set to one side. After setting aside the top 20 producing countries, on average across the rest of the world, the slowdown is even more pronounced: for this group of countries land productivity grew by 1.83% per year during the period 1961-1990, but by only 0.88% per year thereafter; labor productivity grew by 1.08% per year prior to 1990, but barely budged during the period 1990-2005.
Worldwide, after 1990 the growth rate of land productivity slowed from 2.03% per year to 1.82% per year, whereas the growth rate of labor productivity increased from 1.12% per year for 1961-1990 to 1.36% per year for 1990-2005. Once again these world totals are distorted by the significant and exceptional case of China. Netting out China, global land and labor productivity growth has been slower since 1990 than during the prior three decades. The same period relativities prevail if the former Soviet Union (FSU) is also netted out, although the magnitude of the global productivity slowdown net of China and the FSU is less pronounced because both partial productivity measures for the FSU actually shrank after 1990.
The published literature has documented a strong association between lagged R&D spending and agricultural productivity improvements. Among other things, the past and present pace and orientation of agricultural R&D will substantially influence the future rates of yield increase and productivity growth more generally (Alston, et al. 2000). Worldwide, public investment in agricultural R&D increased by 35% between 1981 and 2000, growing from an estimated $14.2 billion to $20.3 billion in 2000 international dollars (James, Pardey, and Alston 2008). It grew faster in less-developed countries, and the developing world now accounts for about one-half of global public-sector spending—up from an estimated 41% share in 1980. However, developing countries still account for only about one-third of the world’s total agricultural R&D spending when private investments are included.
A notable feature of the trends was the contraction in support for public agricultural R&D among developed countries. From 1950 to 2007, in inflation-adjusted terms, total U.S. public spending on agricultural research grew by 2.16% per year; but from 1980 to 2007, spending growth slowed to only 0.79% per year. Similar shifts in agricultural research spending have been observed in at least some other countries. Public agricultural R&D was massively reduced in Japan (and also, to a lesser degree, in several European countries) towards the end of the 1990s, leading to a reduction in the rate of increase in developed-country spending as a whole for the decade.
The more recent data reinforce the longer-term trends. Namely, support for publicly performed agricultural R&D among developed countries is being scaled back, or slowing down, and R&D agendas have drifted away from productivity gains in food staples towards concerns for the environmental effects of agriculture, food safety and other aspects of food quality, and the medical, energy, and industrial uses of agricultural commodities. See, for example, Alston, Anderson, James, and Pardey (2010) for detailed information on the changing orientation of U.S. public agricultural R&D.
Throughout history, commentators have waxed and waned about the relative rate of growth of food supply versus demand and the ability of the world to feed itself. In the face of stagnant or slowly growing crop yields and on the back of several seasons of widespread drought—notably in South Asia and especially in large and rapidly growing countries like India—the prevailing mood in the early 1960s was one of Malthusian pessimism (Figure 3). The subsequent several decades saw a turnaround in crop yield and productivity trends in many, but by no means all, parts of the world as the Green Revolution took hold. Pessimism gave way to complacency as the Green Revolution gains were largely carried forward throughout the 1970s and 1980s.
However, on the heels of a recent rapid run-up in global food commodity prices, old doubts have resurfaced about our collective ability to sustain increases in global food supplies that outstrip the growth in demand. As in the past, how the world’s food equation will be balanced depends in large measure on the rate of agricultural productivity growth in the decades ahead. The evidence presented here is indicative of a structural shift in the rate of productivity growth such that in many countries and in the world as a whole agricultural productivity has grown at a slower rate in the 1990s and the first decade of the 21st Century compared with earlier decades.
We suspect that a substantial share of past agricultural productivity growth resulted from agricultural R&D, and, notably, in the high-income countries the growth in R&D spending has slowed the most and so too has the growth in yields of the four important crops presented above. Consistent with that view, and the fact that research affects agricultural productivity with a long time lag, we also suspect that substantial shares of the reduced growth in productivity observed during the past decade or two are attributable in significant part to a slowdown in the rate of growth in R&D spending on agricultural R&D a decade or two previously (Pardey, Alston, and Piggott, 2006).
An implication of our analysis is that a restoration of the growth in spending on agricultural R&D may be necessary to prevent a longer-term food price crisis of a more-enduring nature. This message may be discounted or dismissed on the grounds that, if necessary, science can solve this problem as it did in the 1970s, proving false the prophecy of the doomsayers of the time such as the “Club of Rome.” Optimism about the potential for science to contribute to solving our problems may well be justified, but an appropriate investment in science and the translation of that scientific knowhow into technological changes on farms is required to realize that potential—it should not be forgotten that the 1960s and 1970s witnessed very rapid growth in spending on agricultural science around the world, including the creation of the Consultative Group on International Agricultural research (CGIAR), which played an instrumental role in the Green Revolution (Alston, Dehmer, and Pardey, 2006).
Agricultural science has much to offer, and many significant innovations are in progress if not already in the pipeline, especially in the area of biotechnology. Such prospects might provide grounds for optimism about the potential of agricultural supply to more than keep pace with demand (Figure 3). But even if the technology possibilities can be realized and widely adopted, there are big differences between what is possible in the laboratory and what happens worldwide in farmers’ fields. We have to remember that the regulatory approval process is long and expensive and is getting longer and more expensive for new biotech crop varieties, so the rates of innovation will be slower in farmers’ fields than in laboratories. And much of the world has not even begun to adopt biotech or otherwise improved varieties because of perceived market resistance or other political and economic barriers, so the benefits from any rapid yield gains in modern crop varieties, including biotech, will accrue only on a fraction of farmers’ fields around the world in the short to medium term. While it may be hard to attribute a slowdown in productivity unequivocally to a prior slowdown in research spending, it is not hard to make a case that an increase in spending on farm-productivity-oriented research is warranted if we want to see even a partial return to the rates of productivity improvement enjoyed during the 1970s and 1980s.
Alston, J.M., Andersen, M.A., James, J.S., and Pardey, P.G. (2010). Persistence Pays: U.S. Agricultural Productivity Growth and the Benefits from Public R&D Spending. New York, NY: Springer.
Alston, J.M., Beddow, J.M., and Pardey, P.G. (2009). Agricultural Research, Productivity, and Food Prices in the Long Run. Science, 325(4), 1209-1210.
Alston, J.M., Dehmer, S., and Pardey, P.G. (2006). International Initiatives in Agricultural R&D: The Changing Fortunes of the CGIAR. In P.G. Pardey, J.M. Alston, and R.R. Piggott (Eds.), Agricultural R&D in the Developing World: Too Little, Too Late? (313-360).Washington, DC: International Food Policy Research Institute.
Alston, J.M., Marra, M.C., Pardey, P.G., and Wyatt, T.J. (2000). A Meta Analysis of Rates of Return to Agricultural R&D: Ex Pede Herculem? (IFPRI Research Report No 113). Washington, D.C.: International Food Policy Research Institute.
Ehrlich, P.R. (1968). The Population Bomb. New York, NY: Ballantine Books.
Hardin, G.J. (1977). The Limits of Altruism: An Ecologist’s View of Survival. Bloomington, IN: Indiana University Press.
James, J.S., P.G. Pardey, and J.M. Alston. Agricultural R&D Policy: A Tragedy of the International Commons. Department of Applied Economics Staff Paper No. P08-08, St Paul, University of Minnesota, September 2008.
Malthus, T. (1993). An Essay on the Principle of Population. Oxford, UK: Oxford University Press. (Original work published 1798).
Paddock, W., and Paddock, J. (1967). Famine 1975! America’s Decision: Who Will Survive? Boston, MA: Little, Brown.
Pardey, P.G., Alston, J.M., and Piggott, R.R. (Eds.). (2006). Agricultural R&D in the Developing World: Too Little, Too Late? Washington, DC: International Food Policy Research Institute.
| United States | Canada | China | FSU & E. Europe | Global Total | |
| Population (million) | 304.10 | 33.30 | 1325.60 | 379.30 | 6692.00 |
| Rural population (million) | 55.60 | 6.50 | 754.30 | 138.20 | 3339.60 |
| GDP (billion/ year) |
14204.30 | 1400.10 | 4326.20 | 3521.60 | 60585.30 |
| Ag GDP (billion/ year) |
153.40 | 30.80 | 489.30 | 192.00 | 1793.30 |
| Per capita GDP ($/year) | 46715.50 | 42030.40 | 3263.50 | 9285.20 | 9053.40 |
| Ag GDP as percent of total GDP (%) | 1.08 | 2.20 | 11.31 | 5.45 | 2.96 |
| Per capita Ag GDP ($/year) | 504.53 | 924.67 | 369.10 | 506.31 | 267.98 |
| Agricul- tural land area (1,000 sq. km.) |
4147.80 | 675.00 | 5563.30 | 6133.40 | 49556.60 |
| Ag land as share of total land area (%) | 45.270 | 7.42 | 59.64 | 26.43 | 38.17 |
| Top 5 crops by value | Maize (31.2) | Wheat (30.2) | Rice (14.7) | Wheat (24.8) | Rice (12.1) |
|
Share in paren-theses (%)
|
Soybeans (17.3) | Rapeseed (17.5) | Maize (6.0) | Potatoes (16.9) | Wheat (9.3) |
| Cotton (9.3) | Barley (9.6) | Wheat (5.8) | Cotton (5.9) | Maize (7.7) | |
| Wheat (8.6) | Maize (7.4) | Cotton (5.1) | Maize (5.5) | Cotton (5.0) | |
| Tomatoes (3.8) | Potatoes (5.3) | Potatoes (4.1) | Barley (5.4) | Potatoes (4.4) | |
| Output value per labor (2005/6 value) | 66601 | 63237 | 749 | 4975 | 1205 |
|
Growth rate 1961 - 2005/6 (%/year)
|
2.92 | 4.35 | 3.03 | 2.27 | 1.20 |
| Output value per hectare (2005/6 value) | 541 | 532 | 678 | 253 | 354 |
|
Growth rate 1961 - 2005/6 (%/year)
|
1.70 | 1.95 | 3.39 | 0.41 | 1.96 |
| Land /labor ratio (2005/6 value) | 123.0 | 118.9 | 1.1 | 19.7 | 3.4 |
|
Growth rate 1961 - 2005/6 (%/year)
|
1.23 | 2.41 | -0.36 | 1.86 | -0.76 |
Source: Commodity value and productivity values are calculated using an IFPRI extraction of FAO data, and are based on average 1999-2001 prices. Other values are from the World Development Indicators database (World Bank, extracted October, 2009) and are for the most recent year available, usually 2008.
|
The interpretation of average global crop yields is problematic for several reasons. It can be especially difficult to disentangle the effects of changes in technologies, such as improved crop cultivars, from changes in the use of inputs like fertilizer, pesticides, and irrigation. Moreover, year-to-year fluctuations in weather have direct and measurable yield consequences that are typically pronounced for smaller versus larger areas, for example, a national versus regional versus global average. More subtly, countries located in tropical and temperate regions of the world differ considerably in terms of their propensity to plant multiple crops per year, and cropping intensities have changed considerably over time for certain regions of the world. Consequently, reporting yields on the basis of harvested area would understate the rate of growth in crop yields compared with crop yields measured on the basis of arable area if the intensity of crop plantings per year had increased over time. Another confounding factor when interpreting changes in global or regional yield aggregates, as well as national aggregate yields for that matter, is the effect of the changing spatial location of production. Changes in location of production imply changes in average productivity reflected in yields to the extent that different locations have different endowments of soils and climate, different incentives, and different technological opportunities. Thus, for example, a country's average yield of a commodity may decrease if production expanded into marginal areas. The average yield decrease in this case results from the fact that land is not a homogenous input. However, it is not straightforward to sort out how land characteristics and other aspects of location affect productivity. |
| Group | Maize | Wheat | Rice | Soybeans | ||||
| 1961 -90 |
1990 -07 |
1961 -90 |
1990 -07 |
1961 -90 |
1990 -07 |
1961 -90 |
1990 -07 |
|
| Global yield growth rates (% per year) | ||||||||
| World | 2.20 | 1.77 | 2.95 | 0.51 | 2.19 | 0.96 | 1.79 | 1.08 |
| Low Income Countries |
1.07 | 0.65 | 1.32 | 2.15 | 1.46 | 2.16 | 2.63 | 0.00 |
| Middle Income Countries |
2.39 | 2.10 | 3.22 | 0.82 | 2.54 | 0.81 | 3.21 | 2.08 |
|
Lower-Middle
|
3.51 | 1.79 | 4.30 | 1.63 | 2.62 | 0.69 | 2.57 | 0.66 |
|
Upper-Middle
|
1.35 | 2.58 | 2.63 | -0.25 | 1.18 | 2.98 | 3.39 | 2.41 |
| High Income Countries |
2.34 | 1.48 | 2.47 | 0.06 | 1.07 | 0.54 | 1.14 | 0.02 |
Source: The yield data used to calculate growth rates are from the FAOSTAT database (FAO, extracted June 2009), with some adjustments by the authors.
Notes: Low-income countries are those with 2008 per-capita gross national income (GNI) of $975 or less, high-income countries are those with a per-capita GNI greater than $11,905 and middle-income countries are those with per-capita GNIs that fall between these values in line with World Bank practice. Middle income countries are further subdivided into lower-middle and upper-middle depending on whether their per-capita GNI is above or below $3,855.
| Group | Land Productivity | Labor Productivity | ||
| 1961-90 | 1990-05 | 1961-90 | 1990-05 | |
| Growth rates (% per year) | ||||
| World | 2.03 | 1.82 | 1.12 | 1.36 |
|
excl. China
|
1.90 | 1.19 | 1.21 | 0.42 |
|
excl. China & FSU
|
1.91 | 1.57 | 1.13 | 0.73 |
| Latin America | 2.07 | 2.71 | 2.11 | 3.38 |
|
excl. Brazil
|
2.09 | 2.21 | 1.51 | 2.10 |
| Asia | 2.56 | 3.01 | 1.83 | 2.72 |
|
excl. China
|
2.45 | 1.83 | 1.69 | 1.24 |
| China | 2.81 | 4.50 | 2.29 | 4.45 |
| Africa | 2.18 | 2.21 | 0.68 | 0.90 |
| Low Income Countries | 2.00 | 2.39 | 0.46 | 1.03 |
| Middle Income Countries | 2.35 | 2.30 | 1.51 | 2.02 |
|
excl. China
|
2.18 | 1.37 | 0.39 | 0.81 |
| High Income Countries | 1.61 | 0.72 | 4.26 | 4.18 |
|
Malthus Misery "Famine seems to be the last, the most dreadful resource of nature. The power of population is so superior to the power in the earth to produce subsistence for man that premature death must in some shape or other visit the human race. The vices of mankind are active and able ministers of depopulation. …should they fail in this war of extermination, sickly seasons, epidemics, pestilence and plague, advance in terrific array, and sweep off their thousands and ten thousands. Should success be still incomplete, gigantic inevitable famine stalks in the rear, and with one mighty blow levels the population with the food of the world." Thomas Malthus. An Essay on the Principle of Population 1798 (1st edition, end of Chapter 7). Contemporary Pessimists and Optimists The Malthusian notions that growth in population, and the demand for food, will eventually outrun the world’s capacity to feed mankind have endured in various guises for centuries. In The Population Bomb published in 1968, the eminent ecologist, Paul Ehrlich, predicted that in the 1970s “… the world will undergo famines—hundreds of millions of people are going to starve to death in spite of any crash programs embarked upon now. At this late date nothing can prevent a substantial increase in the world death rate … (p. xi).” William and Paul Paddock’s 1967 Famine 1975! America’s Decision: Who Will Survive? had a similar message. They advocated a triage approach to foreign aid, in which countries in need of food aid should be divided into three groups, as are soldiers injured in battle. The “can’t be saved” group, which should receive no aid, included India and the Philippines, both of which have since had years of food surplus from their own harvests. Biologist Garrett Hardin, famous for coining the term "The Tragedy of the Commons" to describe the very real problems that can arise when there is open access to exploitation of a natural resource, published The Limits of Altruism in 1977 in support of a “tough-minded” approach that recognized that countries like India had exceeded their “carrying” capacity.
Relative to past performance, the claims by Monsanto and DuPont about potential yield gains seem very optimistic. The claims imply a sustained 10-20 year compound growth rate of about 3.4% per year, a rarity in recent history. In the United States, the rates of yield gain realized in farmers fields would have to match the highest ever, as recorded in the 1960s and 1970s, and recent yield growth rates have not been nearly so fast. Further, average growth in crop yields for maize, wheat, rice, and soybeans never exceeded the 3.4% per year threshold for any decade period ending after 1990. While it is feasible to sustain growth rates that would achieve the Monsanto and Du Pont targets, the future must be substantially different from the recent past if these goals are to be accomplished. |
The work for this project was partly supported by the University of California, the University of Minnesota, the Giannini Foundation of Agricultural Economics, the Bill and Melinda Gates Foundation, and the USDA’s Economic Research Service, Agricultural Research Service, and CSREES National Research Initiative.