The growth and modernization of China’s livestock industry has rocked global soybean markets in recent years and many expect a similar impact on world corn markets in coming years. Despite the importance, there is a dearth of verifiable information of the underlying supply and demand of meat and feed ingredients in China to make such forecasts. Moreover, China seeks the conflicting goals of maintaining high prices for corn to encourage production and developing a competitive and modern livestock industry, all the while embracing market mechanisms. How China addresses these conflicting objectives will impact the feed and livestock industry in China and around the world.
Information available to construct a rough supply and demand framework for meat and feed ingredients in China indicate that there is still room for animal product consumption to grow in China. However, whether the additional demand will be met by increasing domestic production or by importing meat and other animal products will depend, partially on whether China can improve production efficiency and if it can effectively address the environmental consequences of greater animal production in large, modern, and more efficient operations. If so, China will likely turn to global markets to procure sufficient feed grains to meet the growing demand as corn production is expected to grow more slowly than feed grain consumption.
There is no question that China’s feed and livestock industry has undergone enormous transformation since economic reforms were established in the late 1970s. In the 1980s, nearly all livestock production took place on small farms, termed “backyard” production, and livestock feed was locally procured without much thought about feed efficiency. The development of the feed and livestock industry was targeted by policy makers early on, and according to official statistics, China today is the world’s largest commercial livestock feed producer and has become the world’s largest producer of pork, eggs, and aquaculture products, second largest producer of poultry meat, and a growing producer of other livestock products. Moreover, a significant and growing share of China’s feed and livestock production occurs in large, modern operations.
Aside from this general sense of the big picture, a more careful understanding of the underlying supply and demand of feed and livestock products is elusive. Taking pork as a primary example, official production statistics report that China produces more than half of all the pork in the world in recent years, slaughtering 715.6 million hogs to produce 54.9 million metric tons (mmt) of pork in 2013, or about 40.7 kg/capita (assuming population is 1.35 billion). Other official figures, however, suggest that actual pork production in China is much lower than this. For example, official consumption estimates report that urban residents consumed 21.2 kg/year of pork in 2012—the last year consumption statistics are available—and their rural counterparts consumed 14.4 kg that year. Since China is roughly half rural and half urban, these estimates imply consumption of only 17.8 kg/year per capita consumption, or a total of 24 mmt of pork, over 30 mmt below the official production number for 2013. The discrepancy between official consumption and production estimates also holds true for other livestock products, such as eggs and dairy.
One well-known issue with China’s official consumption statistics is that they do not include food consumed away from home, and are also believed to under report at home food consumption. Recent independent surveys of urban households conclude that excluding meat consumed away from home and underreporting results in estimates as much as 40% below actual levels (Bai et al., 2013), so the true urban number could be as high as 35 kg/capita. While consumption away from home is likely lower for rural households, the household survey estimate very plausibly is 30% below actual consumption, indicating rural consumption could be roughly 20 kg/capita. This results in average per capita pork consumption of 27.5 kg, or total pork consumption of 37.1 mmt, which is still far below the official production number of 54.9 mmt in 2013.
Other evidence corroborates the finding from consumption statistics that China is actually producing far less pork than official production statistics indicate. Beginning in 2009, China’s Ministry of Commerce began collecting monthly statistics on hog slaughter and they indicate far lower slaughter levels than official statistics. In 2013, the monthly slaughter numbers—the responsibility for which transitioned to the Ministry of Agriculture that year—summed to 233 million head, and although these estimates do not include the thousands of smaller slaughter facilities, even if they represent just half the total slaughter, that would sum to 466 million head or around 36 mmt of pork production. Using farm household production data from China’s Research Center for Rural Economy, under the Ministry of Agriculture, Yu and Abler (2013) also estimate China’s pork production in 2009 at 35.4 mmt.
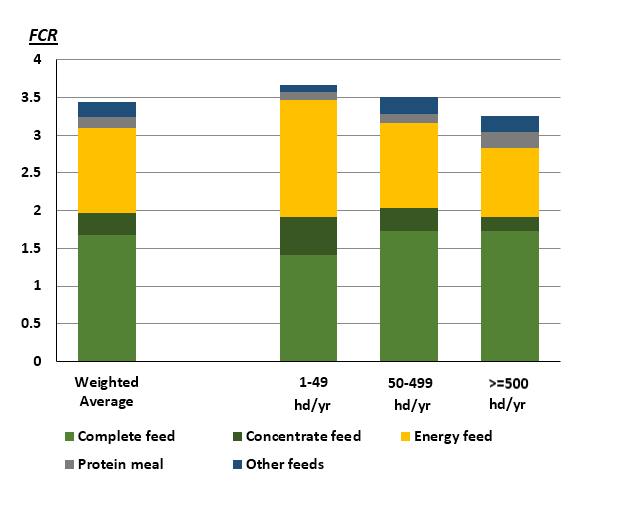
China’s total pork, and other animal product, production has obvious implications for feed demand. However, the key link to this is the feed conversion ratio (FCR), a measure of efficiency that relates live weight gain to total feed consumed, but there is little information on how efficient China’s swine producers are. A recent survey of village-level swine producers by the Center for Chinese Agricultural Policy (CCAP) indicates that larger producers are more efficient than smaller producers, and the weighted average FCR in their sample of village-level producers is 3.49, or 3.49 kg feed for one kg weight gain (Figure 1). If we assume the village level operations represent 80% of production and larger, more modern operations outside villages achieve an FCR of 3, then this suggests the China-wide FCR is about 3.4 Add to this the feed for the sows that produce the piglets, say 0.65/marketed hog, and this raises the total feed per kg of a market hog to 4.05. Then say 75% of market hog weight is actually meat, and the feed-to-meat conversion rises to 5.4. If it takes 5.4 kg of feed to produce one kg of pork, and China’s total pork production is 35 mmt, then that suggests total pork feed is 189 mmt.
This estimate of swine feed consumption is based on many assumptions, particularly that China’s actual pork production is well below the official production number. However, as argued below, it is difficult to see how pork production and feed demand could be any more than this.
How does this number fit with estimates of China’s total feed supply? The China Feed Industry Association (CFIA) reports estimates of commercial production of complete feed (also called compound feed), concentrate feed, and feed premix for swine, layers, broilers, aquaculture products, ruminants, and other. Again, taking swine as an example, for 2013 these estimates are 66.3 mmt of complete feed, 14.1 mmt of concentrate feed, and 3.75 mmt of pre-mix feed, for a total of 84.1 mmt of commercial swine feed production.
These estimates, however, understate implied total feed produced and used. While complete feed is used as is, concentrate feed is mixed with grains and feed premix is combined with grains and protein meals to generate final feed formulations. Concentrate feed is typically mixed at a ratio of 1 part concentrate to 3 parts grain for swine rations—concentrate feed comprising 25% of total feed—while feed premixes typically comprise around 5% of total feed. Some of the feed premix produced is sold to other feed mills and included in their complete and concentrate feed so is double-counted, and we assume the share of premix double-counted is 20%. Using these relationships, we can estimate the total implied swine feed from the CFIA commercial feed production estimates at 182.6 mmt in 2013, or 6.4 mmt below the estimate reached (by multiplying the 35 mmt production estimate by a 5.4 feed-to-meat conversion). Similar analysis of commercial layer and broiler feed production estimates indicate each sector uses just above 60 mmt of feed, with aqua and ruminants using around 20 mmt each, and “other,” such as, rabbits and mink, around 5 mmt, for a total implied feed supply estimate of just below 350 mmt. Since many large livestock operations procure their own feed ingredients and mix their own feed rations, therefore do not purchase commercially-produced feed, the actual total feed production estimate is likely higher than the 350 mmt estimate above.
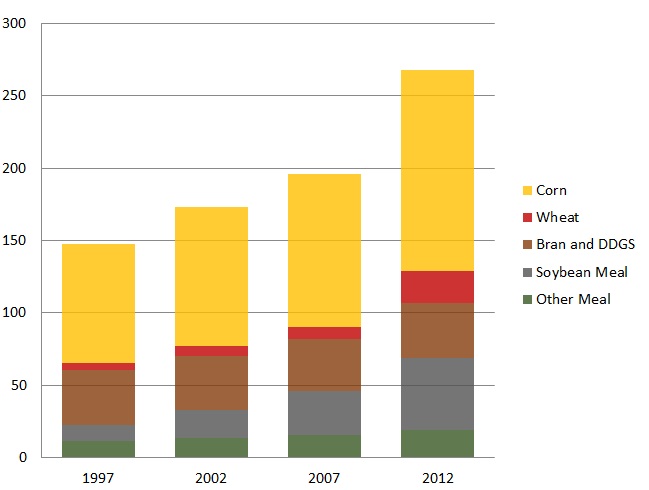
Dig down deeper to understand what ingredients are used in this feed and it becomes very difficult to determine where all this feed is coming from. Animal feed is comprised primarily of protein meals and energy feed. Figure 2 shows estimates of the feed demand for the following ingredients from 1997-2012: Soybean meal, other protein meals—primarily rapeseed, cotton seed, and fish meal, adjusted for 44% protein equivalence —distillers grains with solubles (DDGS)—wheat bran, rice bran, wheat, and corn. These estimates are based on the U.S. Department of Agriculture (USDA) Foreign Agricultural Service's Production, Supply and Distribution (PSD) online database for corn, derived from USDA PSD milling estimates for wheat and rice bran and USDA PSD rapeseed and cotton production estimates for rapeseed and cottonseed meals, and the author’s own DDGS, fishmeal, and wheat feed use estimates. These estimates are very much in line with estimates used by industry and government analysts inside and outside of China.
The estimates in Figure 2 indicate that total feed use in China in 2012 was only 267.7 mmt, far below the 350 mmt estimated by looking at commercial feed production. Under these estimates, feed use grew at a cumulative annual rate of 4% over the period 1997-2012, with protein meal growing faster at 7.8% annually, mostly from soybeans, soybean meal use grew by over 10% a year. The more rapid growth in protein meal resulted in protein meal inclusion in animal feed rations expanding from 15% of all feed in 1997, to over 25% in 2012. Energy feed grew more slowly, only 3.1% annual rate, with corn growing at a somewhat faster rate of 3.5%. Despite a 4% growth rate; however, the 267.7 mmt estimate seems to be well below what would be required to feed all the pigs, chickens, cows, sheep, and all the various aquaculture critters in China.
Many argue that food waste comprises a large share of animal feed in China. While that may have been true when animal production was predominantly backyard, there is little evidence that it is true today. For example, very few of the producers, even the very small ones, in the CCAP survey reported using recycled food for feed. One reason is that consumers in China do not waste as much as people might think, particularly in households, although more waste occurs in restaurants. Another reason is that China’s increasingly modern animal production practices seek out feed ingredients with relatively consistent levels of energy, protein, and other nutrients, and this is difficult to achieve with food waste. The third reason is that there is simply not that much food to go around. Food waste, by dry weight, is almost entirely spent rice and wheat products–fruit, vegetables, and meat are far less likely to be disposed of and, when calculated by dry weight, do not add up to much. China consumes about 140 mmt of milled rice and 70 mmt of milled wheat annually, resulting in about 210 mmt of food grain consumed in a year. If 20% of this is disposed of and recycled as animal feed, then that would imply around 40 mmt of feed. This estimate is fairly liberal, yet it still falls short of making up the gap between the estimates of individual feed ingredient use, and total feed use implied by commercial feed production and animal feed demand.
The point of all this is that China’s official production and consumption estimates for livestock products are far apart and one must go through substantial gymnastics to arrive at estimates that are reasonable in themselves and reasonably close to each other. Moreover, even an estimate that assumes meat production is much lower than official production estimates is well beyond the individual estimates of feed use for specific ingredients such as corn and soybean meal. For a country that puts such emphasis on not only development of the livestock industry but also on maintaining feed grain production growth to meet domestic demand, it is somewhat surprising that there are no real reliable estimates of livestock production, feed demand or demand for important feed ingredients such as corn. Or at least the estimates that do exist, do not seem to match each other.
But there are two key conclusions that we can draw from the above analysis thus far. One is that meat consumption in China is very likely well below the official production numbers and there is substantial room for continued expansion of meat consumption in China. The other is that as protein meal inclusion rises to levels that optimize efficiency, then the trend of protein meal growth outstripping energy feed growth that has been in place over the past 15 years will slow and growth in both energy feed and protein meal will converge to the growth rate of total feed. For energy feed, this means an acceleration of growth vis-à-vis total feed demand growth. Since production of bran is based on food grain consumption, which is not growing in China, nor is production of DDGS, we can assume that nearly all of any future increases in energy feed consumption will come from corn and other feed grains.
China’s soybean imports skyrocketed over the last two decades not only because consumption of livestock products grew and livestock producers increased the share of protein meal in their rations, but also because policymakers in China adopted a policy of 95% self-sufficiency for grains in 1995. At that time, policymakers debated whether corn and soybeans should be included in the definition of grains or whether the policy should apply only to “food grains,” namely rice and wheat. In the end, corn was included in the 95% self-sufficiency policy, but soybeans, formerly considered a grain as well, were not.
This decision had significant implications for food consumers in China as well as world commodity markets. In the ensuing two decades, a large oilseed crushing industry developed along China’s coast supplied entirely by imported soybeans. Soybean imports rose from nothing in the first half of the 1990s to 70 mmt of soybeans in 2014, or more than half of all soybeans traded on global markets. Livestock producers and food consumers in China benefitted significantly by the decision to procure soybeans from global markets. The protein meal from imported soybeans helped facilitate the modernization of livestock production in China, including greater protein meal inclusion in livestock diets which led to more rapid animal growth rates and improved production efficiency. The policy also resulted in more abundant supplies of, and therefore lower prices for, edible oil in China. More abundant and lower-priced supplies of these staples of China’s diet, pork, poultry, eggs, and edible oil, allowed far more low-income consumers to improve their diet than would have occurred if soybeans had been kept under a self-sufficiency policy.
| Cummulative Annual Growth Rates (percent) | ||||||
| 1993 | 2003 | 2013 | 1994-2004 | 2004-2014 | 1994-2014 | |
| Area (mha) | 21.0 | 24.7 | 36.1 | 1.7% | 3.9% | 2.8% |
| Yield (mt/ha) | 4.73 | 4.95 | 5.90 | 0.5% | 1.8% | 1.1% |
| Production (mmt) | 99.1 | 122.4 | 213.2 | 2.1% | 5.7% | 3.9% |
| Area growth share of production growth | --- | --- | --- | 81.0% | 68.4% | 71.8% |
The other significant effect of this policy was the growth in China’s domestic corn production, over 70% of which was due to expanded sown area rather than yield growth. According to official statistics, China’s corn production rose from 99 mmt in 1993 to 213 mmt in 2013, a cumulative annual average growth rate of 3.9% (Table 1). Production growth came from increasing area sown to corn, from 21million hectares (mha) to over 36 mha over the 1993-2013 period, and also from rising corn yields, from 4.73 to 5.9 metric tons per hectare(MT/ha) over the period. Calculating cumulative annual growth rates (CAGR) for area and yield reveals that of the 3.9% growth in corn production over the period, 2.8% of that was from expanded sown area while only 1.1% was from yield growth. Thus, by China’s official estimates, 71.8% of the growth in corn production over that period came from expanded corn area.
The 15 mha expansion in corn sown area over the period 1993-2013 is not only significant, but it is not clear where this land came from. Over the period 1993-2013, China’s official statistics report that sown area in China for soybeans, millet, sorghum, and cotton—all major competing crops for corn—declined by a total of 5.3 mha over the period, while peanut area, also competing with corn, grew by 1.3 mha. Therefore, the total decline is only 4 mha, which is well below the 15 mha expansion in corn sown area. Also over the period, wheat sown area fell by 6.4 mha. However, this reflects a decline of 8.2 mha between 1993 and 2003, when corn area rose by only 3.7 mha, but then wheat area actually expanded by 2.1 mha in the subsequent decade 2003-2013, while corn area also expanded by 11.4 mha. Moreover, while some of the reduced wheat area was due to spring wheat production in Northeast China switching to corn, most wheat area is winter wheat in North China which is double-cropped with corn sown after the wheat harvest in June, thereby does not directly compete with corn for land. There has been a few million hectares in grassland reduction, and also some crops, such as cotton, have seen acreage reduced on the North China Plain, where it competes for corn, and expand into western China (also onto former grassland). Given that urbanization and rising incomes have increased demand for fruit and vegetables, it is not likely that additional land for corn came from declining sown area of these products, and urbanization also directly competes with agriculture for land.
Because China already exploits nearly all the land available for agricultural production, and competition for land by higher-valuing non-agricultural uses is fierce, it is reasonable to expect that future corn production growth in China will most likely come more from yield growth than from continued expansion of sown area, but achieving this yield growth may prove more difficult than it appears at first glance.
Many observers point out that the corn yields in China are around 60% of the yields in the United States and therefore conclude that there is significant room for yield growth and higher yields can be easily achieved. Unpublished estimates of corn yields in China by the U.S. Grains Council over the last several years, however, indicate that corn yields could be as high as 7.5 to 8 MT/ha, or more than 25% higher than China’s official estimate in 2013. In addition, a large share of the yield difference comes from lower plant populations, which hover around 22 thousand plants per acre in China, compared to 30 thousand or greater in the United States, or more than 25% higher than in China. Despite the lower plant density, corn ears in China often show signs of “tip back”, where the last few rows of kernels at the very tip of the ear do not develop. Tip back is an indication that the plant population is maximized to fully utilize the nutrient availability in the soil. Under these circumstances, it will be difficult to increase the plant population to boost yields without changing agricultural practices and improving the underlying soil productivity.
China’s unique land tenure system, which results in very fragmented land holdings, will slow the adoption of agricultural practices that improve the soil. Recent research on soil fertility in China indicate that China’s soil suffers from fertility issues such as salinity, acidity, low levels of organic matter, and—in some areas—heavy metal contamination. This can all be reversed, but restoring soil fertility will take time and investment. Farmers in China till such small plots, however, that the incentives to make these investments are weak. Farm households are much better off allocating time and energy to non-farm employment or more lucrative farm activities such as cash crops or livestock production, than activities that may improve corn yields somewhat in future years. China seeks to increase farm size and this is occurring, but the extent of fragmentation is so extreme that it will take many years before a significant amount of land is cultivated in tracts large enough for farmers to face sufficient incentives to make the long-term investment in soil fertility improvement.
Given that the expansion of corn sown area will likely slow, and yield growth will not likely increase appreciably, it seems that corn production growth in China will slow in coming years. Meanwhile, as protein meal inclusion growth begins to slow and converge with overall feed growth, demand for energy feeds will do the opposite. Energy feed growth can be expected to rise to converge to overall feed demand growth, and the additional energy feed will likely come from corn or other feed grains. Together, these two trends will cause corn import demand to grow, especially if demand growth for animal products remains robust.
China is currently undergoing a transition to a new model of economic growth and development. The new model emphasizes domestic consumption, so while overall gross domestic product (GDP) growth will slow, consumption growth is expected to remain robust. In particular, the new model seeks to boost income growth and economic stability for the lower tiers of the income distribution and these consumers that have the highest marginal propensity for increasing animal protein consumption as their incomes increase. Thus while China’s GDP growth is expected to slow, growth in the consumption of animal proteins is expected to not slow by nearly as much, and as argued above, there appears to be much room to expand animal consumption growth.
China’s new development model also puts more emphasis on markets to determine resource allocation. Indeed, China’s food security strategy unveiled in late 2013 specifically excludes corn from the 95% self-sufficiency that has guided corn policy for the last two decades, but the new policy will take time to implement. In 2008, China sought to support corn prices by purchasing corn at a minimum price in the northeast, China’s largest corn producing region, and increased the minimum price in 2010, 2011, 2012, and 2013. However, with the bumper U.S. corn crops in 2013 and 2014, after 3 years of drought, global corn prices have fallen significantly. China’s price support policy results in high domestic corn prices vis-à-vis global markets, and the prices are additionally protected by a tariff-rate quota (TRQ) on corn allowing only 7.2 mmt of imports before prohibitively high tariffs kick in, and only 2.88 mmt of that is allocated to private users, the rest is controlled by state-owned enterprises who may or may not use it. These high prices not only make it more difficult for livestock producers in China to compete with producers in other countries that enjoy the low global prices, but are also causing corn production to continue expanding while demand for corn slows as livestock producers seek alternatives to high-priced corn to include in feed rations. Thus, China’s government is holding onto increasingly large, high-priced corn stocks while world corn supplies are also increasing and prices are low. China is experimenting with liberalizing similar policies for soybeans and cotton in 2014, and while this will help resolve distortions in those markets, maintaining high-price policies for corn may cause corn area to expand even further as cotton and soybean prices soften.
Whether China decides to import corn to support domestic livestock production rather than import the livestock products directly, will depend in part on how China resolves the current situation of large, expensive stocks and transitions to a policy that allows corn prices to converge closer to import parity. However, it will also depend on whether China’s producers can improve efficiency and also whether they can reduce some of the environmental impacts of large livestock operations. Livestock producers in China are increasingly efficient, but the industries, in aggregate, are still not as efficient as more developed industries in many of China’s trading partners, who also currently have the additional advantage of low corn prices.
The most critical threat to the continued expansion and modernization of livestock production in China, however, may turn out to be the environmental consequences of large, modern operations. An environmental census carried out in the last decade concluded that nearly half of the water pollution in China—on a chemical oxygen demand (COD) basis—was due to emissions from livestock production. This led to a series of environmental regulations that recommend treating these emissions rather than using them as a substitute for chemical fertilizer. These policies further raise the costs of livestock production in China. The findings led several prominent specialists to argue that China should procure additional livestock products from other countries that have more land and water resources to support production. Indeed, other Asian neighbors that have higher incomes but also have high population densities and limited land and water resources tend to import a far higher share of livestock products than does China, yet also import grains to support domestic production.
China has made enormous achievements in building a robust and modern livestock industry and can be expected to continue supporting the development of this industry. This will likely, ultimately, lead to policies that liberalize corn imports and cause corn prices to converge toward import parity levels, which in turn will increase corn demand as livestock producers switch back to corn. But the continued consolidation of the industry into larger and more modern operations that can compete with producers in other countries will be slowed as they learn to adjust to the external costs of handling livestock emissions in ways that reduce environmental degradation. Thus, as demand for animal products continues to grow, and the industry continues to modernize and adjust to new realities, we will likely see imports of both feed products and animal products rise, with corn being a key component of these trends.
Bai, J., J. Seale Jr., T. Wahl, and B. Lohmar. 2013. "Meat Demand Analysis in Urban China: To Include or Not to Include Meat Away from Home?" Selected Paper presented at the 2013 AAEA & CAES Joint Annual Meeting, Washington DC.
Yu, X., and D. Abler. 2014. "Where Have All the Pigs Gone? Inconsistencies in Pork Statistics in China." China Economic Review, 30:469-484.

