Dairy farmers across the United States are dealing with financial stress from several consecutive years of low farm milk prices. Farm stress has been exacerbated in traditional dairy-producing regions in the Midwest and Northeast by a relative lack of dairy-processing capacity, which has led to disappearing farm premiums, increased milk hauling and marketing costs, and—in some periods—dumping milk that has no better marketing outlet.
Federal Milk Marketing Orders were created in the 1930s to ensure an adequate supply of fluid-quality milk production and encourage transport to deficit regions. Orders regulate farm-level markets for milk primarily through a complex system of minimum prices applied to the buyers of farm milk according to the products manufactured. Four classes of milk are defined by the end use: Class I relates to milk beverages; Class II includes milk used for value-added soft dairy products such as yogurt and ice cream; Class III is for milk used to make cheese and whey; and Class IV is butter, non-fat dry milk, and other skim milk products. Minimum prices that processors must pay for each of these product classes are derived from wholesale product prices adjusted for yield and manufacturing costs. Farmers, or their marketing cooperatives, must receive a weighted average of these four prices, with adjustments for milk composition.
One key justification for Federal Milk Marketing Orders was to promote “orderly marketing” and stability in farm prices through efficient distribution and utilization of milk. This article examines the current state of U.S. milk marketing, focusing on states and regions experiencing milk marketing issues.
Four innate characteristics of milk production and dairy farming make marketing a unique challenge: i) daily harvesting, ii) perishability, iii) bulkiness, and iv) asset fixity.
Milk is produced and harvested every day of the year. Add to this the challenge of perishability and you get a product that must be sold and delivered at least every other day. Indeed, for very large farms it is not unusual to begin the transportation process just after milk is cooled following each milking, which may be three times each day.
Just as perishability negates real-time opportunities for farmers to explore marketing options, the bulkiness of milk limits farmers’ ability to explore alternative customers. While dairy markets are widely recognized as being national—or even international—in terms of price discovery, this does not mean that individual farmers have realistic marketing opportunities outside of a day’s truck drive.
This relative lack of storability and transportability creates an urgency in milk marketing that is far different from, for example, grain growers, who harvest their product over a small window of time but can realistically market that product over the ensuing year.
The last marketing challenge is created by asset fixity. Many of a dairy farm’s productive assets—beginning with the cow but including milking parlors, cow barns, calf hutches, and so on—have little salvage value outside of dairy farming. Thus, dairy farmers face a commitment to milking cows that results in a supply that is not easy to turn off and seldom economic to dial back, while at the same time creating a marketing environment that has high search costs with narrow feasible opportunities.
A good deal of the milk marketing system, including government price regulation, has evolved to mitigate the economic ramifications of milk and milk production characteristics. One of these system attributes is cooperative marketing. Another is government-enforced classified pricing and pooling, realized through the Federal Milk Marketing Order system.[1]
For over 100 years, an overwhelming majority of dairy farmers have chosen to market their milk through cooperatives. Today, cooperatives handle about 82% of the milk produced in the United States, with about two-thirds of U.S. production marketed through cooperatives that also have their own dairy processing operations (Liebrand, 2012). A distinctive feature of cooperative marketing is that farmers do not contract the sale of a certain amount of milk at a certain price at a certain time or period; rather farmers enter a membership agreement in which they agree to certain dues or other financial commitments in exchange for a guaranteed milk market and a promise to achieve the highest return possible, with a time commitment that is often—for all practical purposes—indefinite.
Price regulation, in particular classified pricing and pooling, has become a critical and defining feature of milk markets and the economic coordination mechanisms that keep them in balance. Classified pricing is a price discrimination mechanism that charges different levels of minimum farm prices for milk based on the demand characteristics of a customer’s downstream product sector. The logic of the system is essentially to charge the highest prices in the most demand-inelastic product markets—beverage milk products in particular—and let the overall market for farm milk clear in its lowest valued, more elastic uses. Although other product sectors can play a role, plants producing butter and non-fat dry milk—butter/powder plants—are generally recognized as the primary agents for market clearing functions. It is also the case that dairy cooperatives produce and market 75% or more of the U.S. production of these two basic commodities (Liebrand, 2012).
Coordinating daily, seasonal, and cyclical milk production with demand has always been a role and particular challenge for dairy cooperatives. Although milk production in the aggregate is predictable, small changes in volume can have potent price effects. Moreover, changes in consumption are seldom aligned with the natural dynamics of milk production.
Cows tend to produce more milk in the spring, following a natural calving cycle and the availability of fresh forages. Sales of dairy products have several seasonal patterns. For example, butter and cheese consumption peak during the winter holiday season, while beverage milk consumption is heavily influenced by school calendars. Matching production and usage over the course of a year is referred to as seasonal balancing. Milk is produced daily, but not all processing facilities operate every day. Often there is a planned shut-down for a weekend or holiday. Sometimes weather or a mechanical event causes an unplanned shut-down. This puts the onus on cooperatives to do what is called daily balancing, and it is one of the reasons why cooperatives became processors of simple, storable commodities such as butter and milk powder. Cyclical balancing is driven by the need to expand processing capacity to accommodate milk production growth and, particularly, deviations from longer-term trends.
In recent years, dairy markets in many states have been unusually roiled by a severe form of market coordination failure that has resulted in significant dumping of milk that cannot find a profitable outlet on a particular day in a particular location. The causes of this are rooted in i) the market economics of this period, ii) a failure of the regulatory system, and iii) an unintended consequence of the seemingly unlimited cooperative guarantee of market security.
Source: U.S. Department of Agriculture (2016).
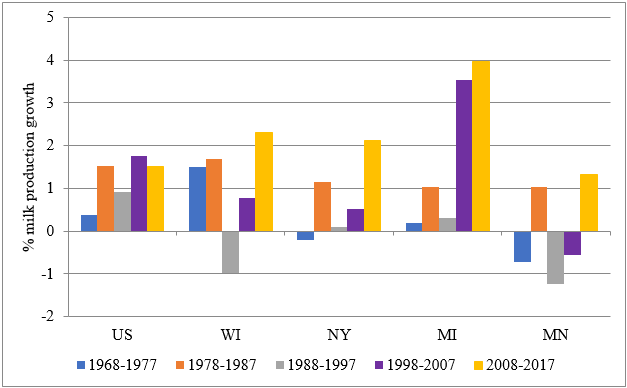
A number of factors led to higher-than-trend growth in the traditional milk production areas around the Great Lakes in the last 10 years. During this period, prices for corn and other grains and oilseeds settled into a new, higher equilibrium following the stimulus of ethanol mandates; at the same time, milk prices gained altitude in response to those increased grain prices. The result of this inelegant economic dynamic was a greater-than-normal increase in milk production, especially in areas where the dominant dairy farming system used primarily homegrown feeds. Figure 1 displays the average annual growth in milk production over a 50-year period from 1968 through 2017, in decade increments. Milk production growth in “traditional” dairy states in the Midwest and Northeast languished for several decades and was then followed in the last decade by a revitalization of the milk production growth rate. Michigan milk production in particular grew at a rate more than twice the U.S. average for the past couple of decades.
The past decade also coincides with competitive market conditions that have resulted in rather severe reductions in per capita sales of beverage milk products, which represent both the highest valued use and a large share of total milk sales. It also is a period during which the United States enjoyed considerable success in gaining shares of foreign markets, but these markets are inherently more volatile than domestic markets (Yonkers, 2011), resulting in ups and downs in sales opportunities that further challenge the market-balancing responsibilities of cooperatives.
Lastly, there has been a failure to make changes to federal order pricing formulae that might have encouraged investment in milk-processing facilities to encourage processing capacity would keep pace with production growth. Since 2000, federal order class prices have been calculated by adjusting wholesale prices for four basic dairy commodities (butter, powder, cheese, and dry whey), which represent about half of U.S. dairy product processing. The adjustments use average yields and costs of processing to determine a price for farm milk that processors of those Class III and IV products should be able to afford given their output prices. Any system that attributes a single value to the prices received or paid by the heterogeneous network of dairy processors across the United States makes several bold assumptions. The logic of this system was based on the fact that class prices are minimums, meaning that processors can pay higher prices if firm economics or market conditions warrant. As is always the case, the risk with minimum prices lies in setting them too high. This can occur when the processing-cost factors used in the class price formulae, the so-called make allowances, are too low. Make allowances are fixed by regulation and cannot be changed except upon significant evidence presented at a formal administrative hearing, then accepted by the U.S. Department of Agriculture and ultimately approved by the dairy farmers who fall under its regulation. Current make allowances were established in 2007. Increases in the prices of processing inputs increase manufacturing costs, whereas improvements in productivity lower costs. Although the evidence tends to be anecdotal, it appears that in the last 10 years, increases in input prices have been the dominant factor. This is also supported by statements of manufacturers that it is unprofitable to invest in new or improved facilities. Producers certainly have made and continue to make investments in new plants and plant renovations, but it is also equally clear that processing capacity is stretched and at times overmatched by milk production.
The lack of adequate dairy-processing capacity is demonstrated by the increased frequency of milk dumping, especially in the Northeast and Mideast order areas. Often referred to as “dump” or “dumped” milk, this situation occurs in small amounts normally for a variety of reasons. If a farmer inadvertently includes milk from a cow that has been treated with antibiotics, it will be discovered, but perhaps not before it contaminates the daily milk delivery, the truck tank on which the farm’s milk was loaded, or even the plant silo into which the tank was pumped. In this case, all the contaminated milk is disqualified from use, but the federal order will allow it to be priced at the lowest use class and included in the pool pricing calculations for all milk. Plants that receive contaminated milk will identify the source and stiff penalties will typically apply, including recovery of the cost of all milk that was ultimately contaminated, but this is a separate transaction from the order blend price calculation. Other common examples of dump milk include pick-up vehicle accidents, weather events that prevent timely pick-up, and plant closures due to maintenance or other events. This sort of thing is generally recognized as normal and part of the cost of doing business.
Classified pricing assigns prices to producer milk based on its end use. When milk cannot be used by a dairy processor but otherwise qualifies as milk associated with the order, it is assigned to the “lowest use class.” Meaning this dumped milk will have a value equal to the lowest class price for the applicable month, which is usually Class III or Class IV. This allows such milk to be counted as “delivered” and subject to the pooling provisions of the order. Farmers who produce milk that is assigned to the lowest use class remain eligible to receive the blend price for that order.
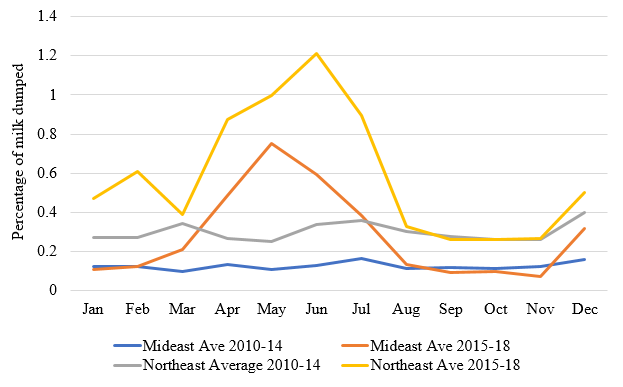
The phenomenon of milk dumping is illustrated in Figure 2 using data from the Northeast (NY, VT, NH, MA, CT, RI, NJ, PA, DE, MD, and VA) and Mideast (MI, IN, OH, portions of PA, KY, and WV) orders, which have had the highest amounts of dumping in recent years. The average share of milk dumped monthly from 2010 to 2014 is compared to the average amount of milk dumped from 2015 to 2018. As the figure reveals, the typical percentage of milk dumped is 0.1% to 0.15% in the Mideast, but in recent years has spiked to as much as 0.75%. Similarly, the average in the Northeast order was 0.2% to 0.3% but has often averaged two to five times that level in the past 4 years.
Dumping at the levels observed in the Northeast and Mideast orders is unusual, but the phenomenon referred to as “distressed” milk sales is not. Dumping is the extreme case of farm milk not being able to find a customer at a price that yields a positive return above the direct cost of delivery. More common is the situation in which a cooperative finds it has milk it cannot market to its normal customers, so it offers it for sale at a discounted price, usually deeply discounted to half or less of the applicable minimum price. Sometimes the discounted sale can be made to a regular customer, but often the milk must be moved to a nearby region, typically taken by another cooperative. Because this milk is delivered and sold, even at a discount, it is not accounted for separately by federal orders.[2] Thus, we have no public information on the volumes of distressed milk sales. The high-water mark for dumped milk in the last few years may be a reasonable measure of a typical volume of distressed milk sales.
Several explanations have been offered for the recent, unusually large levels of milk dumping. Above-trend increases in production are assuredly the beginning of an explanation. The rather dramatic decline in Class I sales in the Northeast in particular is also a major contributing factor, as some fluid plants have closed altogether and others have reduced purchases. This has left farm suppliers without a market and put cooperatives in the position of attempting to fulfill their guarantee of a market outlet with no available, profitable outlet. When the next best available outlet is too distant to justify shipment, milk is disposed of, usually dumped in farm manure handling systems. All milk that is produced by a cooperative member receives a price. However, when milk dumping occurs cooperatives are forced to “re-blend” the payments for the 98% of milk actually sold across 100% of the milk they buy this results in a price paid to farmers that is often below the minimum blend price announced by the order.
Michigan, part of the Mideast order, has been averaging farm milk prices of $1–$1.50/cwt below their historic relationship to U.S. and surrounding state prices. In the past couple of years Michigan farm milk prices have been among the lowest in the United States. The resulting financial stress has increased the exit of dairy farms and recently, in 2018, resulted in slowing state milk production. In New York, which is in the Northeast order, some farmers have been left without any market alternative and have exited. For other farmers, it was more or less business as usual, although with lower or no market premiums. Members of the cooperative that were left with the primary chore of balancing the market saw lower farm milk prices, similar to the Michigan experience. Of course, this also occurred during a period in which market prices for milk were generally below average and resulted in historically low returns for many farmers.
Not surprisingly, many dairy farmers and market participants saw milk being dumped and wondered why someone, maybe a beleaguered cooperative in particular, was not building a processing plant to absorb this excess milk production. There are a couple of reasons why new processing capacity has been slow to match increased production. The bulges in distressed or dumped milk are hardly uniform throughout the year (Figure 2). It is not obvious what plant would have marketing opportunities in the spring flush and in December. Absent that, the answer is often simply a butter/powder balancing plant that can manufacture a commodity product at a relatively low cost and store product until it can be sold. The proposition for butter is encouraging, inasmuch as sales are strong for butter and other cream-rich products. The problem is that market prices for non-fat dry milk and related protein powders are often barely sufficient to return a profit to existing plants, much less justify plant investment. Herein lies the conundrum of make allowances that do not adjust to reflect higher manufacturing costs. A higher make allowance would lower the price of milk relative to the wholesale price for non-fat dry milk and other commodities. While this would be encouraging news for manufacturers, it would be quite unwelcome news to farmers, who are already enduring a long period of below-average prices. When the manufacturer is a cooperative, there is a paralyzing conflict of interest as to how best represent the economic interests of their farmer owners.
Cooperatives are stretched to honor their commitment to guarantee a market for all milk produced by members. This has resulted in a number of cooperatives closing their membership to new applicants or developing various pricing schemes to try to discourage expansion by existing members. These moves are decidedly unpopular with most farmers, who prize their right to run their businesses as they see fit. Although calls to adjust the make allowances in federal pricing formulae are starting to be voiced, this remains a challenging proposition for cooperatives, which must convince farmers to support an action that will lower their minimum farm price just to make it feasible to build manufacturing plants that may well have low profit performance. At best, this would have the effect of lowering every farmer’s price a bit and reducing or avoiding the re-blending deductions that are costliest to market-balancing cooperatives.
In this environment, the marketing system that performed well over the last several decades is struggling with the multiple problems of too much milk production, declining sales of Class I milk, insufficient balancing-plant capacity, displaced farmers, and an extended period of low milk prices. This situation is calling into question the longstanding gospel of guaranteed markets for members of dairy cooperatives and the practical ability of a ponderous regulatory system to respond to a more rapidly changing market environment.
Liebrand, C.B. 2012. Dairy Cooperatives in the 21st Century—The First Decade. Washington, D.C.: U.S. Department of Agriculture, Rural Business-Cooperative Service, RBS Research Report 225, July.
Novakovic, A., and C. Wolf. 2016. “Federal Interventions in Dairy Markets.” Choices 31.
U.S. Department of Agriculture. Mideast Marketing Order Statistics. 2010-2018. Washington, D.C.: U.S. Department of Agriculture, Agricultural Marketing Service. Accessed August 12, 2018. Available online: http://www.fmmaclev.com/index.htm
U.S. Department of Agriculture. Northeast Marketing Order Statistics. 2010-2018. Washington, D.C.: U.S. Department of Agriculture, Agricultural Marketing Service. Accessed August 12, 2018. Available online: http://www.fmmone.com/Default.htm
U.S. Department of Agriculture. 2016. Milk Production, Annual Summary. Washington, D.C.: U.S. Department of Agriculture, National Agricultural Statistics Service. Accessed August 12, 2018.Available online: http://usda.mannlib.cornell.edu/MannUsda/viewDocumentInfo.do?documentID=1103
Yonkers, R. 2011. A Look at Dairy Market Price Volatility and Options for Dairy Policy Reform. Washington, D.C.: International Dairy Foods Association. Accessed September 24, 2018. Available online: https://www.idfa.org/docs/default-source/not-blank/a-look-at-dairy-market-price-volatility-and-options-for-dairy-policy-reform-by-bob-yonkers-ph-d-idfa-vice-president-and-chief-economist-05-25-11c0669a9c41746fcd88eaff000002c0f4.pdf?sfvrsn=0
[1] As noted in a recent article (Novakovic and Wolf, 2016), with the addition of California in November 2018, the Federal Milk Marketing Order system will regulate about 82% of U.S. milk production.
[2] Although counted as producer milk received by a regulated plant, distressed milk can be sold at a discount because cooperatives are generally not bound to price minimums. In some cases, this milk may not be pooled milk.

