Dairy farmers are well acquainted with managing volatile input and output prices. In the past 5 years, dairy farms experienced record high milk prices in 2014 followed by devastatingly low milk prices. In Minnesota, farms that contribute financial information to the FINBIN farm financial database reported the lowest average accrual net farm income, $407, in 2009, while the same sample reported an all-time average high of $236,544 just 5 years later in 2014 (FINBIN, 2018a). Even though cow-level milk production has increased since 2007 (FINBIN, 2018b); consolidation and a rapid increase in the average number of cows per farm are commonplace in the industry, as evidenced by the total number of U.S. licensed dairy farms, which decreased from 59,135 in 2007 (USDA, 2008) to 40,219 in 2017 (USDA, 2018a).
Regardless of changing farm structure, dairy farmers today know that commodity prices are projected to be depressed for several more years (USDA, 2018b). Low prices are not conducive to generational farm transition plans, replacing or updating equipment, or exploring innovative technology adoption. This has caused many dairy farmers to ask, “Is it financially sustainable to remain in the dairy industry at my operation’s current herd size?” More specifically, dairy farmers are trying to determine whether now is an appropriate time to expand, consolidate, or exit the industry. However, these are not the only options. Many small to medium-sized dairy farms in the Upper Midwest have revisited diversification strategies incorporating alternative revenue sources into their farm operation to stabilize whole farm profitability, meet debt obligations, and provide cash flow for family living expenses. Examples of alternative revenue sources to combat volatile milk prices include crop income, custom work, crop insurance, government program payments, and off-farm income. This analysis uses 11 years of consecutive financial data from Minnesota dairy farms to examine how revenue diversification strategies have been implemented and affected the financial success of dairy farms from 2007 to 2017.
Farm-level data were collected through collaboration between the University of Minnesota’s Center for Farm Financial Management (CFFM) and the Minnesota Farm Business Management (FBM) Association. Minnesota farm managers work with FBM educators through the Minnesota State College and University system and the Southwest Farm Business Management Association in conjunction with University of Minnesota Extension to improve record keeping throughout the farming year to facilitate farm management and financial decisions. FBM educators work with farm managers to complete and interpret accrual farm financial statements and enterprise-level analyses for their farm. These farm-level accrual data are then shared with the University of Minnesota’s CFFM to be aggregated with data from other farms through the FINBIN farm financial database, which is publicly available at an aggregate level (https://finbin.umn.edu/). In 2017, over 2,300 Minnesota farms, including 406 dairy farms, supplied data to the FINBIN database as members of the FBM association. These represent approximately 12.5% of Minnesota dairy farms (USDA, 2018a). In the FINBIN database, dairy farms are defined as farms generating 70% or more of total income from dairy sales. A subset of dairy farms are diversified with crop enterprises, and less than 70% of their gross revenue comes directly from dairy; these farmers were also included in the analysis to capture revenue diversification through crop production. In total, 84 small and medium-sized Minnesota dairy farms supplied data to FINBIN consecutively from 2007 to 2017. These farms form the basis of the data used in this analysis.
A dairy farm has several sources of revenue, including milk, cull cows, replacement heifers, bull calves, and crop sales. On average, dairy-related sales generated about 78.5% of total gross revenue for the 84 farms in our sample, with a range from 72.5% in 2009 to 81.9% in 2008. From 2007 to 2017, the average herd size for the sample increased from 145 cows in 2007 to 167 cows in 2017, with the highest average (174 cows) reported in 2012. Milk production efficiency continues to improve, with an average of 22,205 lb/cow in 2017, a 7% increase since 2007. Dairy income per cow ranged from less than $3,000/cow to over $5,200/cow, with an average of $3,945/cow.
While the majority of a dairy farm’s gross revenue is generated from dairy-related sources, approximately 75% of the dairy farms in this study reported crop income. Crop acreage increased approximately 19%, from an average of 432 acres in 2007 to 513 acres in 2017. This reflects increasing acreage for homegrown feed for the dairy, additional land for manure management, and creating a potential new revenue stream through grain sales. Increasing a dairy’s crop acreage requires the farm manager to consider the trade-off between crop production for feed usage versus selling grain crops. This decision is not an easy one since decreasing feed reserves may result in later feed purchases at a potentially higher cost due to crop failure or weather events. Jointly, additional acreage provides the option for future expansion, if that is the farm manager’s goal.
Low milk prices and an increased percentage of revenue generated from crop sales seem to go hand-in-hand. In 2009, dairy farmers in our sample received the lowest average milk price at $14.28/cwt and reported the largest percentage of crop revenue at 17.5% of total revenue sources. For many dairy farmers, selling excess crops was an appropriate method to sustain the operation given low milk prices. Having a diversified operation allowed them to rely on other revenue sources as it benefited their operation. Across the study period (2007–2017), crop sales generated approximately 13.3% of dairy farms’ gross revenue.
Crop insurance and government payments should not be considered a main source of revenue generation for a farm. However, dairy farms participated in both programs depending on their current situation. Crop insurance has an associated cost but provides protection against unanticipated weather events and other crop failures. Government program payments provide another source of dairy revenue through such programs as the Milk Income Loss Contract Program (MILC) or, most recently, the Margin Protection Program (MPP). While all farms in the sample reported some level of revenue generation from insurance or government program payments, these revenue sources accounted for approximately 2% or less of gross revenue.
Dairy farms reported that approximately 8%–9% of total revenue was generated through other income sources, including market livestock income, custom work, contract income, patronage and dividends, cash from hedging accounts, and “other income” as defined by the farmer. From 2007 to 2017, this number has remained fairly constant, indicating that the composition of these other income sources has not changed much. The underlying need and purpose for revenue diversification is to cover farm expenses. As dairy-related revenue has fallen, finding alternative revenue sources to cover the gap between revenue and expenses has become a top priority.
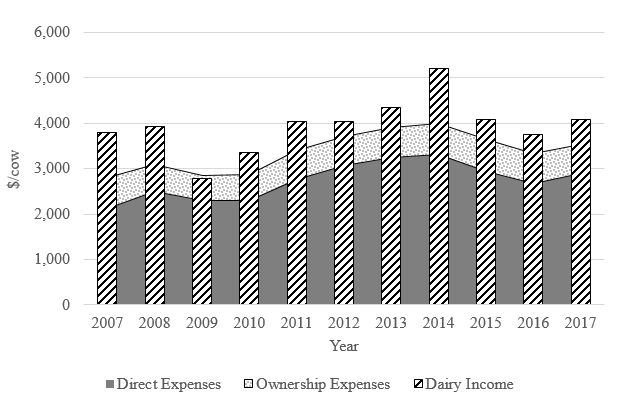
Feed costs are approximately 80% of total operating expenses for the dairy enterprise. Feed costs include corn, alfalfa hay, corn silage, haylage, and protein, vitamins, and minerals. The majority of Minnesota dairy farms reported homegrown feed, which is included in the feed cost calculation by totaling the amount of feed fed valued at the current feedstuff market price. The remaining operating expenses for the dairy operation include veterinary expenses, breeding fees, supplies, marketing, fuel and oil, repairs, and operating interest. Total operating expenses per cow increased 57% from 2007 ($2,112) to 2014 ($3,315), but most recently these costs have decreased (Figure 1). Ownership expenses—which include hired labor, building leases, utilities, interest and depreciation—averaged approximately $635/cow and varied little between 2007 and 2017.
For a dairy farm to remain profitable, it must be able to cover short-run operating expenses. Comparing average dairy farm revenue to operating expenses in this sample demonstrates that the average farm is able to cover its operating expenses each year and, in most years, cover ownership expenses as well. However, the margin between total expenses and dairy income decreased from $1,010/cow in 2007 to $541/cow in 2017 (Figure 1). In the past 11 years, the dairy margin has been below $500/cow six times, with a negative margin of −$69.15/cow in 2009. Most recently, in 2017, the average margin was $541/cow, which results in approximately $75,740 in potential returns to farm labor and management for an average herd of 140 dairy cows. This amount is used to cover family living expenses, health insurance, and other equity or investment priorities for the dairy farm.
Defining the characteristics of successful farmers that allow them to reach and maintain a higher level of performance is a routine question asked by Extension educators, agricultural economists, farmers, and the agricultural professionals who support farmers. One measure typically used to define a farm’s success, accrual net farm income (NFI), captures the monetary returns to an operator’s unpaid labor and management. However, this measure can be highly dependent on farm size and economies of scale and size. To standardize across herd sizes, we use the adjusted NFI ratio, which measures how efficiently a farm converts its gross farm revenue into a financial return. For this study, we adjust the denominator of the NFI ratio by using value of farm production (VFP) rather than gross revenue. VFP is an accrual-adjusted calculation that measures the composition of output produced on a farm for that particular year.
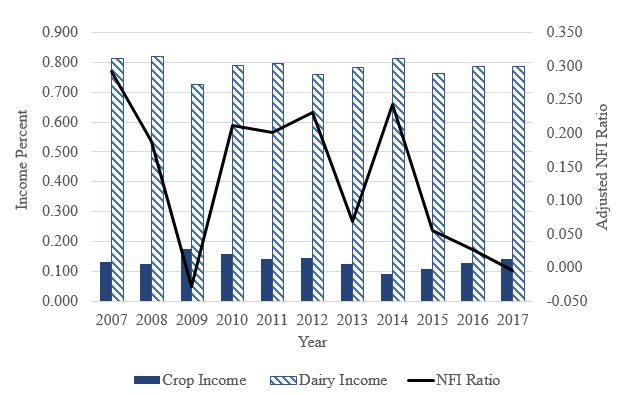
From 2007 to 2017, the adjusted NFI ratio averaged 13.5%, suggesting that for every $1 of VFP generated, $0.135 was retained at the farm level as a return to the operator’s unpaid labor and management. This average adjusted NFI ratio had two identifiable levels or averages prior to and after 2012 (Figure 2). Specifically, the adjusted NFI ratio averaged 18.2% from 2007 to 2012 and decreased to 7.8% between 2012 and 2017. The most alarming observation after 2012 (with the exception of 2014) is the persistent downward trend in the adjusted NFI ratio, which coincides with increased herd sizes, improved dairy cow efficiency, and increased crop acreage.
Successful dairy farms, defined as those with higher adjusted NFI ratios, capitalized on high commodity prices when they occurred. For example, dairy farms that increased crop acreage after 2009 were able to build equity with crop capacity, which later translated to growing their dairy herd when dairy prices increased in 2014. Having the flexibility to transfer labor and assets between the two enterprises does come at a cost, with increased total farm operating expenses associated with cropping systems. Diversified revenue sources allow farms to navigate lower prices by stabilizing revenue at a whole-farm level, but flexibility with farm management decisions plays an important role in the farm successfully balancing its limited resources.
In this analysis, we observed that small and medium-sized dairy farms participating in the Minnesota FBM program for 11 consecutive years increased their herd size and crop acres operated. These successful small and medium-sized dairy farms used revenue diversification to build equity through grain sales, which contributed to herd expansion efforts. Increasing farm size, through animals or crops, increases overall demands on the farm manager, with management time being one of the most limiting factors. Specifically, this analysis shows that even in low milk price years, the average Minnesota dairy farm that participated in FBM reported a positive return in 10 of the past 11 years. Dairy farmers who participated in FBM have indicated that they changed their cropping rotation to plant soybeans and corn for grain sales when it was cheaper for them to buy feed (e.g. corn silage and hay) than to raise their own. These farmers also indicated that they would not have made this change on their own; the outside perspective provided by participating in FBM helped them think through the potential benefits and downfalls of their revenue diversification strategy. The dairy farms in our sample that had existing infrastructure with machinery and equipment, land availability, labor, and knowledge related to crop production made this revenue diversification strategy work. We cannot put a specific value on the benefit associated with FBM programs, but this analysis demonstrates that there is positive value associated with obtaining an outside perspective when making financial decisions. It could be argued that high-profit years are the most vital to build equity and enhance the farm’s financial security. While farm prices remain uncertain, the collaboration between state level FBM programs and Extension is a valuable resource for evaluating diversification strategies for small to medium-sized dairy farms to survive the predicted tight margins in the short run.
FINBIN. 2018a. Financial Summary (Farms Sorted by Years). Minneapolis, MN: FINBIN, Report 448087. Available online: https://finbin.umn.edu/FinB.dll/generate?RecId=448087 [Accessed 12 Aug. 2018]
FINBIN. 2018b. Livestock Enterprise Analysis (Farms Sorted by Years). Minneapolis, MN: FINBIN, Report 448089. Available online: https://finbin.umn.edu/FinB.dll/generate?RecId=448089 [Accessed 12 Aug. 2018]
U.S. Department of Agriculture. 2008. Milk Production (February 2008). Washington, D.C.: U.S. Department of Agriculture, National Agricultural Statistics Service, February. Available online: http://usda.mannlib.cornell.edu/usda/nass/MilkProd//2000s/2008/MilkProd-02-15-2008.pdf
U.S. Department of Agriculture. 2018a. Milk Production (February 2018). Washington, D.C.: U.S. Department of Agriculture, National Agricultural Statistics Service, February. Available online: http://usda.mannlib.cornell.edu/usda/nass/MilkProd//2010s/2018/MilkProd-02-21-2018.pdf
U.S. Department of Agriculture. 2018b. USDA Agricultural Projections to 2027. Washington, D.C.: U.S. Department of Agriculture, Office of the Chief Economist, Long-Term Projections Report OCE-2018-1, February. Available online: http://usda.mannlib.cornell.edu/usda/ers/94005/2018/usda-ag-projections-2018.pdf

