While cropland prices have received considerable attention in the popular press, pasture land prices have also increased significantly in recent years. The predominant forages on pasture land differ across the United States but regardless of the forage type, pasture land is primarily used for beef production. The factors contributing to agricultural returns to pasture are very different than for cropland and not just because cowboys are different than farmers. As in the old TV show “Green Acres”, many urban dwellers have an affinity for country living. Pasture is also valued for recreational uses such as hunting.
The 2007 National Resources Inventory (NRI) reports 409 million acres of rangeland and 119 million acres of improved pastureland for the contiguous 48 states, which is 21% and 6%, respectively, of the 1.9 billion acres of land and water. In comparison, cropland accounts for 18% of the total with 2% in the Conservation Reserve Program. Rangeland is covered primarily by native grasses and plants while improved pastureland has introduced plants. The distribution of these two types of pasture is different from east to west in the United States. With the exception of Oklahoma and Florida, the land in pasture is more than 80% rangeland in states in the western half of the United States and 80% or more improved pastureland in the eastern half. Oklahoma’s pasture is 63% rangeland and Florida’s pasture is 58% improved pasture.
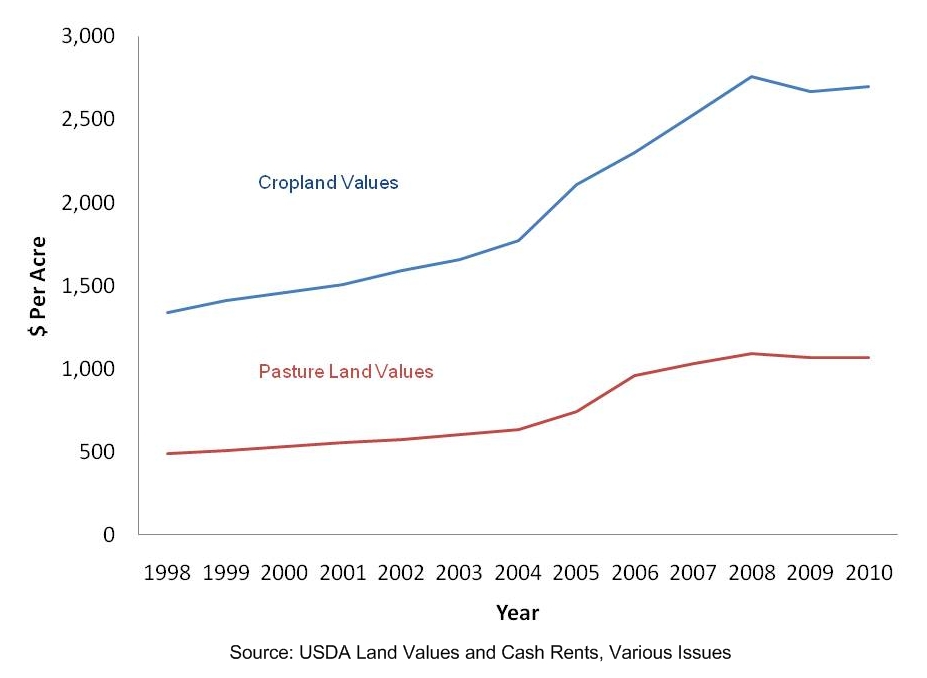
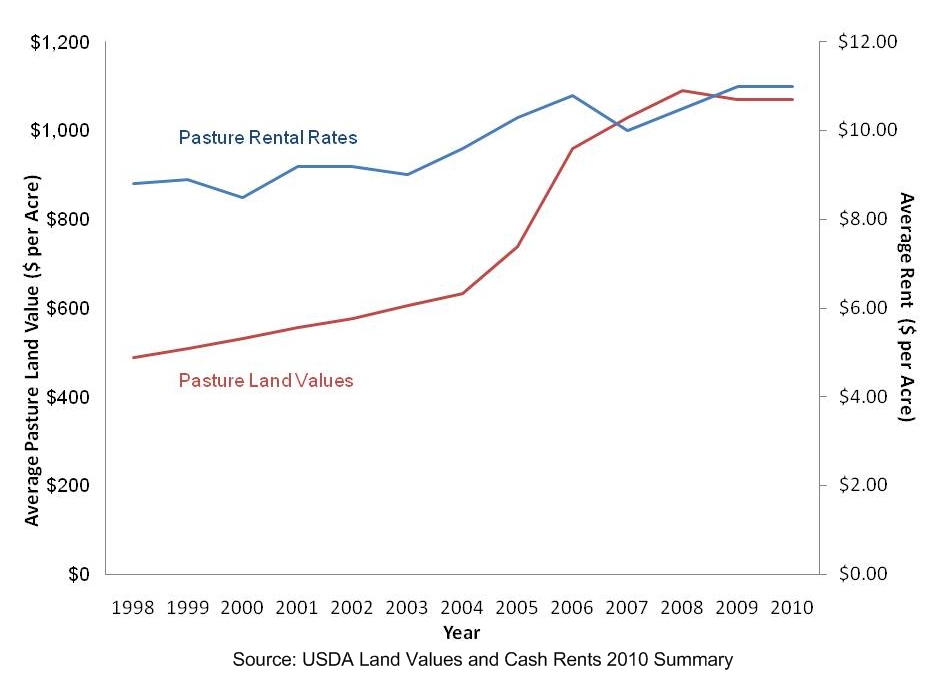
Like cropland, pasture land values which includes both improved pasture and rangeland have risen dramatically in recent years (Figure 1). While the average value has leveled off, U.S. pasture values have approximately doubled in the last ten years. Though USDA Agricultural Resource Management Survey data showed farm operator household farm income for beef cattle operations declined from 2005 through 2009, land values continued to go up. Over the last ten years, pasture rental rates have increased much less and when beef profitability slowed, rental rates adjusted more quickly (Figure 2).
As shown in Figure 3, pasture rent-to-value ratios have been mostly decreasing since 1998 with a larger decrease from 2005 to 2007, now stabilized at about 1%. U.S. average pasture rent-to-value ratios, historically lower than those of cropland, averaged 1.28 for 2000 to 2010 compared to 3.87 for cropland. Part of the explanation for pasture land owners’ historical acceptance of relatively low returns is that the livestock enterprises on pasture, particularly beef and horses, often include a lifestyle component for which people are willing to earn less. Pasture suffers less erosion and so it is losing little of its long term value while some cropland is losing value due to erosion and that may partly explain the higher rent-to-value ratios for cropland. But, clearly if the agricultural rental value were the only return from owning pasture, it would be a rather poor investment.
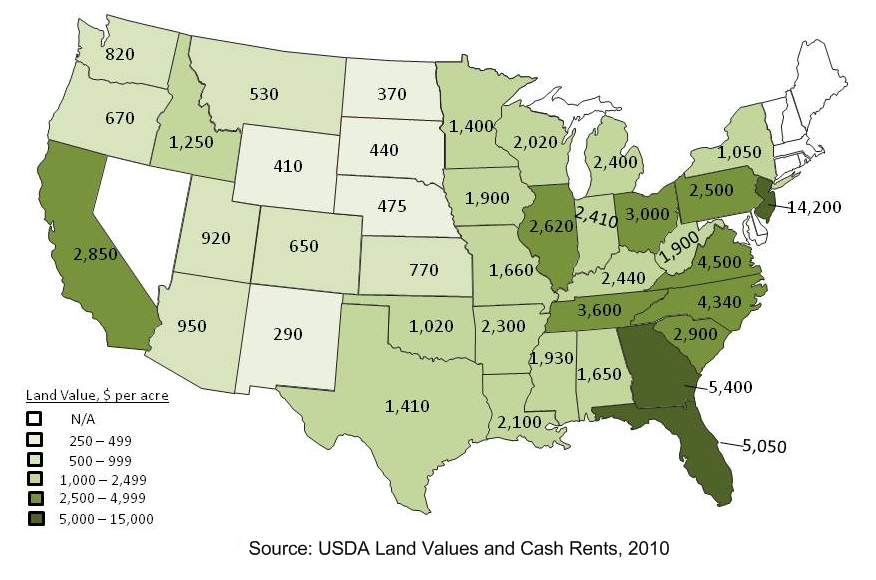
Figure 4 shows the variability across states in average pasture values. A comparison of Figure 4 with a population density map shows similarities in that East Coast states are densely populated and have high pasture land values, with values above the national average for both continuing west to the Missouri river. To the west, California has both high population density and high pasture land values.


Since 2005, pasture land values and rents in the central United States have grown faster than the national average (Figure 5). Factors contributing to the increase include factors that have impacted cropland values, but also others. With the exception of Texas, pasture rent-to-value ratios in the plains states have been above the national average.
In contrast to corn and soybean states, Oklahoma sales transaction data show pasture land average values exceed those of cropland (agecon.okstate.edu/oklandvalues). NRI data show that since 1987 Oklahoma cropland acreage has been decreasing while pasture land has been increasing, suggesting a conversion in use over time. While cropland has historically been worth more than pasture, pasture land began commanding a premium in eastern Oklahoma in the early 1990s. In western Oklahoma where agricultural land is predominantly cropland, cropland still commands a premium, but the gap is narrowing over time.
USDA survey data show that 2010 average pasture land values exceed average nonirrigated cropland values in many southeastern states—Arkansas, Louisiana, Mississippi, Georgia, North and South Carolina, Tennessee—and in New Jersey. In all of these states, the percentage of farms with sales less than $50,000 is above the national average. Other factors contributing to the phenomena are likely varied. In each of the southeastern states, 2007 Census data indicates production of more than 36,000,000 broilers and having land available for application of poultry litter is important. Census data also indicates the number of horse farms exceeds the national average in Arkansas, Georgia, North Carolina, and Tennessee as well as Oklahoma.
Economic theory suggests that the value of land is derived from the net present value of future returns, including agricultural uses, recreational uses, exurban low density residential uses, and the option to convert to urban uses. Agricultural characteristics such as soil productivity, land improvements, tract size, and rainfall are common factors used to explain differences in both pasture and cropland values across time and space. Government payments are relatively unimportant factors in explaining pasture values as farm programs are largely associated with crop production. For pasture land, agricultural returns are typically derived from livestock production, primarily cattle.
Pasture land has attributes that differentiate it from cropland for both recreational income and residential uses. Recreational income is primarily derived from leasing for hunting. Pasture land more often includes trees and shrubs which add value for wildlife habitat (especially deer) and recreational purposes. Trees together with the open space that pasture provides may also increase land’s attractiveness for rural housing. A tract of land with a single house is still classified as agricultural land whereas if it were converted to a housing subdivision it then is classified as urban.
The beef enterprises that dominate pasture acreage in the Plains States include both cow/calf production and grazing of weaned calves prior to placement in feedlots. Returns to the cow/calf enterprise have historically been cyclical as cow numbers and calf prices vary over time. Recurring droughts also impact cow numbers and pasture returns. In recent years, the cow herd has shrunk to historical lows. Higher costs of cattle feed ingredients, including corn and soybean meal, have increased the incentive to grow cattle for a relatively longer period on grass. High fertilizer prices lower returns on both cropland and improved pasture. In the Plains States, most pasture is rangeland which does not require fertilizer so returns to native pasture are less impacted by highly variable fertilizer prices. Thus, the factors leading to high prices for crops and cropland also indirectly affect the demand for pasture and the returns to pasture land and pasture values.
Pasture land also lends itself more readily to beginning, small, and part-time farms, which are common in the Southern Plains. While a quarter section of land is uneconomical for crop farming because of economies of size, a similar amount of pasture land can support a few cows and/or goats. Census of Agriculture data show that more than half of the farms with beef cattle have fewer than 20 cows. The number of farms with fewer than 10 head of cattle increased from 2002 to 2007. While small farms account for only 7% of the cow herd, small and part-time farmers have relatively more off-farm income and are willing and able to pay higher prices for pasture land than established producers, particularly for small parcels. Smaller parcels, especially those near urban areas, command higher per acre prices.
Factors such as hunting lease rates, deer density, recreational income from agricultural uses, and acres of elk habitat have been used to explain differences in agricultural land values. U.S. Census of Agriculture data on recreational income showed an average growth of 180% from 2002 to 2007. In Oklahoma, deer hunting is the leading recreational use of agricultural land. Pasture offers year-round forage for deer and also often includes the woody cover required by deer. Oklahoma State University (OSU) rental rate survey data indicate that agricultural producers can earn approximately $4 per acre through deer hunting leases. The 2006 National Survey of Fishing, Hunting and Wildlife-Associated Recreation shows that U.S. hunting participation rates range from 2% in the Pacific region to 12% in the central United States. Almost all (96%) big game hunters, including deer hunters, hunt within their resident state. The increase in the value of deer hunting is due directly to increased interest in and opportunities for hunting due to an explosion in deer numbers. A cultural shift to charging hunters and changes in liability laws also increased adoption of hunting as an alternative business enterprise. Also, many hunters are now more than one generation away from the farm and they no longer have access to family land. The increase in the popularity of deer hunting helps explain the increase in the value of pasture relative to cropland in Oklahoma.
A 2003 NRI study noted that between 1997 and 2001, the rate of rangeland conversion to developed uses continued on an upward trend whereas the conversion of cropland had slowed. A 2007 NRI study reported that 40 million acres of land were newly developed between 1982 and 2007, representing a 56% increase, and accounting for more than one-third of all developed land in the lower 48 states. Rangeland with mature trees is often preferred for housing development. Bottomland cropland often is in a flood zone and thus is less desirable for development. Changes in population density, population growth, per capita income, and distance to urban areas often help explain changes in agricultural land prices over time. Agricultural land value studies have historically shown that population density increases land values. Urban pressure increases all agricultural land values, but may be slightly more important for pasture than for cropland.
Bankers note that oil and gas royalty income helps support land prices in the Plains States. Anecdotal evidence in Oklahoma supports this notion as many heads will nod in agreement if you hypothesize in an Extension meeting that much farmland was paid for with oil and gas royalty income. Royalty income affects both crop and pasture land values but where pasture is valued lower, the impact on pasture values will be larger in percentage terms.
Tax policy and the related property tax assessments relative to agricultural land vary from state to state but often distinguish between cropland and noncropland. In Oklahoma, assessed values are a blend of market value and productive value, 25 and 75% respectively. Thus, the per acre taxes for pasture would be relatively lower than for cropland. In local areas, IRS Sec. 1031 like-kind exchanges for tax purposes can be important factors in land markets. For instance, when Wal-Mart’s world headquarters were established in northwest Arkansas, the urbanization of the surrounding area led to producers reinvesting proceeds from those sales in land in northeast Oklahoma.
As the prospects for forage-based biofuel crops appear limited in the near future, one of the key factors in the run-up of cropland prices does not directly apply to pasture. However, high corn and other feed ingredient prices increase the value of pasture for putting gain on cattle and this can be expected to continue while commodity prices are high. While demand for high end products slowed during the economic downturn, beef demand remained strong. Growing exports have also contributed to what are now record high beef prices. If world income continues to increase and with it, the demand for protein internationally, beef demand could increase, providing support for beef prices and pasture land values from an agricultural income perspective. Anecdotal evidence from agricultural lenders suggests that, during the national economic slowdown, the rate of growth in price increases for land purchased for recreational use slowed. Still, recreational use remains important and U.S. population continues to grow.
Doye, D. and R. Sahs. (2010). “OSU Rental Rate Survey.” Unpublished data.
Guiling, P., Doye, D., and Brorsen, B.W. (2009). Why has the price of pasture increased relative to the price of cropland? Journal of American Society of Farm Managers and Rural Appraisers, 73, 99-111.
Briggeman, B. and Akers, M. (2010). “Farmland values and farm income soar.” Survey of Tenth District Agricultural Credit Conditions. 4th Quarter. Federal Reserve Bank of Kansas City, Available online: http://www.kansascityfed.org/publicat/research/indicatorsdata/agcredit/AGCR4Q10.pdf
Peterson, W. (1986). “Land quality and prices.” American Journal of Agricultural Economics 68(4), 812-819.
United States Census Bureau. (2009). Population Estimates. Available online: http://www.census.gov/popest/gallery/maps/
United States Department of Agriculture National Agricultural Statistics Service. (2007). Census of Agriculture. Available online: http://www.agcensus.usda.gov/Publications/2007/Full_Report/Volume_1,_Chapter_1_US/index.asp.
United States Department of Agriculture National Agricultural Statistics Service. (2010). Charts and Maps of Land Values and Rental Rates. Available online: http://www.nass.usda.gov/Charts_and_Maps/Land_Values_and_Cash_Rents/index.asp
United States Department of Agriculture Natural Resources Conservation Service. (2009). Summary Report, 2007 National Resources Inventory. Natural Resources Conservation Service, Washington, DC, and Center for Survey Statistics and Methodology, Iowa State University, Ames, Iowa. http://www.nrcs.usda.gov/technical/NRI/2007/2007_NRI_Summary.pdf
United States Department of Agriculture Natural Resources Conservation Service. (2003). Urbanization and Development of Rural Land. National Resources Inventory 2001. Available online: http://www.nrcs.usda.gov/technical/NRI/2001/nri01dev.html
United States Department of Agriculture.(2010). Land Values and Cash Rents 2010 Summary. Available online: http://usda.mannlib.cornell.edu/MannUsda/viewDocumentInfo.do?documentID=1446
United States Department of the Interior Fish and Wildlife Service and United Sates Department of Commerce Census Bureau. (2006). 2006 National Survey of Fishing, Hunting, and Wildlife-Associated Recreation. Available online: http://www.census.gov/prod/www/abs/fishing.html

