There are a number of reasons to expect farmland values to be higher near urban areas. Many urban centers initially grew among particularly fertile soils so farmland near these areas tends to be quite productive. Farms near urban areas have greater access to markets and ports and therefore lower transportation costs. As a result, these farms may generate economic profits above comparable lands further from the urban center. In addition, at the urban fringe, farmland offers recreational opportunities and lifestyle amenities which serve the nearby population. Farms near urban areas are also more susceptible to development pressures. Their values may be "bid up" by competing land use activities, including commercial and residential uses. It is not surprising then that the existing literature suggests urban influence is a dominant factor in the determination of agricultural land values (Blank, 2007).
This article examines the role of urban influence on U.S. cropland values. Based on farmer-reported data from USDA/NASS June Area Survey (JAS), urban pressures exhibited significant influence on U.S. cropland values during the 1999 through 2010, a period of significant volatility in urban real estate markets, as well as increasing farm incomes and record high commodity prices.
The Economic Research Service developed the Population Interaction Zones for Agriculture (PIZA) in order to better understand the economic relationship between urban and agricultural areas. Here, regions are identified as “rural” or “urban-influenced” based on the potential population interaction between nearby urban-related population and agricultural production activities. Figure 1 shows the median, inflation-adjusted value per acre of cropland identified for rural and urban-influenced parcels from 1999 to 2010. Median values in urban-influenced areas are consistently above those in rural areas throughout the observation period.
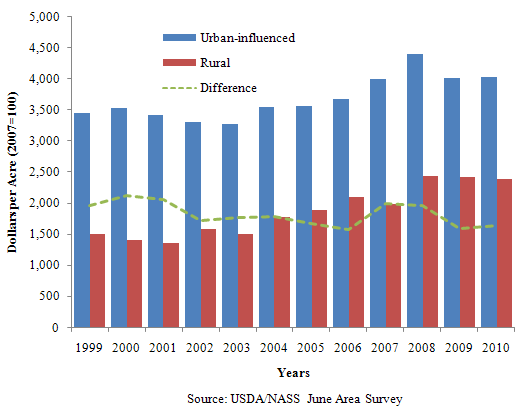
The difference between urban-influenced and rural values ranges from $1,576 in 2006 to $2,122 in 2000, with an average difference of $1,820 per acre. However, the average annual inflation-adjusted growth rate for rural cropland values is greater than that of urban-influenced areas at 4.8% compared to 1.5%. This suggests the difference between urban-influenced and rural cropland values is narrowing which can be observed by the dashed line in Figure 1. In addition, the median values for rural and urban-influenced cropland values do not appear to move together. The median value of urban-influenced cropland was at its lowest point at the beginning of 2003 and peaked at of $4,400 at the end of 2007. This mirrors the changes in urban housing values over the same period. In contrast, the median value of rural cropland was at its lowest point at the beginning of 2001 and has exhibited a less pronounced decline following a high of $2,447 at the end of 2007.
While cropland values are higher in urban-influenced areas, the price premium is not necessarily driven by urban pressure alone. In order to better understand this price premium, an analysis was conducted to derive the portion of cropland value that was directly attributable to agricultural use. The value of agricultural use was calculated by capitalizing the value of expected returns to agricultural production. This was accomplished by dividing farmer-reported rent by a discount factor—in this case, the 10-year U.S. Treasury note interest rate. This provides an estimate of the agricultural value of farmland assuming that rents and interest rates remain at current levels. Next, these values were compared to farmer-reported land values by calculating the ratio of farmer-reported land values to capitalized rents. When the ratio equals 1.0, it suggests that survey respondents' estimate of market value is equal to the implied agricultural use value based on cash rent divided by the 10-year U.S. Treasury rate.
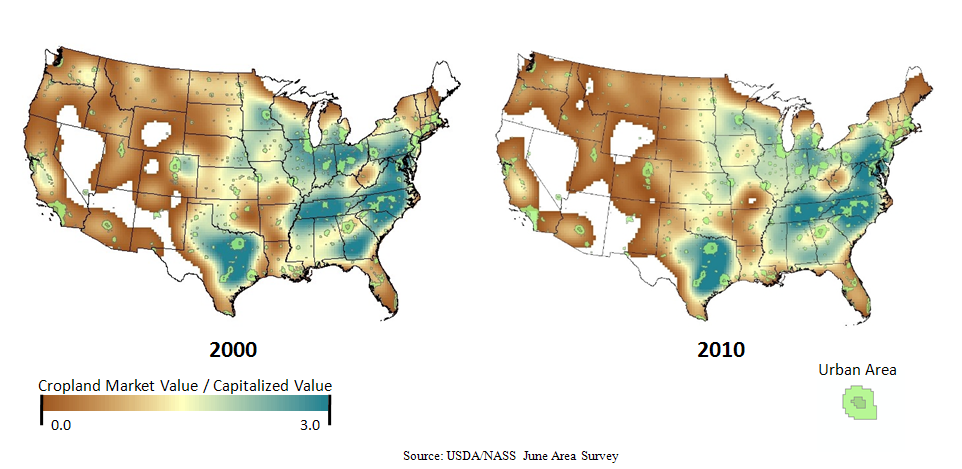
Figure 2 shows the changes in the ratio across the continental United States over the period 1999 – 2008 based on the JAS respondent locations. The whitespace indicates that no data were available or an insufficient sample size for disclosure. The highest values of the rate tend to be located in the Eastern United Stastes and near urban areas. Consistent with expectations, the map suggests that cropland values deviate from their agricultural use values near urban areas. The areas of greatest deviation are found throughout the Eastern United States, as well as Eastern Texas and parts of the Upper Midwest.
The degree of urban influence is expected to vary according to the characteristics of the urban area, including population density, as well as the characteristics of the surrounding agricultural lands, such as recreation potential or production intensity. As a result, urban-influence is not expected to be uniform across the United States, but to vary by location. While urban influence is an important factor nationally, the impact of urban pressure may be larger (or smaller) in some areas. This can be illustrated by considering how urban influence impacts cropland values in Atlanta, Ga.; Chicago, Ill.; Dallas, Tex.; and Minneapolis, Minn. This illustration (Figure 2) highlights the differing price impacts in these markets, as well as one potential driver of nonagricultural land values—urban development.
The four metropolitan areas were selected based on the observed deviation between cropland values and their implied agricultural use in surrounding rural areas. Each metropolitan area is surrounded by agricultural lands, yet the agricultural production varies across locations. For example, the areas surrounding Chicago are principally devoted to row crop production, yet in Dallas, the surrounding agricultural lands consist of a greater share of livestock production.
The cities also vary in terms of urban characteristics. The Atlanta metropolitan area is a major economic hub for the Southeastern United States and home to 5.2 million inhabitants. The city has grown rapidly in recent decades due in part to the growth of the city's major industries: financial services, media, and transportation. Similarly, Chicago, with 9.6 million inhabitants, is the largest economy in the Midwest, and its economy centers around financial and other high-value services. Minneapolis, also located in the Midwest, is home to approximately 3.5 million people, and its economy is principally comprised of financial institutions and transportation industries. Dallas, on the other hand, is the third largest city in Texas, with a metropolitan area population of 1.2 million, and the city's rapid economic growth is attributed to high-tech companies, as well as manufacturing and services.
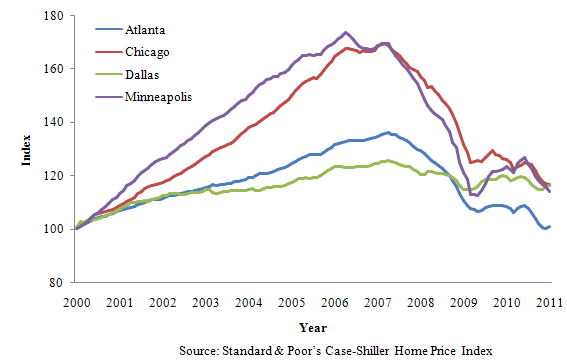
One factor potentially contributing to higher land values in urban influenced areas is urban land use “bidding up” the market value of land. The Case-Shiller Home Price Indices (Figure 3) for each of these metropolitan areas can be used to help illustrate this potential in each of the markets from 2000 to 2011 (Standard & Poor's). All of the metropolitan areas exhibited a period of positive price appreciation over the period 2001 – 2006 and a price decline in the remaining years. The declines were most pronounced in the Minneapolis and Chicago metropolitan areas. The Minneapolis price index fell from a peak value of 174 in April 2006 to January 2011 value of 114. The Chicago price index fell from a record high of 169 in April 2007 to a current value of 117. Although the appreciation through 2007 is less pronounced in Atlanta, the metropolitan area experienced a significant reduction in home prices that are currently below 2000 reported values.
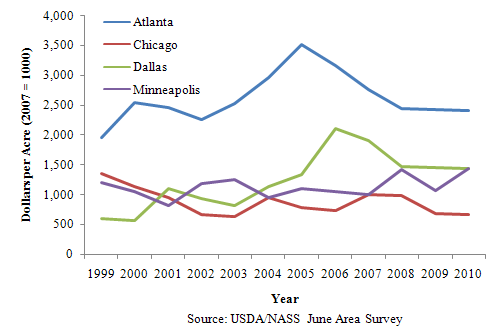
To examine the potential bidding up of farmland prices in these areas, the ratio of cropland value to its implied agricultural use value at the farm level were calculated for both rural and urban-influenced farms within 300 miles of each city. The differences between farmer reported land values and implied agricultural use values were greatest in the area surrounding Atlanta, at a range of $1,957 (1999) to $3,509 (2005). Although median prices were much lower, the difference between cropland values and their implied agricultural use values for Dallas exhibited a similar range of $1,535. The range is much lower in Chicago ($723) and Minneapolis ($621). The figure also suggests a narrowing of the difference between urban-influenced and rural cropland values in Atlanta, Chicago, and Dallas following the housing decline.
One of the primary drivers of farmland values near the urban fringe is the potential for conversion to residential or commercial use. Throughout recent decades, a number of U.S. cities have expanded through what is generally referred to as "urban sprawl." Irwin and Bockstael (2007) show that urban sprawl alters, not only the value of land, but the pattern of land use activities. The authors demonstrate that land parcels near the urban fringe are more likely to be divided into smaller pieces and surrounded by other land uses, or fragmented. The degree of fragmentation rises and then falls as distance from the urban center increases. That is, at the urban core, one observes large continuous patterns of urban land use activities, such as commercial and residential areas, yet at the urban fringe, land uses are divided into smaller patches which may consist of residential, commercial, industrial, and natural resource based activities, including agricultural production. Past the urban fringe, agriculture becomes the dominating land use activity. This pattern of development effects agricultural production practices, as well as the quantity and quality of nonmonetary benefits of agricultural land use (Barnard, 2000).

Figure 5 shows the fragmentation of agricultural lands at the urban fringe of the four selected metropolitan areas. The fragmentation measure is calculated through geographic imaging systems (GIS) using the 2006 National Land Cover Database. The fragmentation measure examines the size and shape of contiguous agricultural parcels. Highly fragmented parcels are shown in dark green. The greatest degree of spatial fragmentation occurs in the Atlanta metropolitan area, and the urban fringe near Chicago exhibits the least pronounced fragmentation. Part of this difference may be attributed to the nature of the agricultural production in the surrounding areas. The area around Atlanta contains a greater proportion of specialty crops and poultry which can be profitably raised on smaller tracts, yet near Chicago larger tracts of land are required for row crop production. However, similar crops are grown near Minneapolis which exhibits a higher degree of fragmentation. The difference between Chicago and Minneapolis, therefore, may be more directly attributable to differences in urban characteristics.
It is also important to note that land use patterns are not symmetric around the urban core. Thus, even within a particular metropolitan area, the degree of urban influence is not uniform across space. For example, the degree of fragmentation is greater west of Dallas than east.
In sum, farmland values are higher near urban areas. Urban influence is associated with land values being "bid up" by competing land use activities, including residential and commercial development. The June Area Survey data support this notion as cropland values are shown to be higher in urban-influenced areas with an expected premium at the median of about $2,000 per acre. The pattern of influence, however, has not changed substantially at a national level in recent years, even given the significant volatility in the residential land market. Price impacts are shown to vary by metropolitan area, however, altering both the value of lands and the pattern of land use activities.
The natural question then arises, "What is the likely impact of urban influence in future years?" The ratio of cropland values to capitalized rents, which measures the influence of nonagricultural factors, can change in at least two ways. First, the agricultural value of land may increase as the result of rising commodity prices. Second, a further decline in the housing market may reduce urban development. Deferred futures contracts suggest that commodity prices are expected to remain high, and USDA farm income forecasts suggest increasing returns to agricultural production. In addition, recently released Case-Shiller Home Price Indices suggest a continued decline in housing values.
This study suggests urban influence has exhibited little variation nationally over the preceding decade. The difference between median values for rural and urban-influenced acreage remained relatively consistent both ahead of the housing price bubble and after its burst. Therefore, if recent strong commodity prices and farm earnings continue in the agricultural sector, it is unlikely that changes in U.S. farmland values in the future will be a direct result of urban influence. The distribution of commodity production and differential housing market outcomes, however, will contribute to varied outcomes across major metropolitan areas.
Barnard, C.H. (2000). "Urbanization Affects a Large Share of Farmland." Agriculture and the Rural Economy, 10 (2): 57–63.
Blank, S.C. (2007). "Farmland Values as an Indicator of Regional Economic Performance?" Agricultural and Resource Economics Update, University of California.
Irwin, E.G. and N.E. Bockstael. (2007). "The Evolution of Urban Sprawl: Evidence of Spatial Heterogeneity and Increasing Land Fragmentation." Proceedings of the National Academy of Sciences, 104 (52): 20,672–20,677.
United States Department of Agriculture National Agricultural Statistics Service. (1999-2010). June Area Survey. Available online: http://www.nass.usda.gov/Surveys/Guide_to_NASS_Surveys/June_Area/index.asp
United States Department of the Interior.(2006-2010). National Land Cover Database. Available online: http://www.mrlc.gov/
United States Department of Agriculture, Economic Research Service. (2005). Population Interaction Zones for Agriculture. Available online:http://www.ers.usda.gov/data/populationinteractionzones/discussion.htm
Standard & Poor's Case-Shiller Home Price Indices. (2011). Available online: http://www.standardandpoors.com/indices/sp-case-shiller-home-price-indices/en/us/?indexId=spusa-cashpidff--p-us----

