Changes to U.S. immigration laws and policies could alter the supply of foreign-born labor to all industries, including agriculture. As of March 2010, unauthorized immigrants accounted for 5.2% of the U.S. civilian labor force, according to estimates by Passell and Cohn (2011). In crop agriculture, this proportion is much higher: 48% of hired farmworkers are unauthorized, according to data for 2007-09 from the U.S. Department of Labor’s National Agricultural Workers Survey (NAWS) (Carroll, Georges, and Saltz, 2011). Similar survey-based data are not available for the livestock and animal product sectors, although unauthorized immigrant workers are certainly present in those sectors as well.
To better understand how changes in the supply of foreign-born labor might affect agriculture, we use a computable general equilibrium (CGE) model of the U.S. economy to evaluate two different scenarios: (1) a 156,000-person increase in the number of temporary nonimmigrant farmworkers, such as those now admitted via the H-2A Temporary Agricultural Program, and (2) a 5.8-million-person reduction in the number of unauthorized workers in all sectors of the economy, including agriculture. These figures were chosen to represent possible policy-induced changes to the supply of labor but do not represent an assessment of the effects of any specific legislative proposal.
A CGE model is well suited for this type of analysis because it takes account of linkages between factor and product markets in all industries, allowing us to quantify the potential effects of changes in immigration policy on domestic demand for U.S. agricultural output, on the U.S. labor market and wage costs to agriculture, and on exchange rates and international agricultural trade. In this article, we summarize the main findings of our modeling work and discuss the evolving economic context for foreign-born farm labor in the United States. A more detailed discussion of our modeling results may be found in a recently published report by USDA’s Economic Research Service (Zahniser, et al., 2012). An analysis of the status of current legislative proposals relating to immigration and agriculture may be found in Martin (2012).
Over the past several years, a number of news stories and reports commissioned by grower organizations have suggested the existence of agricultural labor shortages in certain parts of the United States (see, for example, Turnbull’s (2011) examination of the Washington apple industry and McKissick and Kane’s (2011) survey of fruit and vegetable growers in Georgia). While localized shortages at times of peak labor demand are a recurring challenge, and there is evidence that some state-level policy changes have reduced the size of the unauthorized labor force in particular states, it is important to consider evidence from multiple sources before reaching conclusions about general trends in the farm labor market. We look first at the rate of net immigration from Mexico, which has slowed, suggesting that the supply of farm labor might be tightening. However, participation levels in the H-2A program and national trends in farmworker wages do not support this conclusion at the national level.
Several researchers who study Mexican migration—including Douglas Massey of the Mexican Migration Project (as cited by Cave, 2011) and Jeffrey Passel, D’Vera Cohn, and Ana Gonzalez-Barrera (2012) of the Pew Hispanic Trust—have concluded that, after being at high levels over the past 40 years, unauthorized immigration from Mexico is no longer keeping up with the number of immigrants returning to Mexico. Since Mexico is traditionally the leading country of origin of foreign-born U.S. farmworkers, this phenomenon of “net zero” or even “net negative” migration implies that the existing unauthorized farm workforce is not being replaced. This could cause the U.S. farm labor supply to tighten, as older workers exit from agriculture. The NAWS data, in fact, indicate that the agricultural labor force is gradually aging, with the average age of a farmworker in U.S. crop agriculture increasing from 31 to 37 years between 1995-97 and 2007-09 (Carroll, Georges, and Saltz, 2011). However, the researchers observing net zero migration do not provide specific estimates for farmworkers, who make up a relatively small share of unauthorized Mexican immigrants. When unauthorized immigrants from all countries are considered, the farming, fishing, and forestry sectors accounted for less than 4% of the unauthorized U.S. workforce in March 2008, according to estimates by Passel and Cohn (2009). Moreover, it is possible that unauthorized workers in occupations other than farm work could move into agriculture, as employment opportunities in other industries remain hard to find.
Multiple economic factors explain the decrease in Mexican migration, including improved economic prospects in Mexico, violence that targets unauthorized migrants as they try to emigrate from Mexico, the U.S. recession of 2008-09, and high levels of U.S. unemployment since then. Heightened enforcement of U.S. immigration restrictions has also played a role. The U.S. border patrol program budget has increased, from $1.1 billion in fiscal year (FY) 2001 to $3.5 billion in FY 2011 (U.S. Department of Homeland Security, Customs and Border Protection, 2012). So, too, has the annual number of unauthorized immigrants removed from the United States to Mexico, from about 151,000 in 2001 to 282,000 in 2010 (U.S. Department of Homeland Security, Office of Immigration Statistics, 2011).
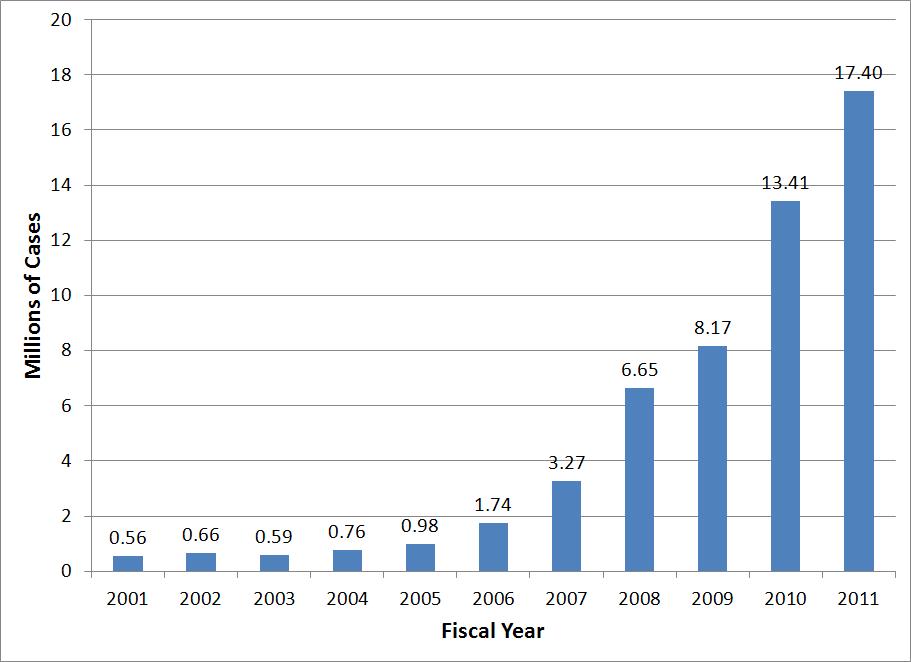
At the same time, an Internet-based system called E-Verify, operated by the U.S. Department of Homeland Security in partnership with the Social Security Administration, is being used more widely to confirm the employment eligibility of U.S. workers. E-Verify enables employers to determine the eligibility of their employees to work in the United States using the information reported by employees on their Form I-9, Employment Eligibility Verification. Although the Federal Government does not currently require all private-sector employers to use E-Verify, several State Governments do, including Arizona, Alabama, Mississippi, and South Carolina. In addition, Utah requires that all private-sector employers use one of several methods to confirm employment eligibility, with E-Verify being one of the specified options, and Georgia is phasing in its own E-Verify mandate by 2013 for businesses with 11 or more employees. Over the past decade, the number of cases in which E-Verify was used has increased dramatically, reaching 17.4 million in FY 2011 (Figure. 1).
The extent to which E-Verify has affected migration trends at the national level is not known, but it definitely reduces the supply of labor available to employers who are required to use it. Moreover, the evidence from Georgia and Arizona suggests that E-Verify, along with other legislative changes, has reduced the number of unauthorized workers in those states. In a survey of farmers, processors, and individuals in other agriculture-related professions in Georgia, about one fourth of the respondents who hired fewer workers in 2011 than they had on average during the five previous years cited the State’s new immigration law as the reason for their difficulty in recruiting labor (Georgia Department of Agriculture, 2012). This decline took place in advance of the implementation of Georgia’s E-Verify mandate and may have occurred because unauthorized workers acted in anticipation of the law. Similarly, Lofstrom, Bohn, and Raphael (2011) estimate that the number of unauthorized people of working age in Arizona decreased by 17% following implementation of Arizona’s E-Verify mandate in 2008.
These findings suggest that a combination of economic forces and increased enforcement have reduced the number of new immigrants and may be deterring unauthorized workers from living in certain states, reducing the supply of farm labor at either the national or state level. Meanwhile, demand for farm labor has remained relatively constant: annual average farm employment has fluctuated around 1 million since 2007 (USDA, National Agricultural Statistics Service, 2007-11). If the supply of foreign-born labor is no longer being replenished by new immigrants and if workers in other occupations are not shifting to agriculture while demand is remaining constant, then a farm labor shortage may indeed occur.
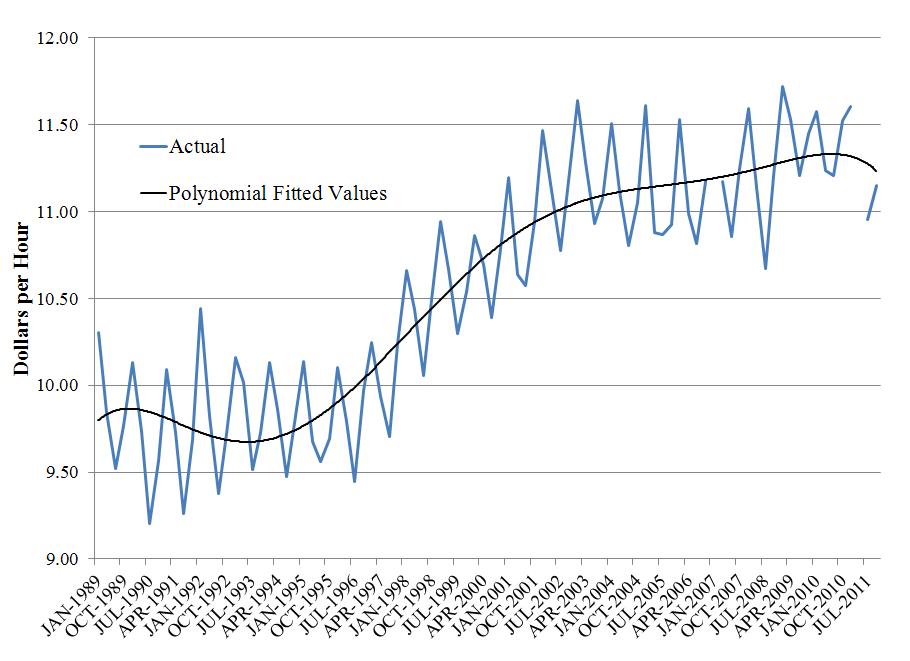
On the other hand, two important indicators suggest that labor supply is not falling relative to demand. First, the real wage of directly hired farmworkers—both authorized and unauthorized, in all farm occupations—which is the most reliable indicator of labor scarcity, does not appear to be rising. Directly hired farm workers, whose ranks do not include contract and service workers in agriculture, account for roughly 70-75% of hired labor in agriculture (USDA, National Agricultural Statistics Service, 2007-11). Figure 2 shows the real hourly wage of directly hired U.S. farmworkers at October 2011 prices. After rising at a compound annual rate of about 1.6% between 1994 and 2002, the real wage rate grew at just 0.1% per annum between 2002 and 2011. This latter increase corresponds to an increase of just 11 cents per hour over a nine year period. Moreover, real wages fell by 1.7% between 2010 and 2011.
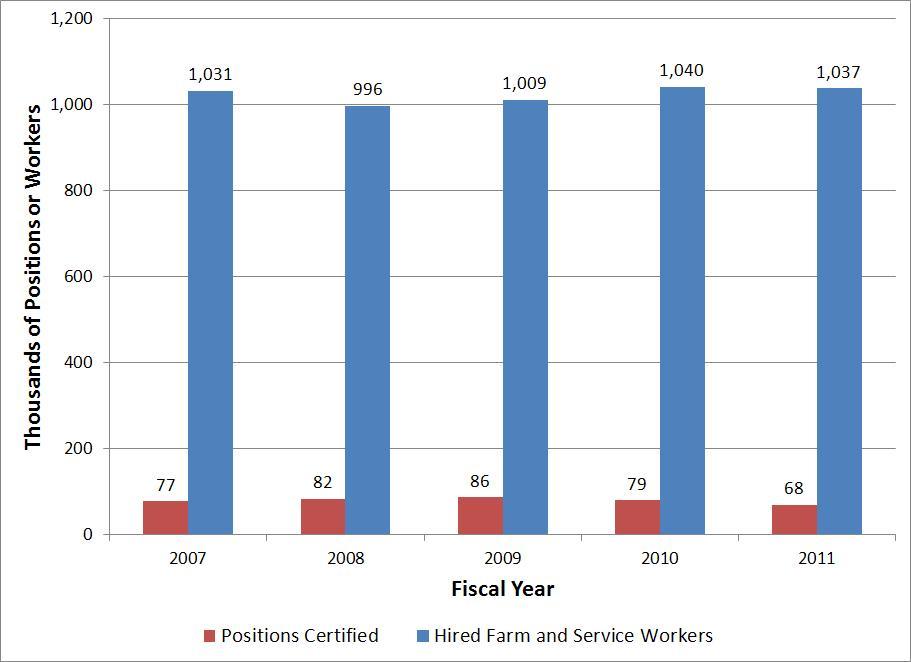
A second way to estimate the degree of labor shortage is to ask whether participation in the Federal Government’s H-2A Temporary Agricultural Program has been increasing. The H-2A program, as described by the U.S. Department of Labor, “establishes a means by which agricultural employers who anticipate a shortage of domestic workers can bring in nonimmigrant foreign workers to the U.S. to perform agricultural labor or services of a temporary or seasonal nature.” Although there is no legal limit to the number of workers who can participate in the program each year, just 78,579 positions in the program were requested by prospective H-2A employers in FY 2011, 68,088 of which were certified. Over the past 5 FYs, the number of positions certified has corresponded to less than one tenth of the number of hired workers in agriculture (Figure. 2). If labor were indeed scarce, one would expect H-2A participation levels to rise. Instead, use of the program has decreased in recent years.
The information presented above suggests that despite the apparent onset of net negative migration from Mexico, there is not yet a widespread shortage of agricultural labor in the United States. In our simulation analysis discussed below, we consider how more pronounced changes in the supply of foreign-born labor might affect U.S. agriculture, the market for hired farm labor, and the economy as a whole.
To quantify the impacts of alternative immigration policy scenarios, we use a type of economic model called a computable general equilibrium (CGE) model. A CGE model uses interrelated equations to represent an entire economy—the agricultural and the nonagricultural sectors—and the interactions among its parts. Our particular model—the U.S. Applied General Equilibrium (USAGE) Model—differentiates the U.S. workforce into 50 occupations and three categories pertaining to immigration status:
1. U.S. born;
2. Foreign-born, permanent resident: a person with the U.S. immigration status of permanent resident—including naturalized citizens—and thus legally authorized to work in the United States; and
3. Foreign-born, not a permanent resident: a person without the U.S. immigration status of permanent residency.
The majority of persons in this third category are not legally authorized to work in the United States. For this reason, we sometimes use the term “authorized” to refer to people in the first and second categories and the term “unauthorized” to refer to people in the third category.The third category, however, also includes foreign-born persons with nonimmigrant visas, such as H-2A workers, who are legally authorized to work in the United States during a specified period but are not permanent residents of the United States.
With these categories in place, we use the model to generate long-run—15-year—economic projections for the United States under a base forecast and two different policy scenarios—one representing increased availability of temporary nonimmigrant foreign-born farm workers and the other representing a 40% decrease in the availability of unauthorized labor throughout the economy. The base forecast simulates how the economy would evolve under current laws and policies and serves as a benchmark for evaluating the two policy scenarios. The base year in our study is 2005, which corresponds roughly with the time when net migration from Mexico to the United States started to decrease.
Like many CGE models, the USAGE model achieves a long-run equilibrium in which all labor and capital resources are nearly fully employed. Thus, the simulations reported here do not apply to the current economic environment, in which about 8.1% of the U.S. workforce is unemployed—as of April 2012. Instead, the model results describe hypothetical, long-run scenarios in which the U.S. economy is much closer to full employment and has an unemployment rate of about 5%.
In the first policy scenario—increased farm labor supply—the number of temporary nonimmigrant foreign-born farm workers is assumed to increase by about 30,000 in Year 1 of the simulation and 83,000 in Year 2. The program’s growth rate declines in subsequent years, with participation reaching 156,000 additional workers in Year 15.The additional workers are assumed to be available to all agricultural sectors, including those that have been traditionally excluded by the H-2A program, such as dairy and most livestock production, and no constraint similar to the program’s minimum wage requirements is applied in the model.
In the second policy scenario—decreased unauthorized labor supply—the unauthorized workforce—agricultural and nonagricultural—is assumed to decrease by 2.1 million in absolute terms over the first five years of the scenario. Under this scenario in year five, the unauthorized workforce in the U.S. economy as a whole is 4.0 million people smaller than in the base forecast. Growth in the unauthorized workforce resumes thereafter but at a slower pace than in the base forecast. By Year 15, the projected size of the unauthorized workforce is 8.5 million, compared with 14.3 million in the base forecast, a difference of 5.8 million, or 40%.
| Variable | Scenarios | |
|---|---|---|
| Increased farm labor supply | Decreased unauthorized labor supply | |
| Assumed impact on labor supply (over 15 years) | +156,000 farmworkers | -5.8 million farm and nonfarm workers |
| Fruit, tree nuts, vegetables, and nurseries | ||
| Output | +1.1 to 2.0% | -2.0 to -5.4% |
| Exports | +1.7 to 3.2% | -2.5 to -9.3% |
| Other agricultural sectors | ||
| Output | +0.1 to 1.5% | -1.6 to -4.9% |
| Exports | +0.2 to 2.6% | -0.3 to-7.4% |
| Employment in agriculture | +1.7% | -3.4 to- 5.5% |
| U.S. born and foreign born permanent resident | -5.7% | +2.4 to 4.0% |
| Foreign born, not a permanent resident | +32.4% | -34.1 to -38.8% |
| Earnings per job in agriculture | -4.4% | +3.9 to 9.9% |
| U.S. born and foreign born permanent resident | -3.4% | +3.3 to 7.5% |
| Foreign born, not a permanent resident | -10.0% | +13.6 to 39.8% |
| Nonfarm employment of U.S. born and other permanent residents | Negligible effects on nonfarm economy | |
| Lower paying occupations | +2.2 to 3.2% | |
| Higher paying occupations* | -0.5 to -0.7% | |
| Nonfarm earnings of U.S. born and other permanent residents | ||
| Lower paying occupations | +1.7 to 4.5% | |
| Higher paying occupations* | -0.2 to -0.6% | |
| Gross National Product, less payment to unauthorized workers | -0.9 to -1.1% | |
The results from the increased farm labor supply scenario (presented in Table 1) conform to basic economic principles. Greater supply of temporary nonimmigrant farmworkers leads to their increased employment at lower wages. This, in turn, results in long-run increases in agricultural output and exports, above and beyond the growth projected by the base forecast. The increases in output and exports are generally larger in labor-intensive sectors such as fruit, tree nuts, vegetables, and nursery products. By Year 15 of the scenario, these four sectors experience a 1.1% to 2.0% increase in output and a 1.7% to 3.2% increase in exports, relative to the base forecast. Less labor-intensive sectors, such as grains, oilseeds, and livestock production, tend to have smaller increases, ranging from 0.1% to 1.5% for output and from 0.2% to 2.6% for exports.
Accompanying this additional growth in agricultural output and employment, however, would be a relative decrease of 5.7% in the number of U.S.-born and other permanent residents employed as farmworkers and a 3.4% relative decrease in their wage rate. In the model, U.S.-born and other permanent resident workers are assumed to compete with temporary nonimmigrant farmworkers in the labor market. A 3.4% relative decrease in the wage rate does not mean that wages are projected to fall by 3.4% over the 15-year period of the projection. Rather, it means that the wage rate in Year 15 is projected to be 3.4% lower in the increased farm labor supply scenario than in the base forecast.
The effects on agricultural output and exports in the second scenario modeled, in which unauthorized labor supply declines, are opposite in sign and larger in magnitude than those in the first scenario modeled. Fruit, tree nuts, vegetables, and nursery production are again among the most affected sectors, with long-run relative declines of 2.0% to 5.4% in output and 2.5% to 9.3% in exports. These effects tend to be smaller in other, less labor-intensive, sectors of agriculture—showing a 1.6% to 4.9% decrease in output and a 0.2% to 7.4% decrease in exports.
In the decreased unauthorized labor supply scenario, the number of unauthorized workers employed on farms falls by 34.1% to 38.8%, depending on modeling assumptions, relative to the base forecast for Year 15. At the same time, the number of farmworkers who are either U.S.-born or foreign-born permanent residents increases by 2.4% to 4.0% in the long run, compared with the base forecast, and their wage rate increases by 3.3% to 7.5%. However, the increased farm employment of U.S.-born and other permanent resident workers is not sufficient to offset the decrease in unauthorized farmworkers. As a result, the total number of farmworkers decreases by 3.4% to 5.5%.
Some observers question whether a reduction in the number of unauthorized workers would benefit or harm U.S.-born and other permanent resident workers. Our results suggest that wages would rise—relative to the base forecast—in some lower paying occupations where unauthorized workers are common, decrease slightly in many higher paying occupations, and decrease on average.
Several factors account for the slight decrease in earnings. First, the decrease in the supply of unauthorized labor leads to a long-run relative decrease in production, not just in agriculture but in all sectors of the economy. This, in turn, reduces incomes to many complementary factors of production, including capital, land, and U.S.-born and foreign-born permanent resident workers in higher paying occupations. Second, with fewer unauthorized workers, the occupational distribution of U.S.-born and other authorized workers necessarily shifts in the direction of more hired farm work and other lower paying occupations, such as food service, child care, and housekeeping, and away from higher paying occupations—a much larger category. The effect of this compositional change is to reduce the average real wage for authorized workers, even as real wages in many lower paying occupations rise. In the long term, overall gross national product accruing to the U.S.-born and to foreign-born permanent residents would fall by about 1%, compared with the base forecast.
In sum, the model captures some of the divergent economic interests at stake in the debate over immigration policy and agriculture. Farm employers benefited from the increased availability of temporary nonimmigrant farm workers, but wages fell for farm workers. A large, economy-wide reduction in the size of the unauthorized workforce, by contrast, raised wages in farm work and other lower paying occupations, but depressed agricultural output and exports. Moreover, total national income accruing to U.S.-born and foreign-born, permanent resident workers and to employers contracted as the size of the unauthorized workforce was reduced, and the occupational distribution of the workforce shifted toward hired farm labor and other lower paying jobs. This divergence of interests helps to explain why the debate over immigration policy continues.
Carroll, D., Georges.A, and Saltz, R (2011, May). Changing characteristics of U.S. farmworkers: 21 Years of findings from the National Agricultural Workers Survey. Presentation at conference entitled “Immigration Reform: Implications for Farm Workers, Farmers and Communities,” University of California, Washington, DC, campus. Available online: http://migration.ucdavis.edu/cf/files/2011-may/carroll-changing-characteristics.pdf.
Cave, D. (2011, July 6). Better Lives for Mexicans Cut Allure of Going North. New York Times. Available online: http://www.nytimes.com/interactive/2011/07/06/world/americas/immigration.html?scp=6&sq=mexican%20immigration&st=cse.
Georgia Department of Agriculture (2012, January). Report on Agricultural Labor as Required by House Bill 87. Atlanta: Author. Available online: http://agr.georgia.gov/Data/Sites/1/media/ag_administration/legislation/AgLaborReport.pdf.
Lofstrom, M., Bohn,S., and Raphael,S. (2011, March). Lessons from the 2007 Legal Arizona Workers Act. San Francisco: Public Policy Institute of California. Available online: http://www.ppic.org/main/publication.asp?i=915.
Martin, P (2012, First Quarter). Immigration and Farm Labor: What Next? Choices, 27(1). Available online: http://www.choicesmagazine.org/choices-magazine/policy-issues/immigration-and-farm-labor-what-next.
McCissick, J., and Kane, S. (2011, October 6). An evaluation of direct and indirect economic losses incurred by georgia fruit and vegetable producers in spring 2011—a preliminary data analysis and summary working paper. Athens, Georgia: University of Georgia, Center for Agribusiness and Economic Development. Available online: http://gfvga.org/wp-content/uploads/2011/10/Georgia-Fruit-and-Vegetable-Survey-Analysis-Preliminary-Report-10-6-2011.pdf.
Passel, J., and Cohn. D (2011, February 1). Unauthorized immigrant population: national and state trends, 2010. Washington, DC: Pew Hispanic Center. Available online: http://www.pewhispanic.org/files/reports/133.pdf.
Passel, J., and Cohn, D. (2009, April 14). A portrait of unauthorized immigrants in the United States. Washington, DC: Pew Hispanic Center. Available online: http://www.pewhispanic.org/files/reports/107.pdf.
Passel, J., Cohn, D., and Gonzalez-Barrera, A. (2012, April 23). Net migration from mexico falls to zero—and perhaps less. Washington, DC: Pew Hispanic Center. Available online: http://www.pewhispanic.org/files/2012/04/PHC-04-23-Mexican-Migration.pdf.
Turnbull, L. (2011, October 30). Washington apple growers scrambling to find workers. Seattle Times. Available online: http://seattletimes.nwsource.com/html/localnews/2016652587_farmlabor31m.html.
U.S. Department of Agriculture, National Agricultural Statistics Service (2012). Quick Stats 2.0 Beta. Available online: http://quickstats.nass.usda.gov/.
U.S. Department of Agriculture, National Agricultural Statistics Service (2007-11, various issues). Farm Labor. Available online: http://usda.mannlib.cornell.edu/MannUsda/viewDocumentInfo.do?documentID=1063.
U.S. Department of Homeland Security, Citizenship and Immigration Services (2012, April 5). E-Verify: About the Program: History and Milestones. Available online: http://www.uscis.gov/portal/site/uscis/menuitem.eb1d4c2a3e5b9ac89243c6a7543f6d1a/?vgnextoid=84979589cdb76210VgnVCM100000b92ca60aRCRD&vgnextchannel=84979589cdb76210VgnVCM100000b92ca60aRCRD.
U.S. Department of Homeland Security, Customs and Border Protection (2012). United States border patrol enacted border patrol program budget by fiscal year (dollars in thousands). Available online: http://www.cbp.gov/linkhandler/cgov/border_security/border_patrol/usbp_statistics/budget_stats.ctt/budget_stats.pdf.
U.S. Department of Homeland Security, Office of Immigration Statistics (2011, August). Yearbook of immigration statistics: 2010. Available online: http://www.dhs.gov/xlibrary/assets/statistics/yearbook/2010/ois_yb_2010.pdf.
U.S. Department of Labor, Bureau of Labor Statistics (2012). Consumer price index: CPI databases: all urban consumers (current series). Available online: http://www.bls.gov/cpi/data.htm.
U.S. Department of Labor, Employment and Training Administration (2012). H-2A temporary agricultural visa program: fy 2011 select statistics. Available online: http://www.foreignlaborcert.doleta.gov/pdf/h_2a_selected_statistics.pdf.
U.S. Department of Labor, Employment and Training Administration (2011, July 19). Foreign labor certification: annual report october 1, 2009 – september 30, 2010. Available online: http://www.foreignlaborcert.doleta.gov/pdf/OFLC_2010_Annual_Report_Master.pdf.
U.S. Department of Labor, Employment and Training Administration (2010, July 19). The foreign labor certification report: 2009 data, trends and highlights across programs and states:october 1, 2008 – september 30, 2009. Available online: www.foreignlaborcert.doleta.gov/pdf/2009_Annual_Report.pdf.
Zahniser, S., Hertz, T. Dixon, P, and Rimmer, M (2012, May). The potential impact of changes in immigration policy on u.s. agriculture and the market for hired farm labor: a simulation analysis, Economic Research Report, ERR-135. Washington, DC: U.S. Department of Agriculture, Economic Research Service. Available online: http://www.ers.usda.gov/.

