Arkansas, like most of the southern United States, experienced drought conditions in 2010 and 2011. Drought conditions developed in 2010 after a record wet 2009, and extreme summer temperatures prevailed throughout most of Arkansas that year. According to the National Oceanic and Atmospheric Administration, (NOAA) the largest 2010 precipitation deficits occurred in southern Arkansas, with departures from normal precipitation ranging from -17.85 inches in southwest Arkansas to -20.51 inches in southeast Arkansas (NOAA, 2010). Large precipitation deficits were also recorded in other parts of the state (-8.6 inches in western Arkansas; -13.96 inches in northeast Arkansas; -14.14 inches in central Arkansas) (NOAA, 2010). In 2011, record high temperatures and drought conditions continued in both the western and southern portions of the state, with precipitation deficits ranging from -15.3 inches in the south central portion of the state to -18.96 inches in the southwestern portion of the state (NOAA, 2011). The remainder of the state saw extreme flooding in late April and early May and for the most part had a precipitation surplus in 2011 (NOAA, 2011). This article reports on the impacts of the two drought years on Arkansas which has larger regional implications and considerations. Focus is placed on the areas of the state most affected by lack of precipitation and extreme high temperatures. Specifically, the paper highlights drought impacts on
Basic knowledge of the typography and land use across Arkansas is important when describing drought impacts for the state. Eco-regions and land cover information for Arkansas is presented in Figure 1 (Arkansas Forestry Commission, 2010). Row crop production occurs primarily in the eastern part of the state depicted as the Mississippi Alluvial Plain in Figure 1.
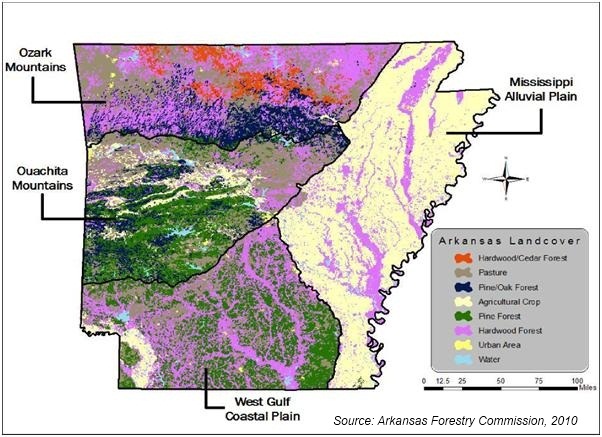
This portion of the state is flatter than other regions and accounts for nearly all of the state’s harvested rice, soybean, cotton, corn, wheat, and sorghum acres (USDA, NASS, 2012a). The southern portion of Arkansas is rolling in topography and is composed primarily of pine and hardwood forest with some crop and pasture land located in the southwest corner of the state. This region is depicted as the West Gulf Coastal Plain which accounts for over 20% of the state’s beef cattle production (USDA, NASS, 2012a) and the majority of the state’s commercial timberland area (Arkansas Forestry Commission, 2010). The northern and western portions of the state (depicted as the Ozark Mountains and the Ouachita Mountains) are composed of ridges, hills, and valleys covered by a variety of forest types (pine, hardwood, oak, cedar) and pasture land. These regions collectively account for approximately 65% of the state’s beef cattle (USDA, NASS, 2012a).
Drought severity across Arkansas during 2010 and 2011 is presented using U.S. Drought Monitor data in Figure 2 (National Drought Mitigation Center, 2012).
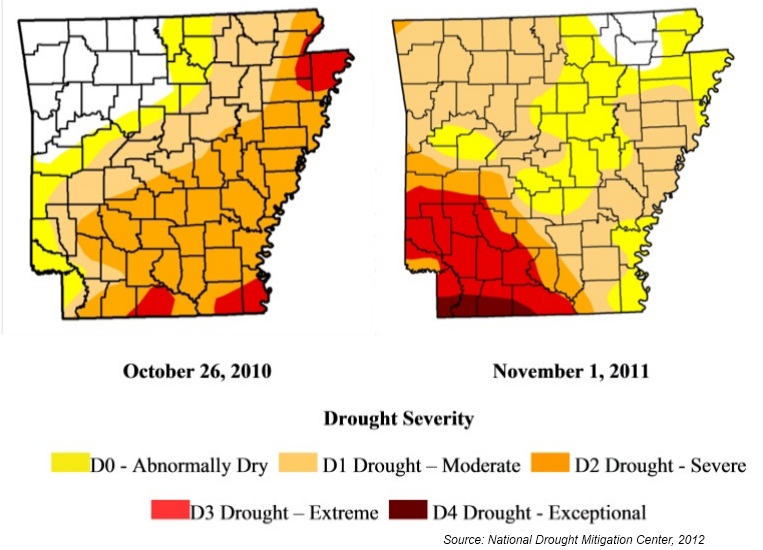
Drought severity is presented for two points in time, October 26, 2010 and November 1, 2011, roughly one year apart. Drought conditions ranged from severe to extreme in eastern and southern Arkansas during 2010, while drought conditions were extreme to exceptional in southwest Arkansas during 2011. In both years, the majority of the state was under moderate to extreme drought. It is evident from the data reported in Figure 2 that drought effects were most acute in the southern portion of the state, where drought effects ranged from severe to extreme during both years.
The areas of the state most severely affected by drought during 2010 and 2011 are heavily forested and have a large commercial timberland presence. Prolonged drought impacts trees through both stress and wildfires. Trees become drought stressed when there is not enough moisture in the soil to replace lost water leaving them vulnerable to insect pests, disease, death and fire. Severely drought stressed trees can die off four to five years after the initial drought period. There are no good numbers to quantify trees succumbing to drought stress in 2010 and 2011, but an estimated 10 to 15% of trees along I-30 between Arkadelphia and Texarkana, Arkansas have likely died due to drought stress (J. Barry, personal communication, January 19, 2012).
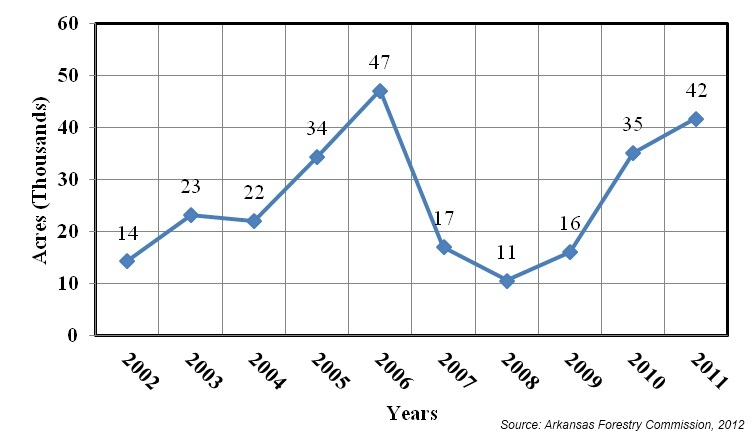
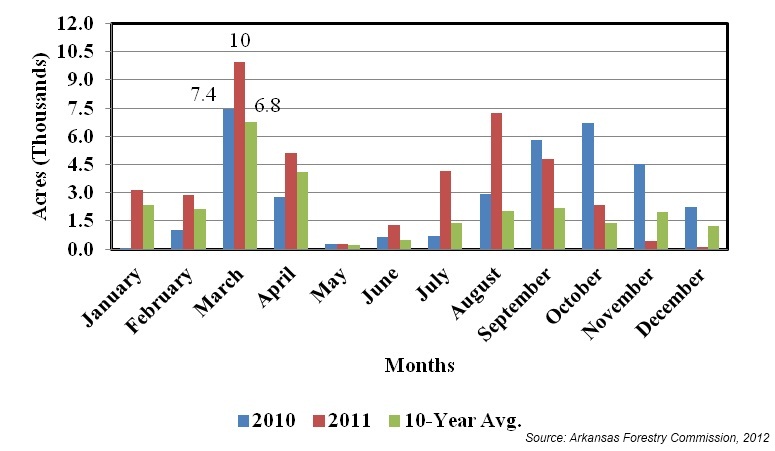
Wildfires are also more prevalent during periods of drought. The numbers of forest acres affected by wildfires in Arkansas per year for the period 2002 through 2011 are presented in Figure 3 (Arkansas Forestry Commission, 2012). The ten-year average for the period is 26 thousand acres. Affected acres for both 2010 and 2011 were above the ten-year average, as were affected acres in both 2005 and 2006, which were also dry years on record in Arkansas (NOAA, 2005; NOAA, 2006). Forest acres affected by wildfire per month for 2010 and 2011 are presented in Figure 4 (Arkansas Forestry Commission, 2012). Most of these wildfires occurred in the south and southwestern portions of the state where drought conditions were most acute in 2010 and 2011 and where most of the commercial timberland is harvested in the state. The recent drought has impacted the forest industry in Arkansas through loss of harvesting jobs and timber value, increased reforestation costs and increased wildfire control cost along with the lost environmental benefits of living forests. Reforestation is one way to replace commercially harvested timber, but drought can also increase the need for reforestation. Drought can necessitate the need for reseeding on stands that have already been reforested. Reforestation is costly, and the current drought is expected to have a major impact on reforestation efforts of both hardwoods and pine trees in Arkansas (M. Pelkki, personal communication, July 31, 2012).
The cost of combating and controlling wildfires also increases with drought. Recent changes in commercial timberland ownership in the state have affected wildfire control. Over the past decade, timberland ownership in Arkansas and the South has shifted largely away from vertically integrated forest products companies to institutional investors (M. Pelkki, personal communication, July 31, 2012). The primary driver of this ownership shift has been increased tax efficiency from moving to Real Estate Investment Trusts (REITs). These changes in timberland ownership have indirectly impacted the way wildfires are controlled in Arkansas. Most of the former vertically integrated forest product companies had firefighting components included to combat and control wildfires, whereas the new timberland owners do not. The cost of wildfire control is increasingly being born by both the Arkansas Forestry Commission (AFC) and local fire departments, and funding and resources (firefighter manpower for the AFC and equipment limitations for local fire departments) for both entities is limited (M. Pelkki, personal communication, July 31, 2012).
The cattle industry in Arkansas is composed primarily of small cow-calf operations with over 75% of all beef cow farms having less than 50 head of cattle (USDA, NASS, 2009). The drought of the past two years has had an impact on Arkansas cattle numbers. Pastures have suffered, particularly in the southwest portion of the state where the two years of drought have been most critical. The result has been a liquidation of cattle from these areas where pasture forage has disappeared.
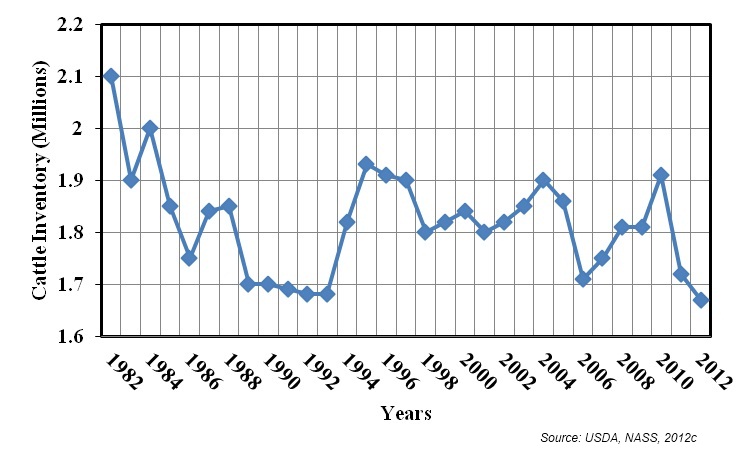
January 1 Arkansas cattle and calves inventory data are reported from 1982 through 2012 in Figure 5 (USDA, NASS, 2012c). Cattle inventories increased after 1993, peaking at 1.93 million head in 1995. Since 1993, Arkansas cattle inventories have remained within a range of 1.8 to 1.93 million head with the exception of four years: 2006, 2007, 2011, and 2012. In all four years, cattle inventories adjusted downward due to drought conditions (T. Troxel, personal communication, August 3, 2012). The low inventories of 1.71 and 1.75 million head observed in 2006 and 2007, respectively, reflect liquidation of cattle resulting from drought conditions occurring from May 2005 (NOAA, 2005) and extending until December of 2006 (NOAA, 2006). The low January 1 cattle inventories for 2011 and 2012 of 1.72 and 1.67 million head, respectively, also represent cattle liquidation resulting from drought conditions occurring in both 2010 and 2011, primarily in the south and southwest parts of Arkansas. The January 1, 2013 inventory will likely be lower than the 2012 number because Arkansas is currently in its third year of drought at the time of writing.
Replacement heifer inventories are also good numbers for gauging the impact of drought years on cattle numbers. Replacement heifers are either retained or purchased by cattle producers to maintain or increase the size of their cow herds for calf production. Thus upward or downward movement of this number gives some indication about herd rebuilding intentions of cattle producers. January 1 replacement heifer numbers for 1982 through 2012 are reported in Figure 6 (USDA, NASS, 2012c). Replacement heifer inventories track cattle inventories in most years. For example, replacement heifer inventories trended downward during the 1982 to1992 period, reflecting downsizing of cattle herds during this period.
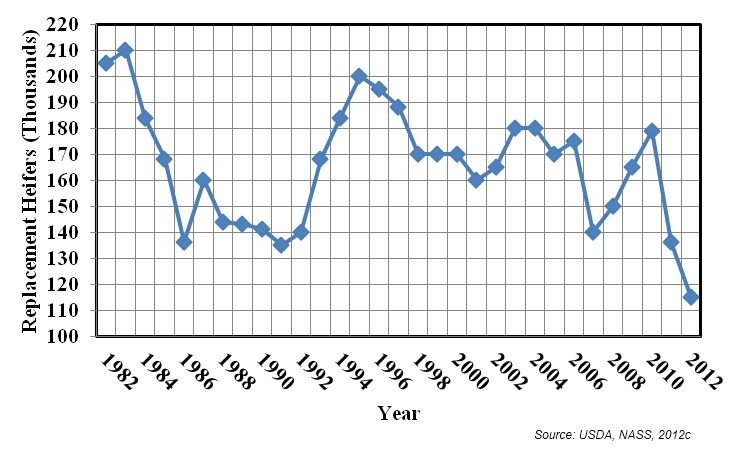
Replacement heifer inventories dropped from 179 thousand head in 2010 to 136 thousand head in 2011 and continued to fall to 115 thousand head in 2012. The cumulative drop in replacement heifer inventories from 2010 to 2012 represents the largest two year drop in inventories since 1982, and the 2012 inventory number of 115 thousand head is the lowest on record since 1961 (101 thousand head). Some of this drop in replacement heifer numbers can be attributed to profit taking resulting from cattle producers taking advantage of high cattle prices, but most of the drop is a direct result of drought conditions occurring in both years (S. Cheney, personal communication, August 6, 2012).
Arkansas hay area, production, and value numbers are presented for 2002 through 2011 in Table 1 (USDA, NASS, 2012b). Total hay production for Arkansas averaged 2.886 million tons over the 10-year period. Total hay production was below the 10-year average in 2005, 2006, 2010, and 2011, all years experiencing drought conditions, as mentioned above. Hay production was lower in the drought years of 2005 and 2006 than in the recent drought years of 2010 and 2011. This is likely due to the fact that drought conditions were more uniform across the state in the 2005 and 2006, whereas drought conditions were generally confined to the south and southwest portions of the state in 2010 and 2011 (NOAA, 2010; NOAA 2011).
| Year | Harvested Acres (Millions) | Yield (Tons per Acre) | Tons of Production (Millions) | Season Avg. Price (Dollars per Ton)1 | Dollar Value of Production (Millions)1 |
|---|---|---|---|---|---|
| 2002 | 1.430 | 2.31 | 3.303 | 91.99 | 303.8 |
| 2003 | 1,340 | 2.22 | 2.974 | 72.77 | 216.4 |
| 2004 | 1,420 | 2.51 | 3.570 | 65.08 | 232.3 |
| 2005 | 1,310 | 1.71 | 2.239 | 83.64 | 187.3 |
| 2006 | 1,465 | 1.72 | 2.519 | 104.34 | 262.8 |
| 2007 | 1,465 | 2.11 | 3.084 | 106.56 | 328.6 |
| 2008 | 1,405 | 2.21 | 3.111 | 93.29 | 290.2 |
| 2009 | 1,415 | 2.21 | 3.131 | 86.61 | 271.2 |
| 2010 | 1,480 | 1.81 | 2.681 | 87.60 | 234.9 |
| 2011 | 1,400 | 1.61 2 | 2.247 | 99.50 | 223.6 |
| Average | 1,413 | 2.04 | 2.886 | 89.14 | 255.1 |
Season average prices in real 2011 dollars are also reported in Table 1. One would expect hay prices to be higher for drought years than for nondrought years. On first glance however, it appears that hay prices can sometimes be low for drought years and sometimes be high for nondrought years. For example, the hay prices reported for the drought years of 2005 and 2010 are $83.64 and $87.60 per ton, respectively, both at or slightly below the 10-year average price of $89.14 per ton. The hay price reported for 2007 (a nondrought year) is $106.56 per ton, followed by 2006 ($104.34 per ton) and 2011 ($99.50 per ton). This discrepancy in prices is due to the way season average hay prices are calculated by the National Agricultural Statistics Service (NASS) for Arkansas. NASS calculates season average Arkansas hay prices from May of the previous year to April of the current year. Therefore, a more accurate hay price for the current year would be the hay price reported the following year. Thus the 2006 hay price of $104.34 per ton more closely represents the actual hay price observed in 2005, the 2007 hay price of $106.56 per ton more closely represents the actual price observed in 2006, and the 2011 hay price of $99.50 per ton more closely represents the actual price observed in 2010 by cattle producers. The hay price that will eventually be recorded for 2012 is expected to be higher than that observed for 2011. Many cattle producers with depleted pastures began feeding hay in July or August of 2011 and ran quickly through their hay reserves. Most cattle producers trying to hold cattle through the summer months were compelled to purchase hay of varying types and quality from distant locations (other parts of Arkansas or from as far away as Mississippi and Missouri).
Row crop production occurs mostly in eastern Arkansas. During normal growing years, this region receives a large amount of precipitation, ranging from 46 inches per year in northeastern Arkansas to 52 inches per year in southeastern Arkansas (NOAA, 2009). However, most of this precipitation falls during the winter and early spring months. From late spring through early summer most precipitation in eastern Arkansas falls as rain from widely scattered thunderstorms, which is often insufficient for crop production (Schrader 2010). Consequently, most eastern Arkansas row crop farmers depend heavily on irrigation water to grow their crops. Nearly 80% of Arkansas’ harvested cropland acres in 2011 were irrigated (Table 2). All rice acres and nearly all cotton acres were irrigated, while over three quarters of all soybean and corn acres were irrigated in 2011 (USDA, NASS, 2012a).
| Crop | Irrigated | Nonirrigated | Total | Irrigated Percent | Nonirrigated Percent |
|---|---|---|---|---|---|
| Rice | 1,154,000 | 0 | 1,154,000 | 100% | 0% |
| Soybean | 2,618,000 | 652,000 | 3,270,000 | 80% | 20% |
| Cotton | 590,000 | 70,000 | 660,000 | 89% | 11% |
| Corn1 | 514,229 | 137,771 | 652,000 | 79% | 21% |
| Wheat | 0 | 520,000 | 520,000 | 0% | 100% |
| Sorghum1 | 31,617 | 58,383 | 90,000 | 35% | 65% |
| Total | 4,876,229 | 1,379,771 | 6,256,000 | 78% | 22% |
| Average | 1,413 | 2.04 | 2.886 | 89.14 | 255.1 |
Most irrigation water is supplied by wells tapping into the Mississippi River Valley alluvial aquifer, which underlies nearly all of eastern Arkansas (Schrader 2010). Much more water needs to be applied during extremely dry growing seasons. This translates into higher pumping costs and reduced profit margins for producers. Groundwater is also an exhaustible resource in many parts of eastern Arkansas. Extensive pumping has caused a steady depletion of the alluvial aquifer in many areas of eastern Arkansas (Czarnecki 2010; Gillip and Czarnecki 2009; Schrader 2010), and several counties in eastern Arkansas have either partially or totally been designated as critical groundwater areas because of significant groundwater declines resulting from intensive irrigation (Czarnecki 2010; Gillip and Czarnecki 2009).
The two years of drought have also had a negative impact on production of the state’s most intensively irrigated crop: rice. Arkansas is the leading producer of rice in the United States, accounting for nearly 48% of U.S. rice production (Childs 2012). The rice crop suffered in 2010 and 2011 because of high night time temperatures associated with the drought. High night time temperatures negatively affect rice in two ways: 1) increased incidence of bacterial panicle blight; and 2) heat stressed rice kernels. Bacterial panicle blight is a disease that thrives during very hot years having high night time temperatures during July and August. Heat stressed kernels occur most frequently during growing seasons with high night time temperatures above 75 degrees Fahrenheit. Most commercial rice varieties grown in Arkansas are susceptible to high night time temperature, and both rice yields and quality were affected by high night time temperatures in 2010 and 2011.
The 2010 and 2011 drought years have impacted Arkansas. Impacts were largely localized in the south and southwestern portions of the state. The areas that were most affected by the 2010 and 2011 drought years were the cattle and forestry sectors. Row crops were least affected by the drought years because of irrigation. The main effects of the drought on row crops were higher pumping costs and continued downward pressure on an already limiting resource—groundwater. Some locations responded to limited groundwater supplies by constructing on-farm reservoirs to capture precipitation and field runoff. However, many of these reservoirs are drying up and making crop producers one again dependent on groundwater.
Drought impacts on trees will likely be seen several years into the future as severely drought stressed trees continue to die off and wildfires continue to burn throughout the state. Reforestation and wildfire control costs are expected to increase as Arkansas continues into its third consecutive year of drought. The AFC which is charged with fighting most wildfires in the state is currently facing a funding shortfall and is seeking appropriations from the Arkansas State Legislature to carry it through the 2012 fiscal year. Thus a large portion of these costs will likely be paid by taxpayers in the future.
The Arkansas cattle industry is also likely to see a continuation of herd liquidations in 2012 into 2013, as pastures remain severely stressed by extreme drought conditions. Herd rebuilding will be a costly endeavor in the future for Arkansas cattle producers. The large scale liquidation of cattle that occurred in Arkansas during the two drought years also occurred in Texas, Oklahoma, and other states heavily hit by drought. The result will be tighter beef supplies and higher prices in the future for replacement heifers, and cattle producers will have a harder time financing future herd rebuilding.
This article paints a picture of the varied impacts of the 2010 and 2011 drought years on Arkansas that will be familiar to those in other drought affected states. The diversity of Arkansas forestry and agricultural enterprises affected by drought as presented in this article has been provided as a context for impacts experienced in other states. This article did not quantify the economic losses to the state as a result of the two years of drought. It also did not account for indirect effects on the Arkansas economy as a result of the drought years, such as lost jobs, lost income, and reduced value added. These efforts are currently under way.
Arkansas Forestry Commission. (2010). Arkansas statewide forest resources assessment and strategy. Little Rock, Arkansas: Author. Available online: http://forestry.arkansas.gov/SiteCollectionDocuments/ArkansasForestryCommAssessment.pdf
Arkansas Forestry Commission. (2012). Monthly fire and acreage Statistics, 2002-2011. (Unpublished Data). Little Rock, Arkansas.
Childs, N. (2012). 2010/11 rice yearbook. (No. RCS-2012). Washington, D.C.: U.S. Department of Agriculture, Economic Research Service. Available online: http://usda01.library.cornell.edu/usda/current/RCS-yearbook/RCS-yearbook-04-09-2012.pdf
Czarnecki, J.B. (2010). Groundwater-flow assessment of the Mississippi River Valley alluvial aquifer of northeastern Arkansas. (U.S. Geological Survey Scientific Investigations Report No. 2010–5210). Reston, Virginia: U.S. Department of the Interior, U.S. Geological Survey.
Gillip, J.A., and Czarnecki, J.B. (2009). Validation of a ground-water flow model of the Mississippi River Valley alluvial aquifer using water-level and water-use data for 1998-2005 and evaluation of water-use scenarios. (U.S. Geological Survey Scientific Investigations Report No. 2009-5040). Reston, Virginia: U.S. Department of the Interior, U.S. Geological Survey.
National Drought Mitigation Center. (2012). Drought monitor archives. Lincoln, Nebraska. Author. Available online: http://droughtmonitor.unl.edu/archive.html
National Oceanic and Atmosphere Administration. (2005). Drought in Arkansas (2005 statistics). Little Rock, Arkansas: NOAA, National Weather Service Weather Forecast Office. Author. Available online: http://www.srh.noaa.gov/lzk/?n=drought05yr.htm
National Oceanic and Atmosphere Administration. (2011). Historic weather events in Arkansas, 2011 - final report. Little Rock, Arkansas: NOAA, National Weather Service Weather Forecast Office. Author. Available online: http://www.srh.noaa.gov/lzk/?n=bigevents.htm
National Oceanic and Atmosphere Administration. (2010). Historic weather events in Arkansas, 2010 - final report. Little Rock, Arkansas: NOAA, National Weather Service Weather Forecast Office. Author. Available online: http://www.srh.noaa.gov/lzk/?n=bigevents.htm
National Oceanic and Atmosphere Administration. (2009). Historic weather events in Arkansas, 2009 - final report. Little Rock, Arkansas: NOAA, National Weather Service Weather Forecast Office. Author. Available online: http://www.srh.noaa.gov/lzk/?n=bigevents.htm
National Oceanic and Atmosphere Administration. (2006). Historic weather events in Arkansas, 2006 - final report. Little Rock, Arkansas: NOAA, National Weather Service Weather Forecast Office. Author. Available online: http://www.srh.noaa.gov/lzk/?n=bigevents.htm
Schrader, T.P. (2010). Water levels and selected water-quality conditions in the Mississippi River Valley alluvial aquifer in eastern Arkansas, 2008 (U.S. Geological Survey Scientific Investigations Report No. 2010-5140). Reston, Virginia: U.S. Department of the Interior, U.S. Geological Survey.
U.S. Department of Agriculture, National Agricultural Statistics Service. (2009). 2007 census of agriculture, Arkansas state and county data. (Volumn 1, Geographic Area Series, Part 4, No. AC-07-A-4). Washington, D.C.: U.S. Department of Agriculture, National Agricultural Statistics Service. Author. Available online: http://www.agcensus.usda.gov/Publications/2007/Full_Report/Volume_1,_Chapter_1_State_Level/Arkansas/arv1.pdf
U.S. Department of Agriculture, National Agricultural Statistics Service. (2012a). Arkansas county estimates. Washington, D.C. Available online: http://www.nass.usda.gov/Statistics_by_State/Arkansas/Publications/County_Estimates/index.asp
U.S. Department of Agriculture, National Agricultural Statistics Service. (2012b). Hay: Acreage, Yield, Production, Price and Value. Washington, D.C. Available online: http://www.nass.usda.gov/Statistics_by_State/Arkansas/Publications/Statistical_Bulletin/Historical_Data/histhay.pdf
U.S. Department of Agriculture, National Agricultural Statistics Service. (2012c). Quick stats. Washington, D.C. Available online: http://www.nass.usda.gov/Quick_Stats/

