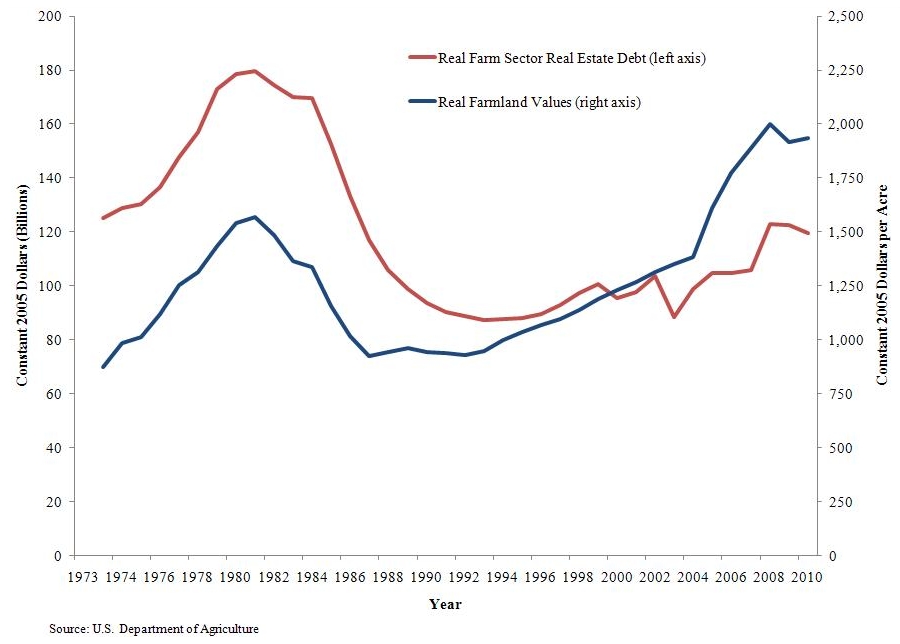
Recent farm sector trends, including rising debt and declining income, have led to comparisons between agriculture’s current economic environment and the period leading up to the farm financial crisis. Between 1970 and 1980, inflation-adjusted farm sector debt grew rapidly, expanding by 5.6% annually. Over the most recent decade, inflation-adjusted farm sector debt was still climbing an average of 4% per year, and the USDA currently projects inflation-adjusted debt to be at its highest level since the early 1980s. After inflation-adjusted net farm income declined nearly 50% between 1973 and 1979, a sharp rise in interest rates in the late 1970s—as well as other factors—led to a wave of financial stress in many agricultural sectors. As of 2016, net farm income has also declined by 50% from its 2013 peak, and a rising interest rate environment is expected as the Federal Reserve transitions toward tighter monetary policy.
In the 1980s, the concurrent trends of higher debt, lower income, and rising interest rates combined with other factors to increase farm debt repayment challenges. This article considers whether today’s rising interest rate environment could also lead to increased farm sector repayment risk. Analyzing the impact of several interest rate path scenarios on farm repayment risk suggests that the sector remains well positioned to handle interest rate increases within a likely range. However, farmers starting from a worse financial position and farmers with a larger share of variable-rate debt may face greater financial stress.
Rising interest rates can place downward pressure on farmland values in part by reducing the current value of income farmland can produce in the future. Since farmland makes up over 80% of the total value of farm assets, a reduction in farmland values could increase the sector’s debt-to-asset ratio, increasing the risk of insolvency. But the farm sector remains relatively well insulated from potential solvency impacts because its debt-to-asset ratio, a common measure of solvency, remains relatively low by historical standards.
Higher interest rates will also mean that farmers will need to pay more for new or variable-rate credit over the next several years. Agricultural finance institutions commonly compare farmers’ projected principal and interest payments to their cash flow available to service their debt, often referred to as repayment capacity (Barry and Ellinger, 2012). Therefore, some borrowers could find it more difficult to qualify for new credit in a higher interest rate environment when interest payments climb relative to cash flows.
Borrowers may also find it more difficult to service their debt in a rising interest rate environment. The agricultural sector has endured lower income levels as commodity prices adjusted downward more quickly than input costs (Patrick, Kuhns and Borchers, 2016). Despite increasing the last several years, delinquency rates on farm real estate loans at commercial banks and Farm Credit institutions have remained low relative to the Great Recession and the 1980s farm financial crisis (FDIC, 2017; FCA, 2017). However, delinquency rates could increase in the future if interest rates continue to rise. Direct and indirect effects of the Federal Reserve’s monetary tightening suggest the possibility for additional commodity price declines (Henderson, 2018). This could further reduce the income farmers have available to make their principal and interest payments. Borrowers taking on new loans, renewing operating lines, or holding debt with a variable rate that adjusts higher as interest rates rise may also find it more difficult to service their debt as interest payments rise relative to income levels.
Measures of solvency like the debt-to-asset ratio are often used to gauge the farm sector’s financial position, but they are not a good measure of the farm sector’s ability to repay outstanding debt since they don’t reflect farmers’ income levels. An alternative is to compare the level of debt to the sector’s cash flows (Ellinger, Featherstone, and Boehlje, 2016). Comparing the ratio of debt to earnings before interest, taxes, and capital consumption (EBITC) provides a general measure of the farm sector’s debt relative to money available to pay principal and interest. The sector’s debt-to-EBITC ratio has been climbing over the last several years (Figure 1), reaching a recent high of 2.81 dollars of debt per dollar of annual cash flow. This implies building liabilities compared to the sector’s income stream, yet this only tells part of the story.
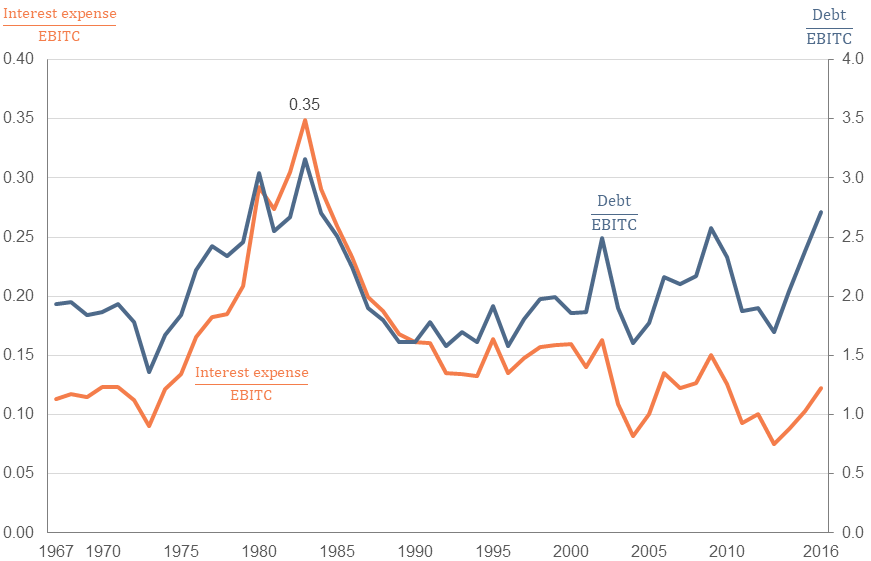
Source: Author’s calculations using USDA (2018).
Equally central to understanding the sector’s repayment position is how well the sector can handle required interest payments. The ratio of interest expenses to EBITC shows the percentage of cash flows the farm sector has to spend just to cover the interest on its outstanding debt. A rising ratio could indicate growing debt repayment challenges because a greater share of available income is needed to make interest payments. The interest-expense-to-EBITC ratio steadily increased in the late 1970s and early 1980s and reached a record high in 1983, with interest expenses accounting for a record 35% of the sector’s income stream. Despite increasing since 2013, the value is estimated at 12.2% in 2016.
Combining the information from both ratios shows that the farm sector’s financial position has benefitted from a lower interest rate environment. Interest expenses have not grown as quickly relative to cash flows, despite rising debt levels. This stands in contrast to the 1980s, when the farm sector’s high debt-to-EBITC ratio coincided with historically high interest-expense-to-EBITC ratios. At that time, farmers had a relatively large amount of debt and it was costly to service. Although interest rates are unlikely to return to 1980s levels in the short term, rising rates will still put upward pressure on the sector’s interest costs and likely increase repayment issues.
Citing a strengthening U.S. economy, the Federal Reserve began the process of transitioning away from the near-zero interest rate environment during the December 2015 Federal Open Market Committee (FOMC) meeting. The FOMC has implemented four additional 25-basis-point (bp) rate increases since that time and signaled that further upward movement is likely if the economy stays on its current path. Additionally, the FOMC began to gradually reduce holdings of long-term U.S. treasury bonds and mortgage-backed securities, which may put upward pressure on long-term rates.
Source: St. Louis Federal Reserve (2018) and Kansas
City Federal Reserve (2017)
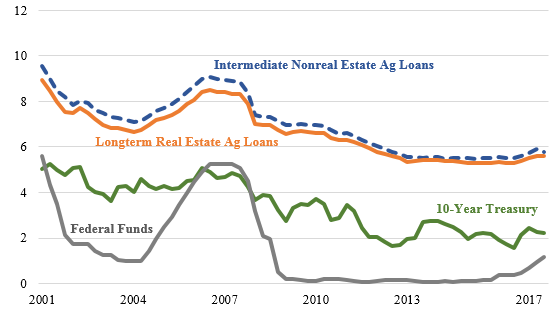
Although a rising interest rate environment is expected, whether this will lead to challenges repaying debt is uncertain. Changes in interest rates on short-term farm loans, like operating credit, tend to follow the Federal Funds rate. On the other hand, changes in interest rates on fixed-rate agricultural real estate loans and intermediate non–real estate loans tend to track changes in the 10-year treasury rather than the Federal Funds rate (Figure 2). To gauge the potential impacts of rising farm borrower costs, we consider changes in the farm sector’s debt-to-EBITC and interest-to-EBITC ratios under a baseline interest rate path scenario and an alternative scenario where rates rise more quickly. As a baseline interest rate scenario, we use data on 2017 farm interest rates from the Agricultural Finance Databook (Kansas City Federal Reserve, 2017) as well as median January 2018 Wall Street Journal (WSJ, 2018) economist survey forecasts for the Federal Funds rate (up 70bps in 2018 and 64.25 bps in 2019) and the 10-year treasury (up 48 bps in 2018 and 37.5 bps in 2019). To analyze the effects of a quicker rise in interest rates, we use the 90th percentile rather than median values of the WSJ survey economist predictions for the Federal Funds rate (up 82.5 bps in 2018 and 90.5 bps in 2019) and 10-year treasury (up 79 bps in 2018 and 69.5 bps in 2019).
In each scenario, we use the USDA official estimates of farm sector debt, interest expense, and cash flow through 2016. Roughly 27% of both farm real estate and non–real estate debt with a term longer than 1 year has a variable interest rate (USDA, 2015). Since more than 75% of this variable-rate debt is listed as repricing annually, to simplify the analysis all variable-rate debt is assumed to adjust to the current interest rate level each year. We also assume that the USDA’s November 2017 forecast of 4.6% growth in real estate debt and 0.4% growth in non–real estate debt continues through 2019, with the new debt entering the sector’s balance sheet at prevailing interest rates.
Note: The baseline scenario assumes the federal funds
rate increases by 70bps in 2018 and 64.25 bps in 2019,
while the 10-year treasury rises 48 bps in 2018 and
37.5 bps in 2019. Debt is assumed to continue growing
at the rate USDA projects for 2017.
Source: Author’s calculations using USDA (2018).
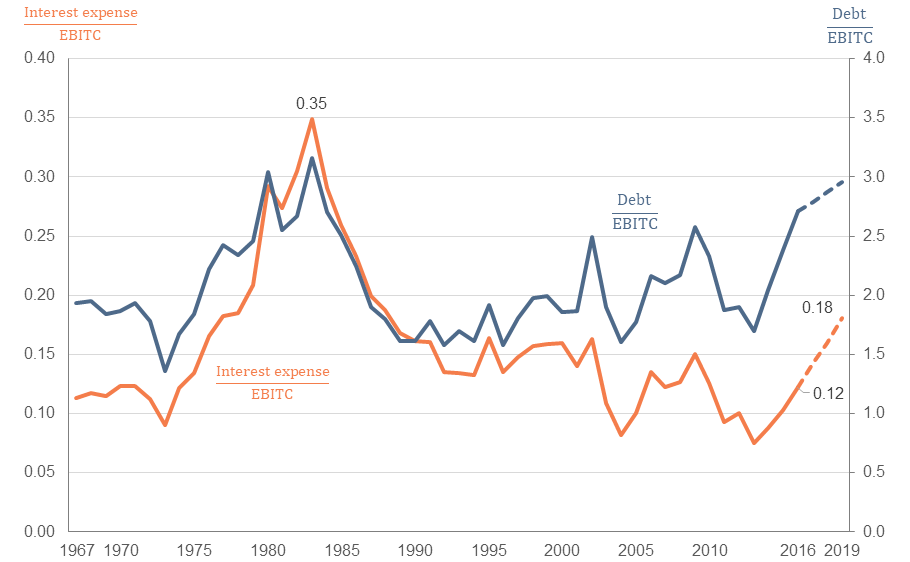
Given the simple debt growth assumptions used in both scenarios, the farm sector’s debt-to-EBITC ratio would continue rising, reaching nearly 3.0 in 2019 (Figure 3). If farmers add debt and cash flows remain similar to today’s levels, this ratio could approach its 1980s peak in the near future. The recent lower interest rate environment allowed the sector to keep the interest-to-EBITC ratio at historically low levels despite higher debt, but our analysis suggests it could increase in a rising interest rate environment. Under our baseline interest rate scenario, the sector’s interest-to-EBITC ratio is projected to reach 0.17 by 2019 (Figure 3). This value is higher than today but largely in line with the relatively stable levels seen in the 1990s and early 2000s. While a rising interest-to-EBITC ratio does signal the potential for increased repayment stress in the farm economy, the projected values remain well below the levels throughout the 1980s.
Under the faster rate increase scenario, interest-to-EBITC would be somewhat higher, reaching 0.18 in 2019. As expected, if farmers continued to borrow at the same levels, faster interest rate increases would increase the degree of repayment stress in the sector. But again, the interest-to-EBITC ratio would be lower than it was during the farm financial crisis, where the value remained above 0.25 from 1980 to 1985. For the interest-to-EBITC ratio to reach 0.25 by 2019, interest rates would have to rise by an additional 4–4.5 percentage points beyond the increase assumed in the quicker interest rate increase scenario. Based on the Federal Reserve’s stated interest rate policy goals, this outcome seems unlikely.
Since today’s interest rate environment is more favorable relative to the 1980s, many farmers appear to be better positioned to service their debt. But our analysis assumed that farmers’ cash flows remain constant. Upward pressure on expenses or further reductions in commodity prices over the next few years would lead to reduced profitability and additional debt repayment challenges. In addition to increasing interest expenses, a rising interest rate environment could also lead to downward pressure on commodity prices. However, Henderson (2018) considers the complex interaction between a rising interest rate environment, exchange rates, and supply and demand in determining commodity prices. His results indicate that higher interest rates could lower commodity prices, which would lead to more debt repayment challenges than our scenarios indicate. But Henderson also concludes that supply and demand fundamentals are likely to remain larger drivers.
Note: The baseline scenario assumes the federal funds rate increases by 70bps in 2018 and
64.25 bps in 2019, while the 10-year treasury rises 48 bps in 2018 and 37.5 bps in 2019. The
quicker scenario assumes a faster rise in the federal funds rate (up 82.5 bps in 2018 and
90.5 bps in 2019) and 10-year treasury (up 79 bps in 2018 and 69.5 bps in 2019). Both
scenarios assume debt continues to grow at the rate USDA projected for 2017.
Source: Authors’ calculations using stated interest rate scenarios and USDA (2018).
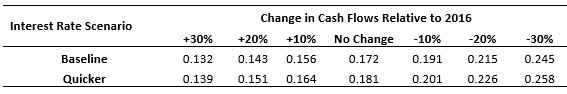
To better understand how changing income levels could interact with rising interest rates and affect the farm sector’s ability to repay debt, we calculate interest-to-EBITC ratios under alternative cash flow scenarios (Figure 4). If cash flows rise relative to current levels, interest-to-EBITC will not rise as quickly. However, if cash flows were to continue trending lower over the next several years, repayment stress is likely to increase. A further 10% drop in cash flows, for example, would cause the sector’s interest-to-EBITC ratio to exceed 0.2 under the quicker interest rate increase scenario. Either interest rate scenario would see the ratio climb into the vicinity of 0.25—a level last reached during the farm financial crisis—if cash flows were to fall 30% between 2016 and 2019. This reinforces the idea that, although the sector should be able to handle the expected interest rate increases if cash flows remain near recent levels, further income declines could lead to greater financial stress.
In addition to fluctuating income levels, several other assumptions used in the analysis could lead to the actual impact of rising interest rates being different than our scenarios suggest. Assuming all variable-rate debt adjusts each year simplifies the analysis, but likely overestimates interest-to-EBITC ratio’s sensitivity to interest rate changes. Additionally, if producers act to minimize their sensitivity to rate increases over the next several years, either by reducing their reliance on variable-rate debt or increasing debt levels less quickly, then the scenarios may also overstate the actual impacts. The use of U.S level data obscure differences likely to manifest at a more granular level. In the next section, we use USDA’s Agricultural Resource Management Survey (ARMS) data to better understand how different types of farms may be impacted in a rising interest rate environment.
Source: Author’s calculations using USDA (2015) and
USDA (2016).
Even when the farm sector as a whole appears to be able to handle rising interest rates, individual farms will be affected differently. Rising interest rates could be particularly impactful for farms with a greater share of variable interest rates on debt already on their balance sheets or those that already have worse debt repayment measures. Since these characteristics vary across different types of operations throughout the farm sector, rising interest will impact various parts of the farm sector differently.
The type of commodity primarily produced on the farm affects not only the income received but also the type and volume of capital needed to adequately run a farm. Farms specializing (>50% of value of production from a particular commodity) in livestock production, particularly poultry, tend to finance more capital through debt than similarly sized farms producing other commodities (Ifft, 2014). Each livestock-specialized farm type had a higher debt-to-EBITC ratio (ranging from 2.27 to 3.54) than every crop-specialized farm type (ranging from 0.92 to 2.11) except for wheat (3.36) in 2016 (Figure 4). A similar pattern holds for the interest-to-EBITC ratio in 2016, which indicates that interest expenses represent a larger share of cash flows for all livestock-specialized farm types (ranging from 0.09 to 0.12) compared to crop-specialized farm types (ranging from 0.04 to 0.07) except for wheat (0.16).
Taking this together, wheat-specialized farms may have faced more debt repayment challenges than other commodity sectors in 2016, when wheat prices were low by historical standards. It also shows that livestock operations tend to have higher ratios of debt and interest to cash flow. This could put these production specializations under greater financial stress if their cash flow declines or interest rates rise.
Note: Young and Beginning Farmer is defined as a farmer that substantially participated in the
operation of a farm for not more than 10 years.
Source: USDA (2015).
However, rising interest rates don’t necessarily translate to more debt payment issues unless previously acquired debt has a variable interest rate. An individual farmer’s decision between fixed and variable interest rate debt depends on their risk preferences and the different terms associated with variable and fixed rate financing options. For example, a variable rate loan will often have a lower interest rate than a fixed rate loan with a similar maturity because the borrower is assuming interest rate risk. Each borrower must determine if the interest rate savings are worth the additional risk associated with rising rates. Although this likely varies based on farmers’ risk preferences, the share of variable-rate debt is fairly stable between commodity specializations, ranging from 25% to 33% (Figure 4). The hog sector is an exception, with only 16% of debt with a variable interest rate indicating that hog farms may be more resilient in a rising interest rate environment. On the other side of the spectrum, specialty-crop operations had the highest proportion of variable-rate debt (33%) but also may be more resilient to rising interest rates because they are starting from a less risky debt- and interest-to-EBITC position.
Characteristics of the farm operator, including age and years of experience operating a farm, can also impact an operation’s borrowing needs (Ifft, 2014) and sensitivity to rising interest rates. The USDA’s Farm Service Agency’s loan programs enable young and beginning farmers (substantially participated in the operation of a farm for not more than 10 years) access to loans with lower fixed interest rates, which may be unavailable to established farmers (substantially participated in the operation of a farm for more than 10 years). This may be one reason why 23% of debt held by young and beginning farmers had a variable interest rate compared to 28% for established farmers and young and beginning farmers’ variable-rate debt tended to adjust less frequently (Figure 5). Young and beginning farmers’ reduced reliance on variable-rate debt indicates that they may be relatively less impacted by rising interest rates.
Farm income and debt trends have prompted comparisons with the 1980s farm financial crisis. Rising debt levels and lower farm income have led the farm sector’s debt relative to cash flows to approach levels last observed during the 1980s, a potential sign of debt repayment challenges in the agricultural economy. But the low interest rate environment over the last several years has made it relatively inexpensive to service interest payments on borrowed funds. Based on a simple analysis of several plausible future interest rate scenarios that conservatively assumes farmers do not adjust borrowing behavior, the farm sector currently remains unlikely to see debt repayment challenges, as proxied by the interest-to-EBITC ratio, rise to 1980s levels. While the farm sector currently appears to have the financial strength to handle rising interest rates overall, additional income declines could lead to greater debt repayment issues.
Yet, not all farms will be well positioned to handle rising interest rates. Farms with more debt on their balance sheet relative to cash flows, farms that need a greater share of their cash flows to pay interest expenses, and farms with a greater proportion of variable-rate debt will likely be impacted the most. Livestock and wheat farms had higher levels of debt and interest relative to cashflows in 2016. While these commodity specializations may be starting from a less ideal financial position, higher interest rates won’t necessarily impact these farms if they have fixed rate debt. Farmers will have to contend with rising interest rates driven by factors outside their control, but they remain able to choose the amount of debt and proportion of variable rate financing that makes sense for their operation.
Barry, P., and P. Ellinger. 2012. “Credit Risk Assessment and Capacity-Borrower Relationships” In P. Barry and P. Ellinger (eds.), Financial Management in Agriculture, 7th ed. Boston: Prentice Hall, pp. 85–99.
Ellinger, P., A. Featherstone, and M. Boehlje. 2016. “Leverage of U.S. Farmers: A Deeper Perspective.” Choices 31(1):1–6.
Farm Credit Administration. 2017. Call Report Data. Available online: https://www.fca.gov/exam/data_download.html
Federal Deposit Insurance Corporation. 2017. Consolidated Reports of Condition and Income. Available online: https://www.fdic.gov/regulations/resources/call/index.html
Henderson, J. 2018. ”Monetary Tightening Could Mean Lower Agricultural Commodity Prices if Historical Relationships Hold.” Choices 33(1).
Ifft, J., A. Novini, and K. Patrick. 2014. Debt Use by Farm Businesses, 1992–2011. Washington, D.C.: U.S. Department of Agriculture, Economic Research Service, Economic Information Bulletin 122, April.
Kansas City Federal Reserve. 2017. Agricultural Finance Databook. Available online: https://www.kansascityfed.org/research/indicatorsdata/agfinancedatabook
Patrick, K., R. Kuhns, and A. Borchers. 2016. “Recent Trends in U.S. Farm Income, Wealth, and Financial Health.” Choices 31(1):1–7.
St. Louis Federal Reserve. 2018. Federal Reserve Economic Database. Available online: https://fred.stlouisfed.org/
Wall Street Journal. 2018. Economic Forecasting Survey. Available online: http://projects.wsj.com/econforecast/
U.S. Department of Agriculture. 2015 Agricultural Resource Management Survey. Washington, DC: U.S. Department of Agriculture, Economic Research Service and National Statistical Service.
U.S. Department of Agriculture. 2016 Agricultural Resource Management Survey. Washington, DC: U.S. Department of Agriculture, Economic Research Service and National Statistical Service. Available online: https://www.ers.usda.gov/data-products/arms-farm-financial-and-crop-production-practices/arms-data/
U.S. Department of Agriculture. 2018. Farm Income and Wealth Statistics. Washington, DC: U.S. Department of Agriculture, Economic Research Service, February. Available online: https://www.ers.usda.gov/data-products/farm-income-and-wealth-statistics.aspx

