Railroads are a primary source of transportation for agricultural products in the United States. Over the last 35 years there have been numerous changes within this industry, beginning with the partial deregulation of the industry through the Staggers Rail Act of 1980. This Act provided railroads more pricing flexibility, and also eased the legal impediments to mergers as well as the abandonment of unprofitable rail lines. As such, real rates and costs fell dramatically following passage of the Staggers Act. In addition, the years following the passage of this legislation saw massive consolidation of the nation’s largest railroads, the so-called Class 1 carriers (MacDonald and Cavalluzzo, 1996; Bitzan and Wilson, 2007). A large economic literature has documented some of the impacts of this 1980 Act (Wilson, 1994; Wilson, 1997; MacDonald and Cavalluzzo, 1996; Winston, 1993). At present, there are a new set of factors affecting the transportation of agricultural products by rail, making it useful to reexamine this industry in the context of the major provisions of the Staggers Act along with some of the changes that have resulted from partial deregulation.
The rail industry has been regulated since passage of the Interstate Commerce Act of 1887. This regulation was primarily aimed at the perceived problems associated with railroad behavior in markets in which there were few alternative railroads present, such as markets with one railroad acting as a monopolist. As such, the federal regulation was geared towards setting guidelines for how railroads could conduct business, including their rate policies, track operated, and merger activity. Indeed, virtually all rates were subject to regulation after the passage of this legislation, along with tremendous impediments to merger activity and strict rules regarding the abandonment of rail lines. However, over time, both new sources of competition—such as from truck and barge as well as new products like plastics—negatively impacted the industry. These negative impacts, along with the regulatory environment in which railroads operated, limited the ability of these firms to adapt and adjust to these changes. By the 1970s, the industry was largely in financial ruin, with many railroads in bankruptcy. Policymakers recognized the need for revamping regulation, and responded with the passage of the Railroad Revitalization and Regulatory Reform Act of 1976 and the Staggers Rail Act of 1980, which have had a tremendous effect on the industry.
Prior to partial deregulation, all rates in the industry were subject to regulatory review and jurisdiction, limiting the railroads’ ability to leverage their market power into their pricing decisions. This changed with the Stagger’s Rail Act, which gave railroads some pricing flexibility, along with some relief to the regulatory agency through the introduction of a staged process for judging the reasonableness of a given rate.
The first step in this process for determining the reasonableness of a rate was to determine whether the railroad in question was “market dominant” (Wilson, 1996; Bitzan and Tolliver, 1998). In order to determine if market dominance exists for a given rate, the regulatory agency first calculates the ratio of revenue to variable cost (that is, the costs that vary with service). If this measure is less than 180%, the railroad is deemed to not be market dominant, a finding that is not rebuttable. However, if the calculated ratio is greater than 180%, then the regulatory agency takes a second step in assessing whether competitive factors are present or not. Only if a railroad is found to be market dominant over the movement in question, can the reasonableness of their rate be considered. This implies that only if the revenue to variable cost ratio is greater than 180%, and the regulatory agency finds that competitive factors—such as intra-modal and inter-modal competition—are not present, the reasonableness of the rate can be examined.
Assuming that the above process yields a finding of market dominance, the reasonableness of the rate is evaluated using one of three alternative criteria that are earmarked for “large”, “medium”, and “small” cases. In a large case, the stand-alone cost test (SAC) is used. This test holds that the rate charged cannot exceed the rate that would be charged by a hypothetical stand-alone railroad charging enough to fully cover all of its costs. In practice, the SAC criterion is difficult to implement, the costs to shippers to bring a case is substantial, while the length of time to reach a decision largely eliminates its use in a regulatory proceeding (Pittman, 2010). In a medium-sized case, there is a simplified SAC test with set guidelines on the determination of the hypothetical railroad. Finally, for small cases, reasonableness is determined by a three-benchmark test, which generally compares the markup over costs paid by challenged rates to average markups on comparable traffic. While the methodology for examining medium and small cases is more palatable, the maximum reparations on these cases could not exceed $5 million for medium cases or $1 million for small cases. Recently, however, the simplified SAC limits were removed and the three-benchmark limit was raised to $4 million. This was exceedingly important in that the actual damages awarded were relatively small compared to the advantages gained by the market dominant railroad under the previous rules.
The size of damages and the method for determining whether the railroad is market dominant in general, is particularly significant for agricultural shippers, as most of these shipments emanate from areas that are remote, with limited availability of intra-modal transportation options. Indeed, as shown below, most areas have only one shipping option, a factor made worse in the post Staggers era, as the rail network has shrunk due both to railroads abandoning low density lines, as well as railroad consolidation, limiting the availability of intra-modal competition. While intermodal transportation options are still present, their ability to compete with rail transportation is limited based on location and distance. For example, truck competition is important for short haul distances, but is much more expensive on a per-mile basis, limiting its ability to compete on the longer routes that railroads tend to focus on. Alternatively, barge competition is also a viable alternative, but is limited geographically (MacDonald, 1987; Burton, 1993; Henrickson and Wilson, 2014). Combined, these observations illustrate how most agricultural shipments arise from geographically dispersed locations with little opportunity for intra-modal competition, travel long distances, for which truck is not a feasible option, and only have barge as a viable alternative if the shipper is located in close proximity to a major waterway.
| Commodity | Tonnage (millions) | Share | Cumulative |
| Corn | 1,760 | 44.81 | 44.81 |
| Wheat | 1,140 | 29.02 | 73.83 |
| Soybeans (Soya Beans) |
498 | 12.68 | 86.51 |
| Barley | 123 | 3.13 | 89.64 |
| Sorghum Grains | 106 | 2.7 | 92.34 |
| Other | 301 | 7.66 | 100 |
| Total | 3,928 | 100 | 100 |
In addition to its impact on rates, the Staggers Rail Act also substantially eased the regulatory impediments to merger activity. As noted in Bitzan and Wilson (2007), the number of Class 1 railroads has fallen dramatically since the passage of this legislation. In 1983, there were 28 Class 1 railroads operating, but by 2003, only seven remained. While six railroads were declassified as Class 1 carriers, the other railroads that existed in 1983 were consolidated into the seven Class 1 railroads in operation today. Bitzan and Wilson (2007) additionally find that consolidation has reduced industry costs by approximately 11.4%. This consolidation of railroads has been a major result of the Staggers Act and, along with easier abandonment of lines, has led to a very different industry today than what was present in 1980. Indeed, these changes have left many shippers without direct service—requiring a truck movement to access rail—or without direct access to a Class 1 carrier, requiring an interchange. These forces, all act together to put upward pressure on rail rates, but the analysis of this effect is somewhat limited in the literature.
The economic welfare consequences of these horizontal mergers are often cast in terms of the so-called Williamson (1968) model of mergers. In this model, there are two different effects: a cost synergies effect, which may have a downward impact on railroad costs, and the direct impact of a reduction in competitors, which places an upward impact on rail rates. Economists have analyzed whether the theoretical effects predicted by economic theory have materialized in the real world of rail markets. For example, Bitzan and Wilson (2007), as well as others (Berndt et al., 1993; Vellturo et al., 1992), find that consolidation has indeed reduced costs to some degree, while a study by Ivaldi and McCullugh (2012) finds that “shipper surplus and total welfare have remained fairly constant in U.S. freight rail markets despite a dramatic degree of consolidation in the industry.” Ivaldi and McCullugh (2012) also find that surplus increased in intermodal markets, while bulk markets have offset the loss of surplus in general freight. In addition, they conclude that surplus has increased for bulk shippers, but that the majority of that surplus was only realized after most mergers were completed, and were primarily driven by reductions in unit costs. It is also quite noteworthy that that they estimate a measure of markup—defined as the Lerner Index, or rate-marginal cost/rate—for bulk shipments to be about 75%.
| State | Corn | Corn | % Change |
Wheat | Wheat | % Change |
Soybean | Soybean | % Change |
| 90-93 | 13-Oct | 90-93 | 13-Oct | 90-93 | 13-Oct | ||||
| Illinois | 1361 | 1818 | 34 | 66 | 40 | -40 | 372 | 437 | 8 |
| Iowa | 1443 | 2132 | 48 | 2 | 1 | -60 | 324 | 453 | 17 |
| Nebraska | 944 | 1478 | 57 | 70 | 56 | -21 | 89 | 248 | 47 |
| Indiana | 701 | 842 | 20 | 35 | 23 | -35 | 190 | 248 | 13 |
| Minnesota | 636 | 1289 | 102 | 104 | 75 | -28 | 166 | 297 | 28 |
| Kansas | 218 | 476 | 119 | 397 | 335 | -15 | 53 | 116 | 37 |
| Ohio | 403 | 525 | 30 | 60 | 42 | -31 | 144 | 217 | 20 |
| North Dakota |
35 | 321 | 809 | 375 | 292 | -22 | 15 | 139 | 81 |
| Missouri | 227 | 350 | 54 | 61 | 36 | -41 | 135 | 190 | 17 |
| South Dakota |
228 | 640 | 181 | 114 | 102 | -11 | 53 | 159 | 50 |
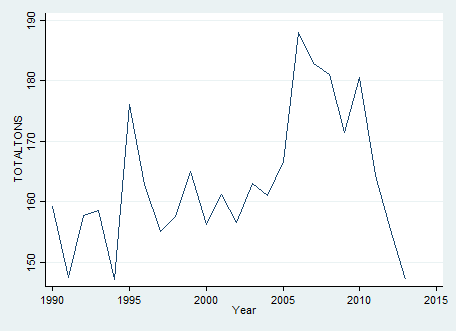
Over the last 24 years, the quantity of rail shipments of agricultural products throughout the United States has increased, as shown in Figure 1. While railroads haul a wide variety of agricultural products, the primary commodities carried are corn, wheat, soybeans, barley, and sorghum, commodities that account for over 90% of annual rail farm product tonnages. Specifically, while there are 93 different classifications of “Farm Products” hauled by railroads at the five digit Standardized Transportation Commodity Codes, corn (44.8%), wheat (29.0%), soybeans (12.7%), barley (3.1%), and sorghum (2.7%) total over 90% of all rail transportation of farm products between 1990 and 2013. As such, we focus on wheat, corn, and soybeans in what follows, with Table 1 summarizing the total tonnages (in millions) over this time period, along with shares of all farm product traffic.
Given this background, the demand for rail transportation depends critically on the production of these five agricultural commodities. Table 2 contains summaries of state level agricultural production in 1990-1993 and 2010-2013, along with changes by state. It is particularly noteworthy that the top producing states for each commodity during 1990-1993, remain at the top in 2010-2013. However, outside of the top state for each commodity, there are remarkable changes illustrated in Table 2. For example, corn grew for all states, but, in particular, for Minnesota, Kansas, and North Dakota; wheat production fell in all states; while soybean production increased in all states, and, in particular for North Dakota.
As noted above, railroad markets have also changed dramatically over this time period. Between 1990 and 2013, there were multiple mergers in the rail market, reducing the number of Class I carriers from 14 to only 7. Coinciding with these mergers, there was a dramatic reduction in the miles of track operated. Between 1983 and 2012, miles of road operated by Class 1 carriers fell from 168,838 to 120,658 miles, with most of the reduction in the 1980s (Figure 2). This pattern continued into later years, but at a much slower rate, as the miles of road only fell from 133,189 to 120,658 between 1990 and 2012 (Railroad R-1 Reports filed with the Interstate Commerce Commission and the Surface Transportation Board). Also shown in Figure 2 is the doubling of revenue ton miles for Class 1 carriers over this same period of time. Figure 3 presents this same information on an average unit basis, showing that both miles of road and revenue ton-miles per firm have grown together as firm sizes have grown. However, from about 1999 to 2012, output per firm continues to grow, but miles of road have remained relatively constant. A particularly striking result illustrated in Figure 4 is that output per firm increased more than eight times between 1983 and 2012, while the network size (miles of road) has increased only slightly more than two times. This pattern points to substantially more intensive use of the rail network, along with the associated issues that agricultural shippers have faced in gaining access to this network; a result that for some locations has been exacerbated as railroads have reallocated resources to meet the growing demand for the transportation of oil from the Upper Midwest.
|
Figure 2: Revenue Tonmiles and Miles of Road
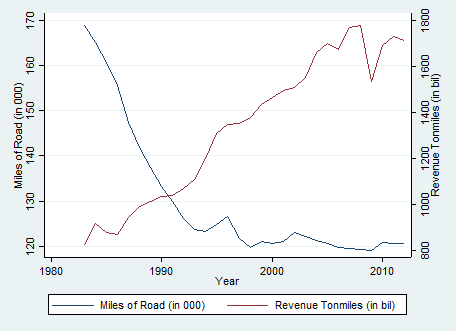
Source: Constructed from R-1 Financial Reports filed with the Surface Transportation Board.
|
Figure 3: Average Revenue Tonmiles and Miles of Road Per Firm
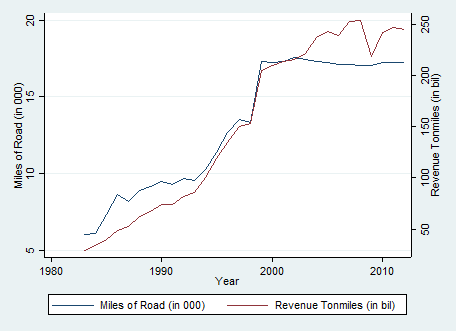
Source: Constructed from R-1 Financial Reports filed with the Surface Transportation Board.
|
Figure 4: Average Revenue Tonmiles and Miles of Roads (Relative to 1983)
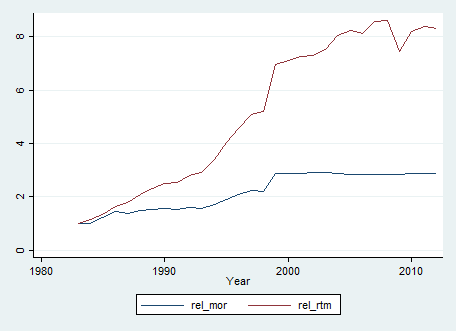
Source: Constructed from R-1 Financial Reports filed with the Surface Transportation Board.
|
One of the largest issues associated with a smaller network along with fewer firms using the network far more intensely, is the effect on pricing. In particular, as railroads have merged and abandoned, or sold rail lines to regional short-line carriers, the inevitable effect for shippers is less access to rail and/or less competition among Class 1 carriers. Information from the Oakridge National Laboratories allows an assessment of these impacts. In these data, there were 1982 counties with rail service in either 1990 or 2013. In 1990, about 68% of these counties had access to Class 1 rail service, while 32% received service from non-Class I carriers. In 2013, these statistics remain virtually unchanged; however, of the counties that received Class 1 service, about 14% lost service between 1990 and 2013. In short, most counties in the United States do not receive railroad service presently, and even fewer receive Class 1 carriage. However, for those that did receive service in 1990, most continue to have service—only 32 of 1392 have lost service from any Class 1 carrier—while only 14% have lost service from competing Class I carriers.
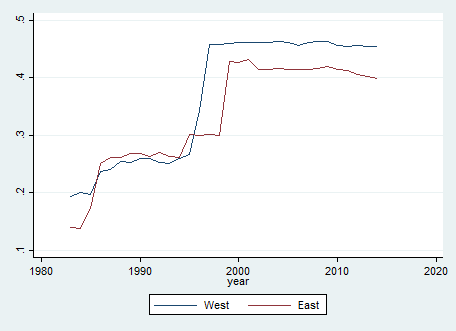
Another measure of the changing competitive environment comes from the railroads’ annual reports (the Form R-1 reports). These data allow for the calculation of the Herfindhahl Index, an index of market power. If market power increases, all else equal, markups increase. Henrickson and Wilson, 2014 separated the railroads into east and west railroads, calculating the resulting Herfindahl Index for each region. While this standard measure of market power is somewhat overstated given that it captures only Class I carriers, Class 1 carriers account for over 90% of railroad traffic, which lessens this upward bias. Figure 5 illustrates this measure of concentration for each of these regions, and points to tremendous increases in concentration over time, attributed primarily to the merger and consolidation activity within the market, with only modest differences across regions. The increase in concentration of course reflect greater amounts of outputs held by larger firms, which in turn, points to pricing power and associated higher prices.
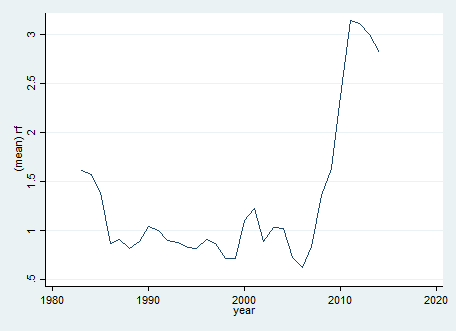
While much of the structural change in rail markets was realized in the 1980s and 1990s, a more recent effect on rail markets has been the tremendous increase in the cost of fuel to railroads which in turn is passed on to the shippers in the form of high rates. Figure 6 presents real fuel prices over time, and points very directly to the significant changes in these costs over the past decade.
Unfortunately, the effects of these various changes in the railroad industry on rail rates are not clear. While the nation’s rail network has decreased dramatically, most shippers that had service in 1990 continue to have service today. Conventional measures of concentration point to dramatic increases, yet the effects of this consolidation may point to efficiency gains, perhaps realize through larger lengths of haul, consolidated shipments, and less interchange, but may also point to higher market power. Yet, most shippers have only one rail option, and fewer yet have direct service from Class 1 carriers, while higher fuel costs have led to fuel surcharges added into rail rates.
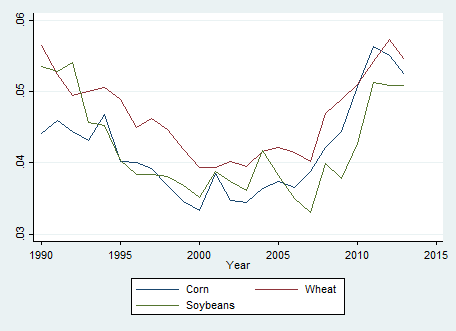
To assess some of the changes over time we used the Public Use Waybill available from the Surface Transportation Board (STB, 2015). These data give shipment characteristics and rates at the Bureau of Economic Region level. Using these data, we calculated the average rate per ton-mile, which is shown in Figure 7. As indicated, the rates for each of these commodities vary, with wheat rates tending to be higher. However, rates for each commodity tended to fall through the 1990s, and have been increasing since mid-2000. These patterns are consistent with net efficiency gains realized through consolidation followed by rising fuel prices, and associated fuel charges, over the last 10 years.
While there are only modest changes in service offered to shippers from consolidation, sales and/or abandonment of rail lines by Class 1 carriers, there are differences across shippers in terms of service options available. To capture these differences, we merged the public use waybill data to the Oakridge data by U.S. Bureau of Economic Analysis economic area code. In the data, there are a total of 188,504 observations for the entire time period in question, of these, 22% of the observations were from counties with no service from Class 1 carriers, 45% were from counties with only one Class 1 carrier providing service, and the remainder have 2 or more Class 1 carriers. Direct comparisons are quite difficult owing to different traffic characteristics of shipments that vary over geographic space, including miles traveled, shipment size, number of interchanges, whether the shipments were in rail owned or shipper owned cars. However, we accounted for these differences statistically, and found that the rates are about 2-3.5% higher for counties with one Class 1 carrier, and about 3 to 7% higher for counties with no Class 1 service. These findings do point to competitive issues, but the magnitudes are generally quite small.
Partial deregulation of the railroad industry has dramatically changed the level of competition present in much of the United States, directly impacting agricultural shippers. Railroads have consolidated and introduced innovations that have resulted in dramatically lower costs and prices. While the overall rail network has decreased in size, many shippers in this study have experienced little, if any, change in service provided by Class 1 carriers. Analysis of rates, point to significant declines through the 1990s that coincide with several major mergers that offered efficiencies. However, rates have climbed substantially since 2005, which coincides with increasing fuel prices. Yet, the bulk of shipments emanate from areas with no Class 1 service or from areas with a single Class 1 carrier. Thus, most agricultural shippers have limited options for Class I service.
Berndt, E. R., A. F. Friedlaender, J.S.E.W. Chaing, and C. A. Vellturo. 1993. "Cost Effects of Mergers and Deregulation in the U.S. Rail Industry." Journal of Productivity Analysis 4:127-144.
Bitzan, J. D., and D. D. Tolliver. 1998. “Market Dominance Determinations and the Use of Product and Geographic Competition: A Verified Statement before the Surface Transportation Board. Available online: http://www.ugpti.org/pubs/pdf/DP122.pdf.
Bitzan, J. D., and W. W. Wilson. 2007. "Industry Costs and Consolidation: Efficiency Gains and Mergers in the U.S. Railroad Industry." Review of Industrial Organization 30:81-105.
Burton, M. L. 1993. "Railroad Deregulation, Carrier Behavior, and Shipper Response: A Disaggregated Analysis." Journal of Regulatory Economics 5: 417-434.
Henrickson, K E., and W. W. Wilson. 2005. "Model of Spatial Market Areas and Transportation Demand." Transportation Research Record: Journal of the Transportation Research Board 1909.1:31-38.
Henrickson, K. E., and W. W. Wilson. 2014. “Prices and Costs in Transportation: A Case Study of Railroad Pricing of Corn Shipments Under Partial Deregulation and Competitive Alternatives.” In D. Prokop, ed. The Business of Transportation. Santa Barbara, CA: ABC-CLIO, pp. 176-198.
Ivaldi, M. and G. McCullough. 2012. “Welfare Tradeoffs in U.S. Rail Mergers.” Mimeo.
MacDonald, J. M. 1987. "Competition and Rail Rates for the Shipment of Corn, Soybeans, and Wheat." The RAND Journal of Economics 18:151-163.
MacDonald, J. M., and L. C. Cavalluzzo. 1996. "Railroad Deregulation: Pricing Reforms, Shipper Responses, and the Effects on Labor." Industrial & Labor Relations Review 50:80-91.
Pittman, R. 2010. "Against the Stand-Alone-Cost Test in U.S. Freight Rail Regulation." Journal of Regulatory Economics. 38:313-326.
Surface Transportation Board (STB). 2015. Available online: http://stb.dot.gov/stb/index.html#
Vellturo, C. A., E. R. Berndt, A. F. Friedlaender, J.S.E.W. Chiang, and M.H. Showalter. 1992. "Deregulation, Mergers, and Cost Savings in Class I U.S. Railroads, 1974â€1986." Journal of Economics & Management Strategy. 1: 339-369.
Williamson, O. E. 1968. "Economies as an Antitrust Defense: The Welfare Tradeoffs." The American Economic Review. 58: 18-36.
Winston, C. 1993. "Economic Deregulation: Days of Reckoning for Microeconomists." Journal of Economic Literature. 32: 1263-1289.
Wilson, W. W. 1994. "Market-Specific Effects of Rail Deregulation." The Journal of Industrial Economics : 1-22.
Wilson, W. W. 1996 "Legislated Market Dominance in Railroad Markets."Research in Transportation Economics 4 : 49-67.
Wilson, W. W. 1997. "Cost Savings and Productivity in the Railroad Industry."Journal of Regulatory Economics 11.1 : 21-40.
Wilson, W. W., and W. W. Wilson. 2001. "Deregulation, Rate Incentives, and Efficiency in the Railroad Market." Research in Transportation Economics 6 : 1-24.

