Quinoa (Chenopodium quinoa is a pseudocereal grain domesticated and traditionally produced in the Andean region (primarily Peru, Bolivia, and Ecuador). Since colonial times, quinoa has acquired a negative connotation as a food consumed by the indigenous and the poor, limiting its consumption to rural areas of the Andes.
Beginning in the 1940s, quinoa gained attention due to its high nutritional value. Organizations such as the Food and Agriculture Organization of the United Nations (FAO) identified quinoa as a crop that could help achieve food security and campaigned to increase its consumption in the three Andean countries. An increase in the consumption of quinoa, however, did not happen until the 1980s, when consumers in high-income countries became interested in the crop, which ultimately helped upgrade quinoa from “indigenous food” to “superfood” status. As a result, quinoa consumption is no longer limited to the rural areas of the Andes, and quinoa has become a highly sought-after product in the urban areas of the Andes and in high-income countries among consumers interested in healthy, nutritious, gluten-free, and organic foods (CBI, 2020).
As the quinoa market expanded, prices increased. At the same time, researchers raised concerns about the negative effects of high prices on poor quinoa consumers (Bellemare, Fajardo-Gonzalez, and Gitter, 2018) and capital-intensive production on the environment (Risi, 2015). Producers from Bolivia, Peru, and eventually Ecuador were motivated to produce more quinoa to supply the increasing domestic and international demand. As a result, production and exports have significantly increased in these countries, creating incentives for new competitors to enter the market.
Recent trends in production, prices, imports, and exports suggest the global quinoa market is currently mature in major markets such as the United States and the European Union. Andean producers may not see prices return to the highs of the mid-2010s, and the market may experience a decline if demand in the US and EU weakens. However, there may be potential for continued growth in other parts of the world, including China, Japan, Australia, and Russia. The success of such an expansion will depend heavily on successfully meeting international standards related to food safety, organic production, and labeling.
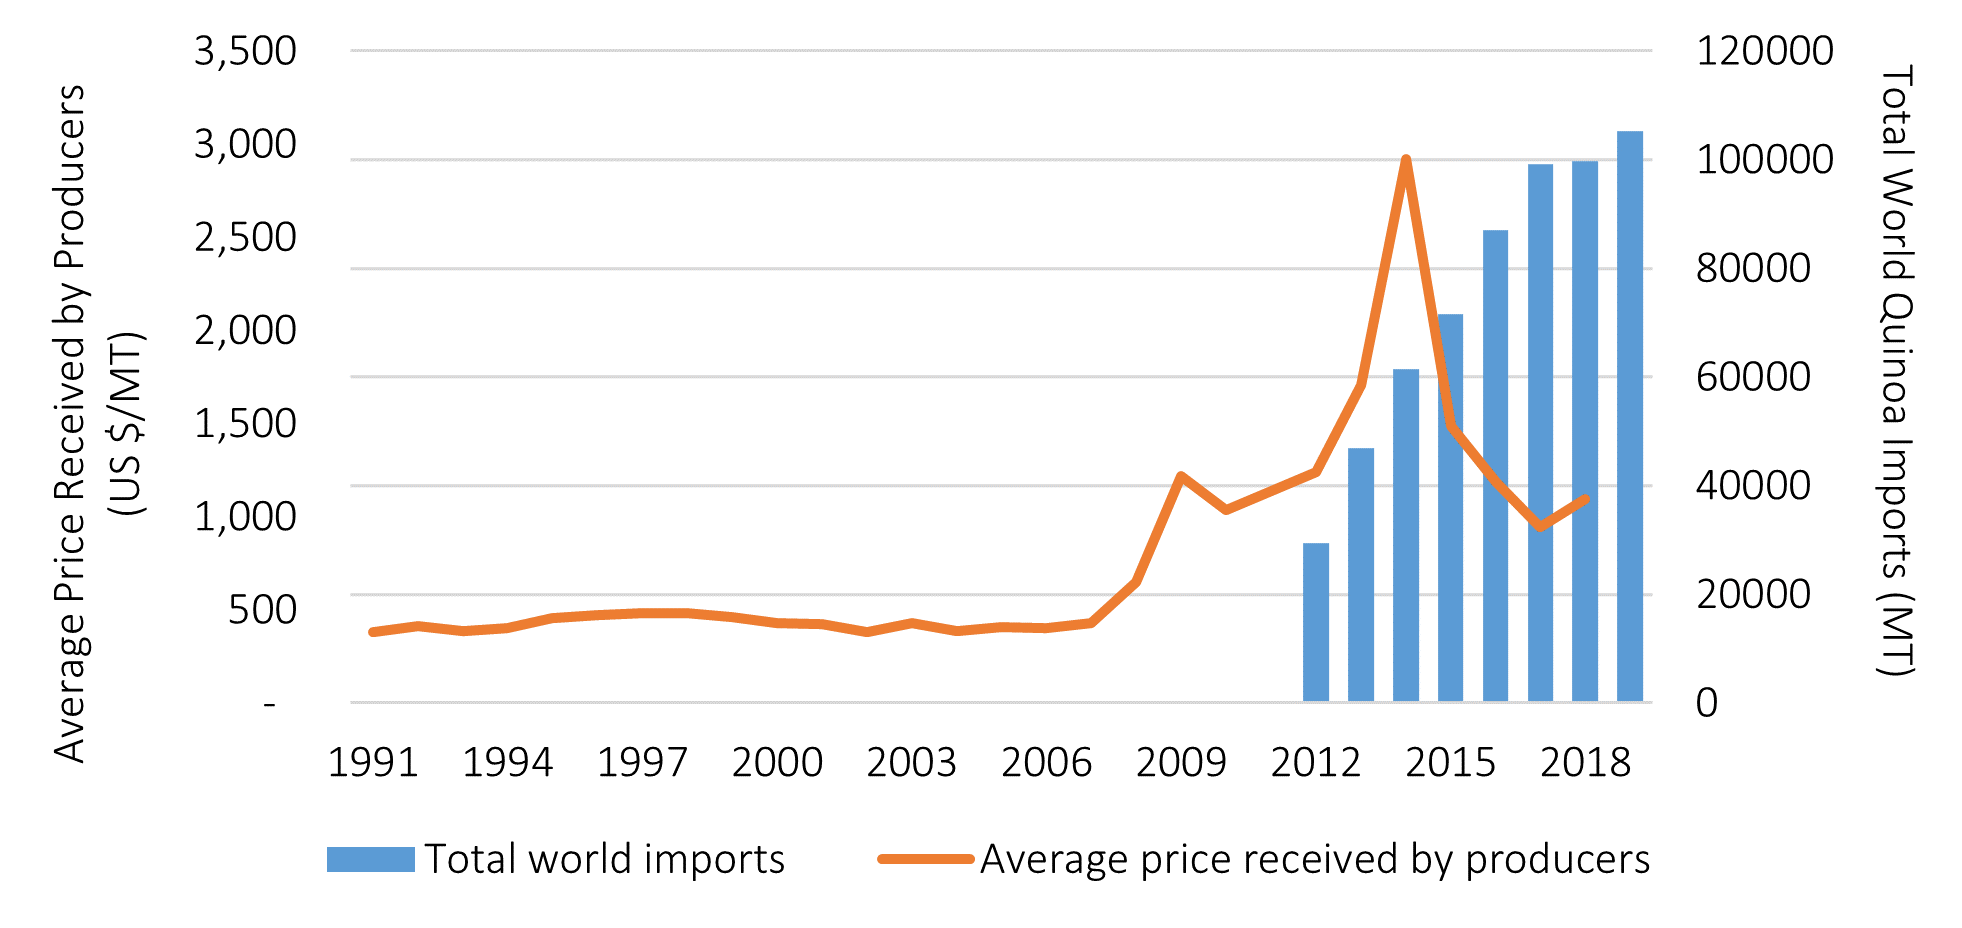
Note: Trade data for quinoa are available since 2012,
when the specific HS code for quinoa was created. Before
2012, quinoa was reported in the category “Buckwheat,
millet, canary seed and other cereal (excluding wheat and
meslin, rye, barley, oats, maize, rice, and grain sorghum)”
(Coelho, Deriaz, and Tokas, 2020; ITC, 2020).
Source: Average prices are from FAO (2020b); total
imports are from ITC (2020).
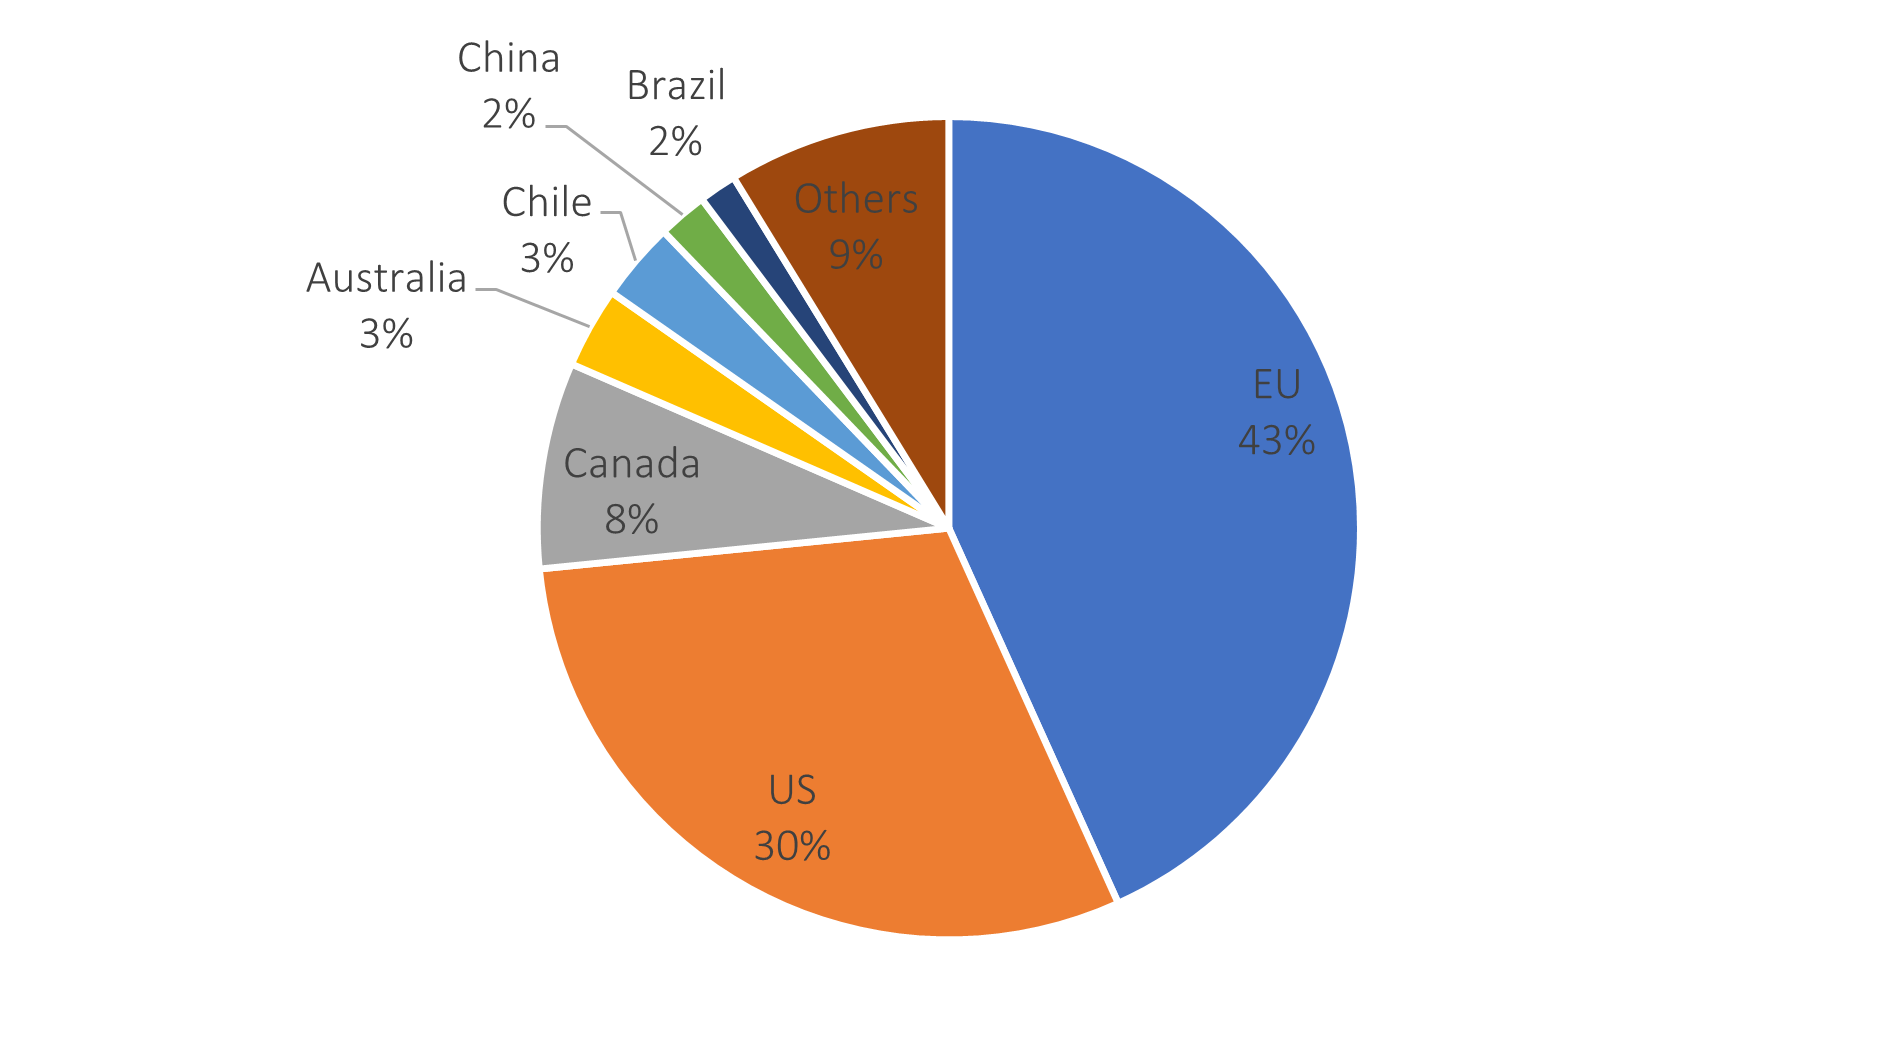
Source: ITC (2020).

Source: ITC (2020).
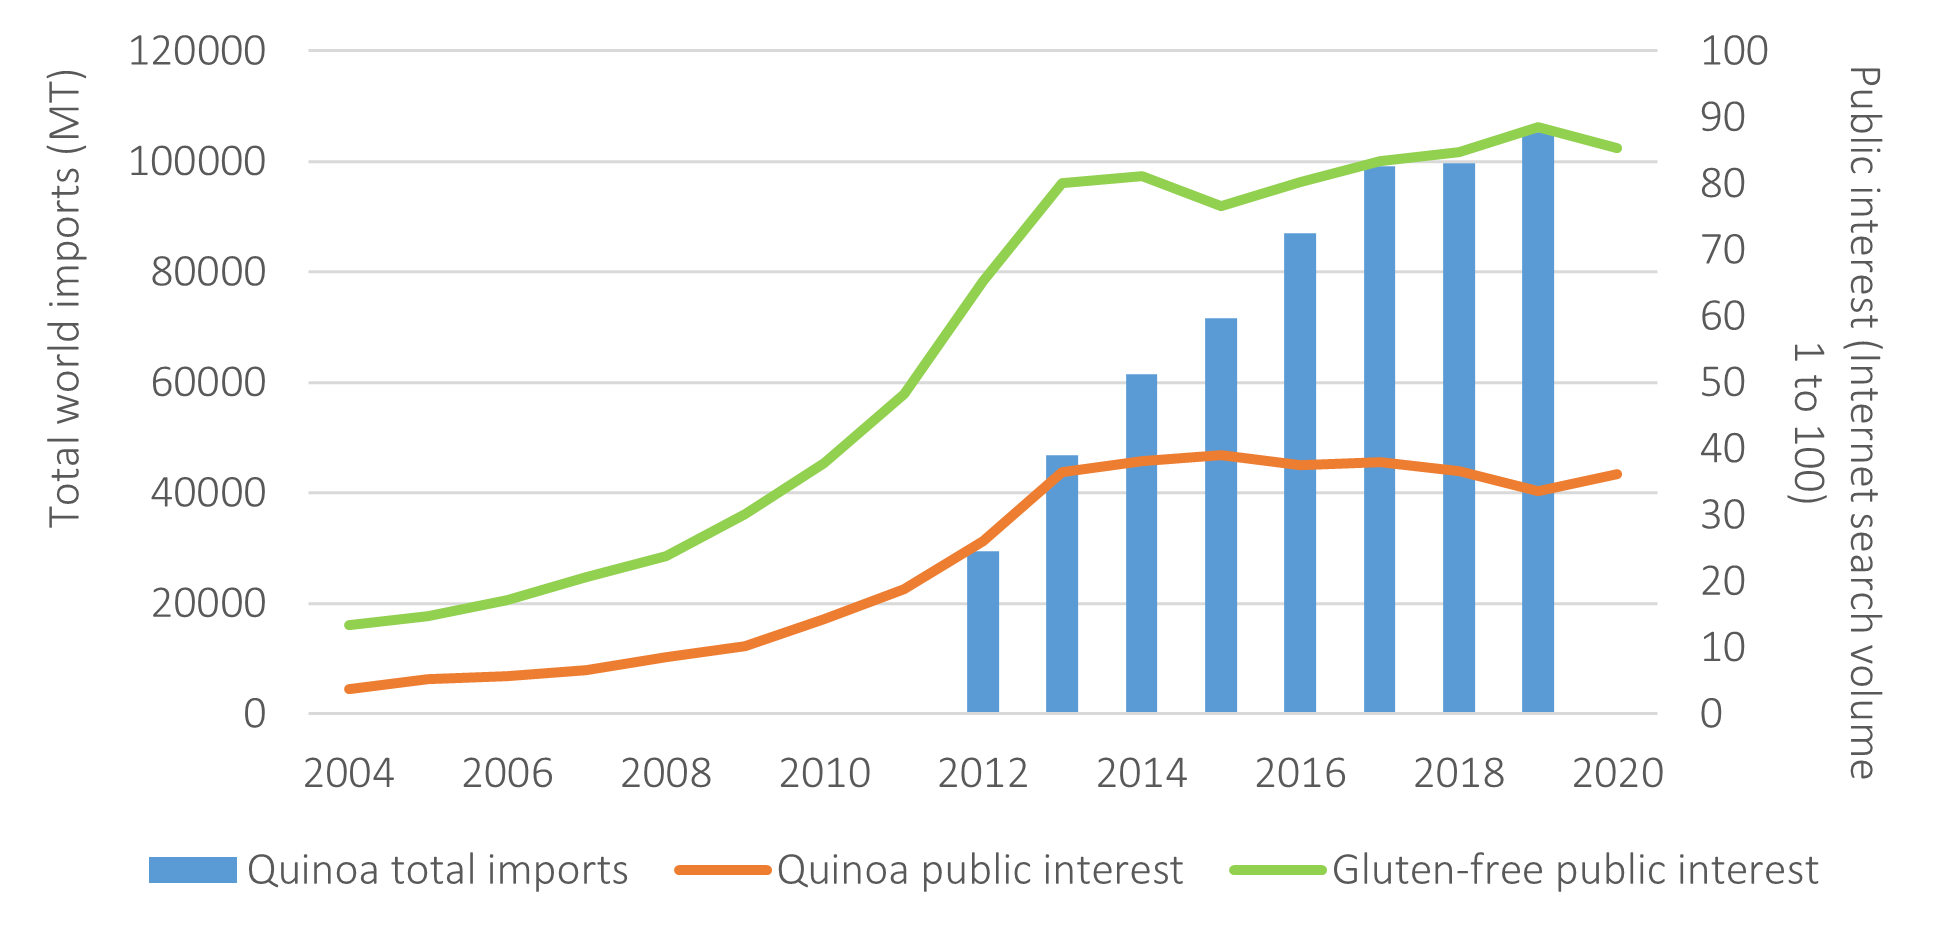
Source: Interest in quinoa is from Google Trends (2020);
total world imports is from ITC (2020).
As the international demand for quinoa—measured by total world imports—increased, prices also increased. Figure 1 shows the relationship between prices received by Andean quinoa producers and total world imports. Prices remained steady in the 1990s and early 2000s. Between 1991 and 2007, quinoa prices increased by only 7.81% in Bolivia and 20.52% in Peru (FAO, 2020b). From 2008 to 2014, prices soared by 304.75% in Bolivia and 407% in Peru (FAO, 2020b). Imports increased sharply from 2012 to 2016. Imports have continued to increase since, but at a slower rate (Figure 1).
Figure 2 shows the major importers of quinoa in 2019. The United States imported 30% of the total world imports and the European Union imported 43%. Other important importers were Canada (8%), Australia (3%), Chile (3%), and Brazil (2%). Russia, Japan, the United Arab Emirates, Argentina, and New Zealand together accounted for the remaining 9% (ITC, 2020).
In the last decade, exports of quinoa and the number of exporting countries have increased. In 2012, 25 countries exported 43,646 metric tons (MT) of quinoa, compared to 114,439 MT exported by 53 countries in 2019 (ITC, 2020). Historically, Bolivia has been the major exporter of quinoa worldwide. Since 2014, however, Peru has taken the lead, exporting on average 1.5 times more than Bolivia (Figure 3) (ITC, 2020).
In 2019, Bolivia, Ecuador, and Peru accounted for 74% of the international market of quinoa—43% from Peru, 29% from Bolivia, and only 2% from Ecuador. Newly producing countries accounted for the remaining 26%: Spain and the Netherlands contributed 5% and 4% of the market, respectively. Canada exported 4% and the United States 3%, while France, Germany, Belgium, and Italy together accounted for 10% of total world exports (Figure 3) (ITC, 2020).
In 2002, Peru’s foreign policy started focusing on opening new foreign markets, establishing commercial relationship through new trade agreements (MINCETUR, 2020). For instance, Peru has free trade agreements in force with the United States and Canada since 2009, with Japan since 2012, and with the European Union since 2014 (Soto, 2015). This strategy benefited the quinoa sector. Peru went from exporting 10,712 MT of quinoa to 21 countries in 2012 to 48,781 MT to 61 countries in 2019. Peru not only increased quinoa exports by 355.38%, but also diversified its trading partners (ITC, 2020). In 2019, the major destinations for Peru’s quinoa were the United States (33%) and the European Union (36%). Other partners were Canada, Brazil, Chile, Mexico, Australia, Russia, and Israel.
Bolivia started exporting its signature variety, Quinoa Real, in 1974 (Gamarra et al., 2019). While Bolivian exports of quinoa increased from 25,662 MT in 2012 to 33,677 MT in 2019, its share in the international market declined from 59% to 29%. During the same period, Peru’s market share increased from 24% to 43%. Unlike Peru, Bolivia has developed few trade partnerships. Between 2012 and 2019, Bolivia exported approximately 83% of its quinoa to the United States and the European Union only (ITC, 2020), exhibiting a high level of dependency on those two markets.
Until 2016, Ecuador imported quinoa to meet its domestic and international demand (SIPA, 2018). Currently, Ecuador’s production exceeds domestic demand, leaving enough surplus to supply the international market. Similar to Bolivia, Ecuador has few trade partners. In 2019, 30% of total exports went to the European Union, 23% to Canada, 23% to the United States, 21% to Israel, and 3% to other countries (ITC, 2020).
The “quinoa boom” occurred from 2011 to 2015. The remaining question is what would happen next. Using the concept of product cycle (Grossman and Helpman, 1991; see Belton, Reardon, and Zilberman, 2020, for an application to seafood), this section explains the dynamics of the quinoa market and sheds light on potential opportunities and challenges quinoa producers and sellers may face.
A product’s cycle is defined through the relationship between the quantity sold and sales (and profits). This cycle has four stages—introduction, growth, maturity, and (eventually) decline. As quinoa penetrated the international market (as evidenced by imports and prices), consumers have changed their behavior, and many have adopted (or not adopted) the product. Figure 4 shows the relationship between imports, measured in metric tons (ITC, 2020) and public interest in quinoa and gluten-free products, measured by the volume of Google searches (Google Trends, 2020). We propose that the dynamics of imports, prices, and public interest in quinoa can help understand the life cycle of quinoa as a product:
As quinoa has reached its maturity stage in some countries, quinoa producers may need to design new business strategies to avoid reaching the decline stage. The following section identifies the global market opportunities and barriers for the quinoa market.
Recall that Peru, Bolivia, and Ecuador have traditionally been the major producers of quinoa worldwide. Until the early 1990s, production of quinoa remained steady. Since quinoa’s popularity increased in the international market, the three Andean countries have used different strategies to meet the increasing demand and capture the benefits of higher prices.
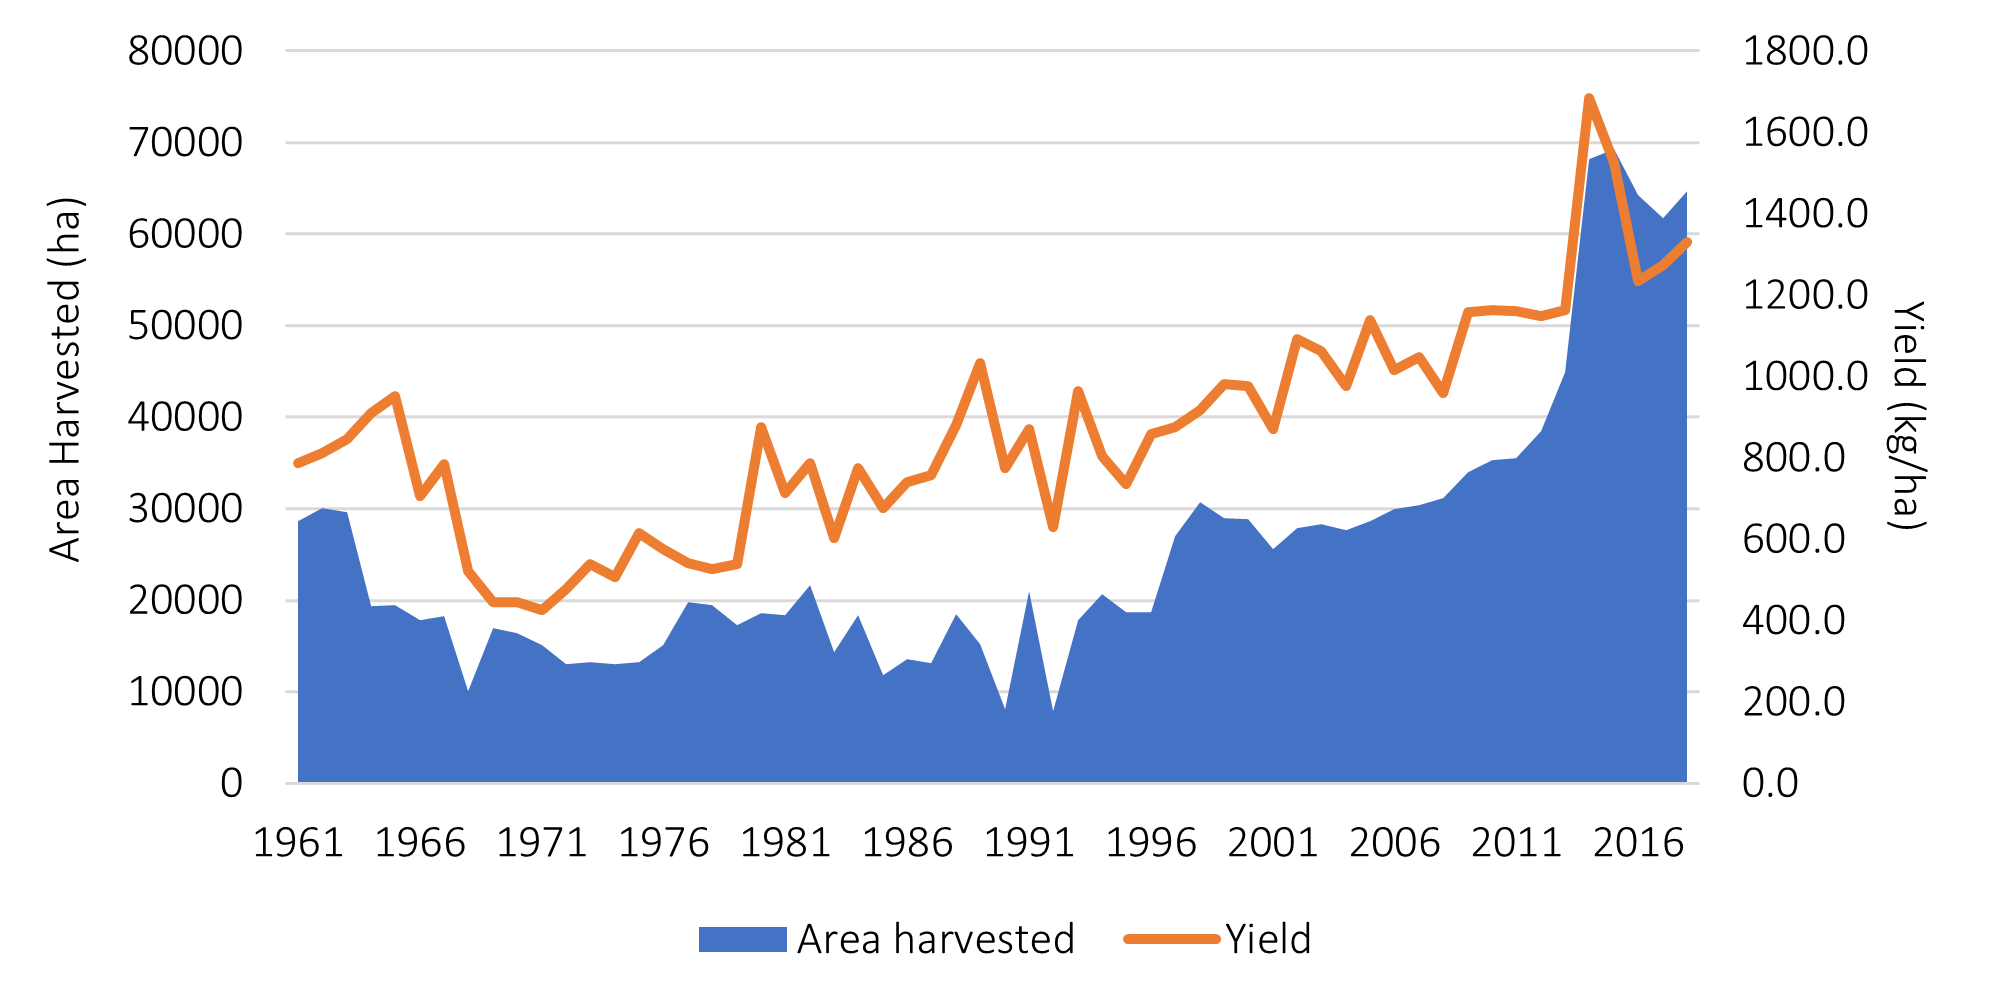
Source: FAO, (2020a).
Source: FAO (2020a).

Source: FAO (2020a).
Quinoa can be produced in different agroclimatic zones (Fairlie, 2016), which allowed Peru to not only strengthen the regions where quinoa has been typically grown but also to expand its production to the coastal region (Dirección General de Políticas Agrarias, 2017). The area of quinoa harvested in Peru almost quadrupled, from 8,081 ha in 1990 to 28,889 ha in 2000. This increase in the harvested area led to an increase in production of 350.3%, from 6,260 MT to 28,191 MT. As the area allocated to quinoa continued rising, production increased 45.8% over 2000–2010 and 179.3% over 2010–2015 (Figure 5).
In addition to area expansion, Peru invested resources in research and education. The introduction of enhanced varieties and farmers’ training on best management practices led to productivity gains. Quinoa yields increased by 26% from 1990 to 2000, by 19.2% from 2000 to 2010, and by 14.4% from 2010 to 2018 (FAO, 2020a). Peru produced 86,011 MT of quinoa in 2018, 21.6 % higher than Bolivia’s production but only using half as much land as Bolivia (FAO, 2020a). Currently, Peru is the leading producer in terms of volume and productivity.
The expansion of quinoa production into the coastal area has raised concerns related to environmental impacts because producers in this area are using more pesticides for pest and diseases (Soto, 2015; Latorre and Jacobsen, 2017). This situation has led to the reduction of exports. In 2014, three shipments of quinoa from Peru were found to have pesticide residues above the maximum threshold, preventing them from entering the United States (El Comercio, 2014a). Additional research is needed to evaluate potential environmental impacts that could compromise the sustainability of quinoa production in the coastal area (Latorre and Jacobsen, 2017) and the international reputation of the Peruvian quinoa.
Quinoa has always played an important role in Bolivian culture. Before the 1980s, this crop was primarily produced for the local market (Gandarillas et al., 2015). Quinoa was usually planted in the foothills, hill slopes, and mountains of the Bolivian Altiplano under an agropasture system (Gandarillas et al., 2015; Del Barco-Gamarra, Foladori, and Soto-Esquivel, 2019). Since the 1980s, quinoa production has expanded to the plains of the Altiplano and other nonquinoa production regions. Currently, seven out of the nine departments in Bolivia plant quinoa.
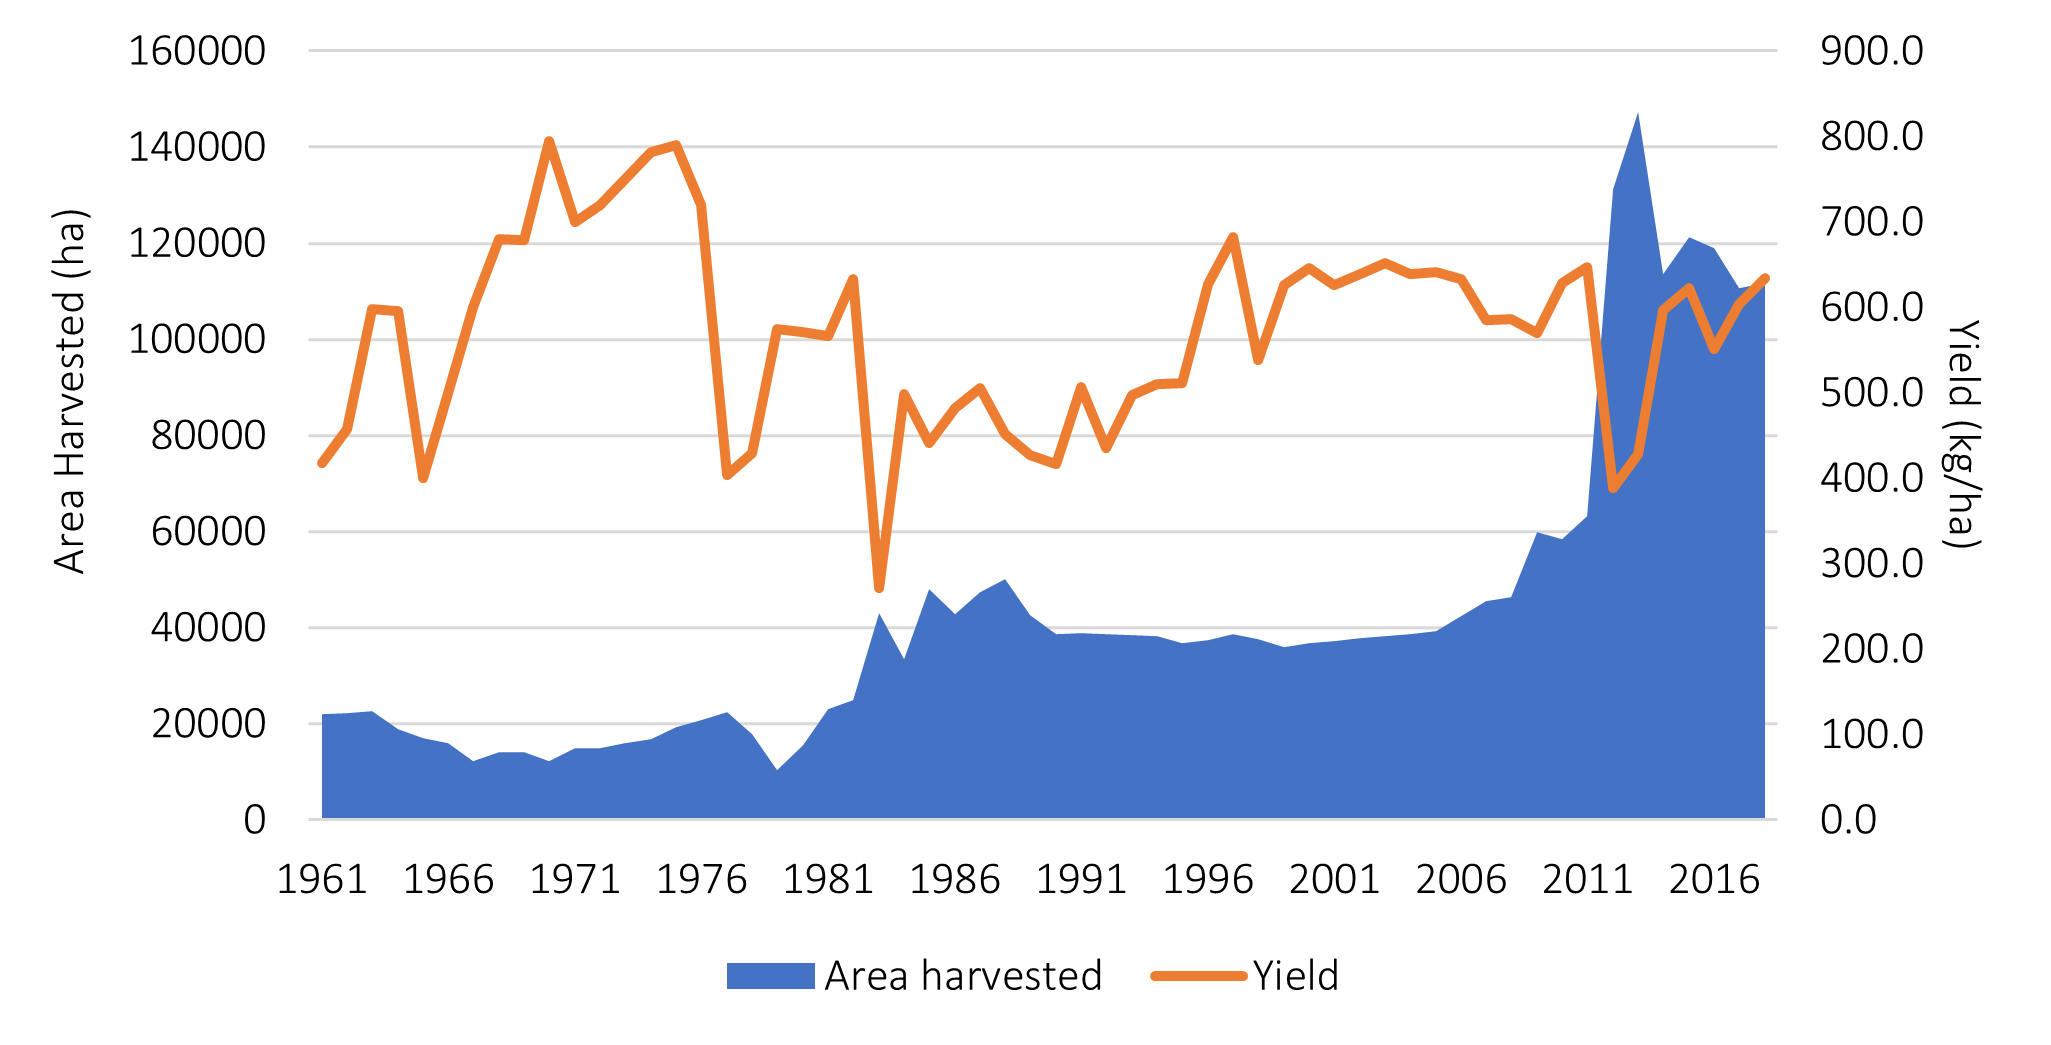
The area of quinoa harvested increased from 15,640 ha in 1980 to 38,615 ha in 1990. Bolivia barely changed its area allocated to quinoa during the 1990–2000 period. To supply the increasing international demand, the area harvested increased from 39,302 ha in 2005 to 58,496 ha in 2010, a 48% increase. Production soared from 25,201 MT in 2005 to 36,724 MT in 2010 and 63,075 MT in 2013, when 147,312 ha were harvested (Figure 6), the largest amount of land allocated to quinoa production. In 2018, 111,605 ha of quinoa were harvested, producing 70,763 MT, an increase of 12.19% (FAO, 2020a).
The expansion of quinoa into the plains of the southern Altiplano has resulted in a decline in yields (Figure 6) because of using a capital-intensive (higher use of pesticides and machinery) production system in highly erodible soils (Gandarillas et al., 2015). Between 2000 and 2018, quinoa yields in Bolivia were, on average, 47% lower than in Peru and 21.23% lower than in Ecuador (FAO, 2020a). Concerns about agro-ecological and social vulnerability in this area are increasing (Winkel et al., 2015; Del Barco-Gamarra, Foladori, and Soto-Esquivel, 2019). Additional research is needed to evaluate these potential issues.
In Ecuador, quinoa is a secondary crop produced by smallholders in the highlands region (SIPA, 2018). In 2015, the area harvested reached 7,148 ha (Figure 7), the highest amount of land this country has allocated to quinoa, producing 12,707 MT (FAO, 2020a). This area represented only 5.90% and 10.31% of the area harvested in Bolivia and Peru, respectively. Because prices in Ecuador plummeted by 55% in 2015 (Enriquez, 2018), the area harvested decreased to 2,048 ha in 2018, leading to a production decline of 83% (FAO, 2020a).
France, Germany, Spain, and Italy have recently begun cultivating quinoa. Spain has become the biggest quinoa producer in Europe. Other countries cultivating quinoa in Europe are Poland, Bulgaria, Portugal, and Czech Republic (CBI, 2020).
In the United States, quinoa was introduced by Colorado State University as a crop that could be adapted to the Rocky Mountain region. Washington State University is also investigating the crop’s adaptability to the Pacific Northwest region (Peterson and Murphy, 2015).
In the Andes, quinoa has typically been produced by small-scale producers. Due to their scale of production, they lack (i) the capacity to export or commercialize the product in larger markets, (ii) the bargaining power to negotiate better prices and other conditions, and (iii) the ability to meet the quality and safety standards of larger and more demanding markets (Fairlie, 2016).
The market for quinoa has experienced notable changes. Before the “quinoa boom” of the mid-2010s, producers generally sold their quinoa on the local market, which allowed them to market the crop when they needed cash. As the foreign demand for quinoa increased, producers have been encouraged to work in associations or to sell their production to aggregators in order to meet volume and quality requirements (Fairlie, 2016, El Comercio, 2014b).
Associations collect the grain from members and conduct standard post-harvest activities (including cleaning, washing, and packing) needed to market the grains. In addition, quinoa, different from other cereals and grains, needs washing to remove the saponin, which gives quinoa a bitter flavor. Establishing the infrastructure for post-harvest activities is costly and may constrain small-scale farmers from entering the quinoa business.
Depending on the size of the aggregator, these collect the grain from farmers and process the quinoa or sell it to other processing plants. Generally, aggregators and processing plants are considered medium to large scale (Fairlie, 2016).
In the coastal region of Peru, quinoa is produced primarily by large-scale farmers, which employ more technology for the production and processing of quinoa. Many of the large-scale farmers have the installed capacity to complete all of their own post-harvesting handling and processing (Fairlie, 2016).
The governments of Bolivia, Ecuador, and Peru have supported the quinoa sector by promoting research and development in quinoa through their National Institutes of Agricultural Research (INIAF-Bolivia, INIAP-Ecuador, and INIA-Peru). These institutes have developed improved varieties of quinoa that are adapted to the climatic conditions of the regions where quinoa is currently produced in each country (Peralta and Mazón, 2015; Risi, 2015; Soto, 2015).
The National Secretary of Plants and Animal Health (SENASA) conducts rigorous monitoring on pesticide residues, heavy metals traces, and mycotoxins to assure the quality of the product. SENASA trains quinoa producers, processors, and exporters. In addition, the government supported the creation of a Quinoa Taskforce to provide quinoa stakeholders—producers, processors, and private and public institutions—with a space to discuss current challenges and design strategies to expand the consumption of quinoa (Fairlie, 2016). Local governments also promote training and extension activities.
Bolivia has benefited from the work of international organizations and its government, which has conducted research related to quinoa since the 1970s. Bolivia proudly commercializes its Quinoa Real variety and is seeking to protect it through a designation of origin (Risi, 2015).
In the last decade, the government also provided producers with inputs and production loans to help recipients increase their production and motivate nonquinoa producers to switch from other traditional crops to quinoa production (SIPA, 2018). Processors and aggregators, on the other hand, usually receive aid from foreign organizations because the investment for infrastructure is high. The government has not played an important role in processing and marketing, as evidenced by Ecuador’s late entrance to the foreign market.
There is a concern that high quinoa prices, driven by the increase in foreign demand, may be hurting the nutrition of poor quinoa consumers in the Andes (Blythman, 2013; The Economist, 2016). Higher prices make quinoa less affordable for Andean consumers, who may either allocate the same level of expenditure to buy less quinoa than they did before the quinoa boom or allocate a higher level of expenditure to buy the same amount of quinoa, limiting their ability to afford other types of nutritious food (Stevens, 2017). Some evidence in the literature, however, concludes that higher quinoa prices benefited both quinoa consumers and producers (Stevens, 2017; Bellemare, Fajardo-Gonzalez, and Gitter, 2018).
These results can be explained in three ways. First, the majority of quinoa consumers in the rural areas of the Andes are also producers. Thus, they have profited from higher prices, which has enabled them to access other types of foods—fruit, vegetables, and, following Bennett’s Law, meat—making their diets more diverse (Gandarillas et al., 2015). Second, consumers who are not producers are not hurt because quinoa represents a small share (no more than 4%) of the average household’s food expenditure (Stevens, 2017). Last, Bellemare, Fajardo-Gonzalez, and Gitter (2018) speculate that there may have been a trickle-down effect from the increased welfare of net quinoa producers to net quinoa consumers.
Over the last two decades, demand for quinoa increased dramatically, leading to a sudden increase in price, which culminated in the quinoa price spike of 2014. Producers from Bolivia, Peru, and eventually Ecuador were motivated to produce more quinoa to supply increasing domestic and international demand. Farmers in these countries expanded both production area and intensity. The governments in these countries have supported quinoa production through research and development for enhanced varieties and access to credit and inputs. Nevertheless, support to processors and exporters has been limited.
Because quinoa is being produced more intensively, environmental concerns have been raised. In Bolivia, expansion into the southern Altiplano may have caused losses in productivity and land may have become more eroded. In Peru, use of pesticides in the coastal region may have not only caused harm to the environment but also may have violated the pesticide use restrictions of the United States, the European Union, and the Canadian markets. There is limited evidence to support these concerns and future work in this area is needed.
Recently, international prices of quinoa have declined, back to their pre-2010 levels. To remain competitive, Andean countries need to open new markets and explore the market for value-added products. These strategies will help quinoa producers thrive in the current stage of quinoa’s product life cycle.
Bazile, D., S.-E. Jacobsen, and A. Verniau. 2016. “The Global Expansion of Quinoa: Trends and Limits.” Frontier in Plant Science 7(622). Available online: https://www.frontiersin.org/articles/10.3389/fpls.2016.00622/full [Accessed July 03, 2020].
Bazile, D., E.A. Martinez, F.F. Fuentes, E. Chia, M. Namdar-Irani, P. Olguin, C. Saa, M. Thomet, and A. Vidal B. 2015. “Quinoa in Chile.” In D. Bazile, D. Bertero, and C. Nieto, eds. State of the Art: Report on Quinoa in the World in 2013. Rome, Italy: FAO and CIRAD, pp. 401–421.
Bellemare, M.F., J. Fajardo-Gonzalez, and S.R. Gitter. 2018. “Foods and Fads: The Welfare Impacts of Rising Quinoa Prices in Peru.” World Development 112: 163–179.
Belton, B., T. Reardon, and D. Zilberman. 2020. “Sustainable Commoditization of Seafood.” Nature Sustainability 8: 677-684.
Blythman, J. 2013, January 16. “Can vegans stomach the unpalatable truth about quinoa?” The Guardian. Available online: https://www.theguardian.com/commentisfree/2013/jan/16/vegans-stomach-unpalatable-truth-quinoa
Centre for the Promotion of Imports from Developing Countries (CBI). 2020. Exporting Quinoa to Europe. The Hague, Netherlands: Netherlands Enterprise Agency, Center for the Promotion of Imports. Available online: https://www.cbi.eu/market-information/grains-pulses-oilseeds/quinoa-grains/europe [Accessed June 15, 2020].
Centro Internacional de la Quinoa (CIQ). n.d. “Quinua: Superficie, Producción y Rendimiento por Año Agrícola.“ Bolivia: Centro Internacional de la Quinoa. Available online: https://si.ciq.org.bo/2019/11/26/quinua-superficie-produccion-y-rendimiento-por-ano-agricola/ [Accessed June 1, 2020].
Coelho, A.S., L. Deriaz, and M. Tokas. 2020. “Export Promotion of Selected Products to the EU and EFTA.” Geneva, Switzerland, Centre for Trade and Economic Integration, Graduate Institute of International and Development Studies, TradeLab. Available online: https://www.produccion.gob.ec/wp-content/uploads/2020/04/Tradelab-Final-Report.pdf .
El Comercio. 2014a, December 17. “Algunos Envíos de Quinua Peruana Fueron Rechazados en EE.UU.” El Comercio. Available online: https://elcomercio.pe/economia/peru/envios-quinua-peruana-rechazados-ee-uu-181901-noticia/.
El Comercio. 2014b. “Chimborazo Tiene 2 366 Productores de Quinua.” El Comercio. Available online: https://www.elcomercio.com/actualidad/negocios/chimborazo-366-productores-de-quinua.html.
Del Barco-Gamarra, M.T., G. Foladori, and R. Soto-Esquivel. 2019. “The Unsustainability of Bolivia's Quinoa Production.” Estudios Sociales 29(54).
Dirección General de Políticas Agrarias (DGPA-MINAGRI). 2017. “La Quinua: Producción y Comercio del Perú.” Lima, Peru: Dirección de Estudios Económicos e Información Agraria, Ministerio de Agricultura y Riego de Perú. Available online: http://www.minagri.gob.pe [Accessed June 30, 2020].
The Economist. 2016, May 21. “Quinoa – Against the Grain.” The Economist.
Enriquez, C. 2018, August 28. “La Quinua Perdió Protagonismo por Baja en el Mercado Mundial.” Revista Líderes. Available online: https://www.revistalideres.ec/lideres/ quinua-menorprotagonismo-mercado-ecuador-produccion.html.
Fairlie, A. 2016. La Quinua en el Perú- Cadena Exportadora y Políticas de Gestión Ambiental. Lima, Peru: Pontificia Universidad Católica del Perú, Instituto de Ciencias de la Naturaleza, Territorio y Energías Renovables (INTE-PUCP).
Food and Agriculture Organization of the United Nations (FAO). 2020a. FAOSTAT- Crops. Available online: http://www.fao.org/faostat/en/#data/QC [Accessed April 1, 2020].
Food and Agriculture Organization of the United Nations (FAO). 2020b. FAOSTAT- Producer Prices. Available online: http://www.fao.org/faostat/en/#data/PP [Accessed April 1, 2020].
Gandarillas, A., W. Rojas, A. Bonifacio, and N. Ojeda. 2015. “Quinoa in Bolivia: The PROINPA Foundation's Perspective.” In D. Bazile, D. Bertero, and C. Nieto, eds. State of the Art: Report on Quinoa in the World in 2013. Rome, Italy: FAO and CIRAD, pp. 344–361.
Google Trends. 2020. https://trends.google.com/trends/explore?q=quinoa&geo=US [Accessed July 1, 2020]
Grossman, G.M., and E. Helpman. 1991. “Quality Ladders and Product Cycles.” Quarterly Journal of Economics 106(2): 557–586.
International Trade Center (ITC). 2020. “List of Exporters for the Selected Product. Product: 100850 Quinoa “Chenopodium quinoa.’” Trade Map. Available online: https://www.trademap.org/Country_SelProduct_TS.aspx?nvpm=1%7c%7c%7c%7c%7c100850%7c%7c%7c6%7c1%7c1%7c2%7c2%7c1%7c2%7c2%7c1%7c1 [Accessed July 15, 2020].
Latorre, J.P., and S.-E. Jacobsen. 2017. “Is Quinoa Cultivation on the Coastal Desert of Peru Sustainable? A Case Study from Majes, Arequipa.” Aarhus, Denmark: Aarhus Universitet, Department of Agroecology.
Ministerio de Comercio Exterior y Turismo (MINCETUR). 2020. “Plan Estratégico Nacional Exportador (PENX) 2025.” Plataforma Digital Única del Estado Peruano. Available online: https://www.gob.pe/institucion/mincetur/informes-publicaciones/21903-plan-estrategico-nacional-exportador-2025 [Accessed June 1, 2020].
Peralta, E., and N. Mazón. 2015. “Quinoa in Ecuador.” In D. Bazile, D. Bertero, and C. Nieto, eds. State of the Art: Report on Quinoa in the World in 2013. Rome, Italy: FAO and CIRAD, p. 388–400.
Peterson, A., K.M. Murphy. “Quinoa in the United States of America and Canada.” In D. Bazile, D. Bertero, and C. Nieto, eds. State of the Art: Report on Quinoa in the World in 2013. Rome, Italy: FAO and CIRAD, p. 549-561
Risi, J., W. Rojas, and M. Pacheco, eds. 2015. Producción y Mercado de la Quinua en Bolivia. La Paz, Bolivia: Instituto Interamericano de Cooperación para la Agricultura.
Soto, E., ed. 2015. El Mercado y la Producción de Quinua en el Perú. Lima, Peru: Instituto Interamericano de Cooperación para la Agricultura.
Sistema de Información Pública Agropecuaria (SIPA). 2018. Boletín Situacional- Quinua 2018. Quito, Ecuador: Ministerio de Agricultura y Ganaderia de Ecuador. Available online: http://sipa.agricultura.gob.ec/index.php/granos/quinua [Accessed May 30, 2020].
Stevens, A.W. 2017. “Quinoa Quandary: Cultural Tastes and Nutrition in Peru.” Food Policy 71: 132–142.
Winkel, T., R. Alvarez-Flores, J. Bourliaud, M. Chevarría-Lazo, G. Cortes, P. Cruz, C. Del Castillo, et al. 2015. “The Southern Altiplano of Bolivia.” In D. Bazile, D. Bertero, and C. Nieto, eds. State of the Art: Report on Quinoa in the World in 2013. Rome, Italy: FAO and CIRAD, pp. 362–377.

