There are three major types of workers employed on U.S. farms: farm operators, unpaid family members, and hired workers. During the 1990s, when USDA’s National Agricultural Statistics Service (NASS) collected data on all three types of workers, there were an average two million farmers and unpaid family workers and 1.3 million hired workers employed on farms, meaning that farmers and unpaid family members accounted for 60% of average farm employment. The numbers of all three types of workers on farms have trended downward, but farmers and unpaid family members today likely contribute over half of the hours worked on U.S. farms.
Hired workers are not employed evenly throughout U.S. agriculture. Instead, they are concentrated in three inter-related ways, by commodity, geography, and size of farm. Fewer than 75,000 producers of fruits, vegetables, and horticultural specialty crops (collectively known as FVH commodities) paid half of the $26 billion in farm labor expenses in 2007, according to the Census of Agriculture. Most of these expenses were paid by large farm employers in California, Florida, Texas, and Washington.
Hired farm workers, especially those employed on FVH farms, are mostly immigrants from Mexico. Before the Immigration Reform and Control Act of 1986, (IRCA) the best evidence suggested that up to a quarter of hired farm workers in southwestern states such as California were unauthorized. Their distribution in the early 1980s reflected the risks to producers of completing tasks in a timely way under the pre-1986 enforcement strategy, which involved driving into fields and checking workers. The highest share of unauthorized workers were employed working with less perishable crops such as citrus, while there were fewer unauthorized workers working with more perishable leafy green vegetables (Martin, Mines, Diaz, 1985).
Today roughly half of hired farm workers on crop farms are believed to be unauthorized. There are unauthorized workers throughout FVH agriculture and on dairy and other livestock farms, and there are few differences in shares of unauthorized workers categorized according to the perishability of a commodity. Indeed, the share of unauthorized workers employed on Vermont dairies or North Carolina vegetable farms appears to be similar to that on California fruit and vegetable farms (Martin, 2009).
This article summarizes the changing status of hired workers employed on crop farms. Data are drawn primarily from the U.S. Department of Labor’s National Agricultural Workers Survey (NAWS), which has been interviewing 2,000 to 3,000 farm workers a year since 1989. The NAWS, launched to determine if the 1986 IRCA contributed to farm labor shortages, has continued to generate a wealth of information on hired farm workers and their families. The NAWS does not interview workers employed on livestock farms and excludes H-2A guest workers on crop farms.
Less than a quarter of the 2.2 million U.S. farms reported expenses for hired labor in the 2007 Census of Agriculture (COA). Approximately 482,000 farms reported almost $22 billion in labor expenses for workers hired directly by the farm operator and $4.5 billion for contract labor—workers brought to farms by labor contractors and other intermediaries—totaling $26 billion or a seventh of total variable production expenses in agriculture.
Farmers report to the COA the number of workers they hire directly. They reported 2.6 million hires in 2007, including 35%—or 910,000 workers—which were hired for 150 days or more on their farms. This 2.6 million jobs-on-farms number must be interpreted carefully. It does not include workers brought to farms by contractors, and it double counts individuals who are employed on two farms and reported by two farmers.
The National Agricultural Statistics Service (NASS) surveys farm employers quarterly to obtain employment and earnings data on hired workers. No survey was conducted in January 2007, but in April 2007 farm employers reported 736,000 directly hired workers and 253,000 agricultural service workers, a total of 898,000. In July 2007 843,000 hired workers and 363,000 agricultural service workers were reported totaling 1.2 million workers. In October 2007, 806,000 hired workers and 316,000 service workers were reported. Average hired worker employment over these quarters was 1.1 million.
| 2002 | 2007 | |
|---|---|---|
| Farm Labor Expenditures ($ billion) | 22 | 26 |
| Average Hourly Earnings ($ hour) | 8.80 | 10.21 |
| Estimated Hours Worked (millions) | 2,500 | 2,547 |
| Estimated FTE Jobs (millions) | 1.20 | 1.22 |
Table 1 combines labor expense data from the COA and earnings data from NASS to estimate the number of full-time equivalent (FTE) or 2,080 hour-a year jobs on U.S. farms. It divides labor expenses of $26.4 billion by NASS’s annual average hourly earnings of $10.21 for hired farm workers in 2007 to estimate that there were 1.2 million FTE jobs in 2007; results were similar for 2002. To put hired farm worker employment in perspective, food manufacturing employment averages about 1.4 million jobs, including 500,000 in meatpacking.
There are more farm workers than the average number of farm jobs because of seasonality and turnover, that is, more than 1.2 million individuals work on farms during a typical year in order to fill peak employment requirements and to account for the fact that many workers are employed less than a full year. During the 1980s, the number of individuals employed sometime during the year for wages on U.S. farms was 2.5 million according to the December Current Population Survey (Oliveira, 1989). A count of unique individuals reported by agricultural establishments to unemployment insurance (UI) authorities in California, a state that requires all employers paying $100 or more in quarterly wages to provide UI coverage to workers, found two individuals employed for each FTE farm job in the 1990s (Khan, Martin, Hardiman, 2004). If we apply this same two-to-one ratio between workers and FTE jobs today, there are 2.4 million hired farm workers across the United States, including 800,000 in California.
The NAWS finds a mostly young, Mexican-born, and male agricultural work force working on crops. In recent years, 70% of crop workers were born in Mexico, three-fourths were male, and half were unauthorized. Half of crop workers were under 35, two-thirds had less than 10 years schooling, and two-thirds spoke little or no English.
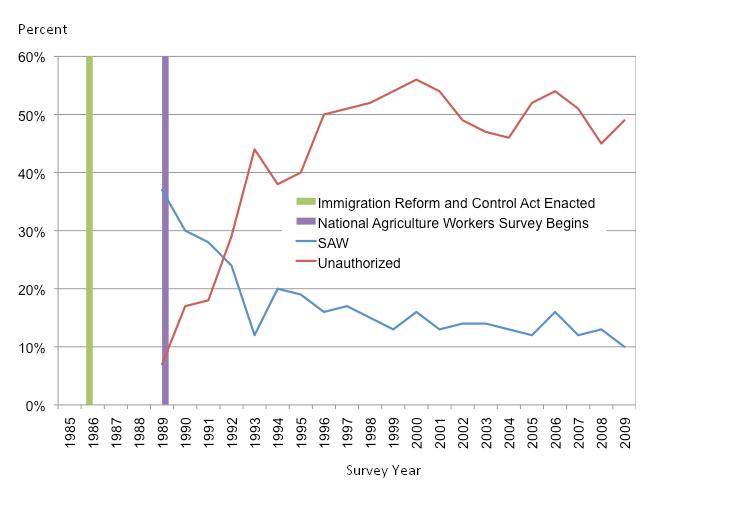
Some 1.1 million unauthorized farm workers were legalized in 1987-88 under the Special Agricultural Workers (SAW) program, and there were four SAWs for each unauthorized worker in the first NAWS survey in 1989 (see Figure 1).
By 1991 the declining share of SAWs among hired farm workers was matched by the rising share of unauthorized workers, and by the mid-1990s there were almost four unauthorized workers for each legalized SAW worker. Unauthorized workers have continued to be about half of crop workers, but the share of SAWs has declined to less than 10 percent. These data suggest that, if there were to be another legalization of unauthorized workers, most would leave farm work within five years.
Between 2007 and 2009, almost 30% of crop workers were born in the United States and 70% were born abroad, almost always in Mexico. Table 2 shows that foreign-born and U.S.-born workers were similar in many respects. Their average age was 36-37 and 77-78% were male. About the same share of foreign-born and U.S.-born workers had incomes below the poverty line, a third of foreign-born families received some means-tested welfare benefit versus a quarter of U.S.-born families, and very few workers were follow-the-crop migrants.
| All | U.S. Born | Foreign Born | |
|---|---|---|---|
| Demographics | |||
| Authorized (%) | 52 | 100 | 45 |
| Male (%) | 78 | 77 | 78 |
| Average age (%) | 36 | 37 | 36 |
| At least high school education (%) | 28 | 68 | 13 |
| Speak English well (%) | 30 | 97 | 3 |
| Married (%) | 59 | 44 | 69 |
| Families < poverty income (%) | 23 | 23 | 23 |
| Families receiving welfare benefits (%) | 30 | 23 | 32 |
| Follow-the-crop migrant (%) | 6 | 1 | 7 |
| Farm Work | |||
| Age at first farm job (years) | 23 | 22 | 23 |
| Average years of farm work | 13 | 14 | 12 |
| Directly hired (%) | 88 | 98 | 83 |
| >10 years with current employer (%) | 17 | 20 | 15 |
| >4 farm employers in past year (%) | 1 | 0 | 1 |
| FVH crops (%) | 78 | 56 | 88 |
| Harvest and post-harvest jobs (%) | 45 | 27 | 52 |
| Wages, Benefits, Plans | |||
| Average hourly earnings ($) | 9.13 | 9.74 | 8.89 |
| Farm days worked in past year | 194 | 180 | 200 |
| Has health insurance in current job (%) | 18 | 26 | 14 |
| Plan to continue to farm work > 5 years (%) | 73 | 76 | 78 |
| Could find nonfarm job < 1 month (%) | 44 | 76 | 31 |
In other respects, foreign-born differ significantly from U.S.-born crop workers. For example, 55% are unauthorized, only 13% completed high school, and only 3% spoke English well. Foreign-born crop workers are also more likely than U.S.-born crop workers to be married.
Foreign-born and U.S.-born crop workers got their first farm jobs at age 22-23 and had completed an average 13 years of farm work when interviewed. However, foreign-born workers were more likely to be hired by contractors and other intermediaries (17%), were more likely to be working in FVH crops (88%), and more likely to be filling harvest and post-harvest jobs (52%). Almost 40% of U.S.-born workers were employed in field crops such as corn and grains, and over 35% were employed in nurseries.
U.S.-born workers had average hourly earnings of $9.74 in 2007-09, almost $1 more than the average $8.89 of foreign-born workers. Foreign-born workers had more days of farm work in the past 12 months, 200 versus 180, and were less likely to have health insurance provided by their current farm employer. A seventh of foreign-born workers, versus a quarter of U.S.-born workers, had employer-provided health insurance in their current job.
Over three-fourths of foreign-born workers, and two-thirds of U.S.-born workers, planned to continue working in agriculture at least five more years. A third of the foreign-born, versus two-thirds of the U.S.-born, said they could find a nonfarm job within a month.
Table 3 examines two groups of farm workers whose share of crop workers changed over time. SAW-legalized farm worker employment, including a few workers legalized under the general legalization and Central American programs, fell from 32% of the agricultural work force to 16% between 1989-91 and 1998-00; their share has since stabilized at just over 10% of crop workers. Foreign-born newcomers—workers in the United States less than a year before they were interviewed—rose sharply during the 1990s to almost a quarter of all crop workers in 1998-00, and fell to less than 10% of workers between 2007 and 2009.
As would be expected, SAW-legalized workers are much older than newcomers: their average age was 49 in 2007-09, versus 25 for newcomers. Three-fourths of the SAW-legalized workers did not move, but a quarter returned to Mexico , usually over the Christmas holidays. Over 90% of the newcomers moved from Mexico to the United States in the year before they were interviewed.
SAW-legalized workers had less education than newcomers, an average five versus six years of schooling in 2007, but were more likely to speak English well and to have incomes above the poverty line. By contrast, 94% of newcomers had below-poverty level incomes. Almost one-third of the newcomers worked for labor contractors, versus just 12% of SAW-legalized workers in 2007. Newcomers, many of whom were in the United States less than 12 months before being interviewed, had fewer days of farm work than SAW-legalized workers, who have been doing farm work for two decades.
| SAW-Legalized | Foreign-Born Newcomers | |||||
|---|---|---|---|---|---|---|
| 1989-91 | 1998-00 | 2007-09 | 1989-91 | 1998-00 | 2007-09 | |
| Share of workers (%) | 32 | 16 | 13 | 4 | 22 | 9 |
| Demographics | ||||||
| Authorized (%) | 100 | 100 | 100 | 13 | 1.4 | 0.1 |
| Male (%) | 86 | 86 | 84 | 74 | 88 | 88 |
| Average age (years) | 31 | 40 | 49 | 23 | 25 | 25 |
| Average years of education | 5.3 | 5.3 | 5.2 | 8.1 | 6.2 | 6.1 |
| Speak English (%) | 3.0 | 4.8 | 2.3 | 7.3 | 0.4 | 0.1 |
| Married (%) | 62 | 77 | 86 | 42 | 36 | 33 |
| Families |
na | 38 | 12 | na | 94 | 94 |
| Families receiving public assistance(%) | 14 | 26 | 22 | 2 | 2 | 2 |
| Follow-the-crop migrant (%) | 25 | 13 | 3 | 16 | 14 | 7 |
| Farm Work | ||||||
| Average years of farm work | 8 | 16 | 25 | 1 | 1 | 1 |
| Directly hired (%) | 75 | 76 | 88 | 58 | 60 | 70 |
| FVH crops (%) | 85 | 87 | 88 | 93 | 77 | 93 |
| Harvest and post-harvest jobs (%) | 59 | 40 | 46 | 72 | 45 | 51 |
| Wages, Benefits, Plans | ||||||
| Average hourly earnings ($) | 5.50 | 6.95 | 9.84 | 4.91 | 5.98 | 7.88 |
| Federal minimum wage ($) | 3.80 | 5.15 | 7.25 | 3.80 | 5.15 | 7.25 |
| Farm days worked in past year | 191 | 193 | 226 | 77 | 76 | 90 |
| Has health insurance in current job (%) | 18 | 27 | 3 | 4 | ||
| Could find nonfarm job <1 month (%) | 45 | 40 | 38 | 20 | 13 | 12 |
About 90% of both SAW-legalized and newcomer workers are concentrated in FVH commodity production, a pattern that has not changed over the past two decades. The share of both SAW-legalized and newcomer workers filling harvest and post-harvest jobs has been falling, and was half or less in 2007-09.
SAW-legalized workers earned an average 1.5 times the federal minimum wage in 1989-1991, but their average premium over the minimum wage fell in subsequent periods. Newcomers earned a 30% premium over the federal minimum wage in 1989-91, and their premium has continued to fall, so that it was only 10% above the federal minimum wage in 2007-09. A third of SAW-legalized workers, but only an eighth of newcomers, believe they could get a nonfarm job in a month.
In a hired farm work force that numbers 2.5 million individuals sometime during a typical year, equivalent to the average number of janitors and cleaners, farm worker averages can be misleading. For example, almost all foreign-born farm workers were born in Mexico, but increasingly Mexican-born U.S. farm workers are from southern Mexico rather than west-central Mexico, the origin of Braceros—Mexican guest workers admitted between 1942 and 1964. Some Spanish-speaking west-central Mexicans have become supervisors of newly arrived indigenous workers from southern Mexico who do not speak English and may not speak Spanish well, reflecting the growing complexity of the hired farm work force.
The NAWS has found a more stable crop work force in recent years, one that is older, that is obtaining more days of farm work, and more inclined to remain as farm workers. The share of workers with more than 10 years of experience rose from 30% in 1999-00 to 45% of the workforce in recent years, which could reflect more difficulties finding nonfarm jobs and fewer newcomers, so that farm employers make more efforts to retain current workers.
Average hourly earnings have been rising slowly, from $7.54 in 2000 to $10.36 in 2011, up 37%—in nominal terms—but just 5% in real terms. Annual farm worker earnings rose as well. About 40% of farm workers reported $5,000 to $15,000 in farm earnings in 1999-00, compared to 35% in 2009-10, meaning that more workers were in higher income brackets, Meanwhile, the share of workers earning over $20,000 rose from less than 5% to almost 25%.
Half of crop and nursery workers remain unauthorized, which helps to explain the keen interest of farm employers in immigration reforms that could require them to fire experienced workers. The Agricultural Jobs, Opportunity, Benefits and Security Act (AgJOBS) negotiated by worker and employee advocates in December 2000 would have repeated IRCA’s legalization and E-Z guest worker approach to farm workers with several important changes (Rural Migration News, 2009). Like the SAW program, if passed AgJOBS would have allowed currently unauthorized farm workers to legalize their status and to “earn” a regular immigrant status for themselves and their families. Those legalized under AgJOBS would have to continue to do farm work. The purpose of tying newly legalized workers to continued farm work under AgJOBS is to prevent an immediate exodus of newly legalized farm workers to nonfarm jobs.
The most recent version of AgJOBS, S 1038 and HR 2414 introduced in May 2009, would have allowed up to 1.35 million unauthorized farm workers who did at least 150 days or 863 hours of farm work in the 24-month period ending December 31, 2008 to apply for Blue Card probationary status. Blue Card holders could work and travel freely within the United States and enter and leave the United States, and could earn an immigrant status for themselves and their families by continuing to do farm work over the next three to five years. AgJOBS had three farm work options to earn citizenship: (1) performing at least 150 days (a day is at least 5.75 hours) of farm work a year during each of the first three years after enactment; (2) doing at least 100 days of farm work a year during the first five years after enactment; or (3) working at least 150 days in any three years, plus 100 days in a fourth year (for workers who do not do 150 days in the first three years) after enactment.
For six years, farm employers of Blue Card holders would have to provide Blue Card employees with written records of their farm work and submit a copy to the Department of Homeland Security or face fines of up to $1,000. After documenting their continued farm work, Blue Card holders could pay fees and fines and become immigrants, and make their family members legal immigrants at the same time.
AgJOBS would change the H-2A program in three major ways to make it easier for farmers to recruit and employ legal guest workers. First, attestation would replace certification, effectively shifting control of the border gate from the U.S. Department of Labor to employers, who would make assertions (assurances) to DOL that they have vacant jobs, are paying at least the minimum or prevailing wage, and will comply with other H-2A requirements. DOL would review employer assurances for "completeness and obvious inaccuracies" and approve them within seven days of receipt.
Second, rather than provide the free housing to H-2A and out-of-area U.S. workers that is currently required, AgJOBS would allow farm employers to pay a housing allowance of $1 to $2 an hour, depending on local costs, to rent two-bedroom units, provided state governors certified that there is sufficient rental housing for the guest workers in the area where they will be employed. Third, the Adverse Effect Wage Rate (AEWR)—the minimum wage that must be paid to legal guest workers—would be frozen at the 2008 level and studied, effectively reducing it by $1 to $2 an hour and offsetting the cost of the housing allowance.
The United States has what has been called an “apartheid farm workforce” of mostly older, white and U.S. citizen farm employers and mostly young, Hispanic, and foreign-born hired workers. If current trends continue, new hired workers will continue to be born outside the United States, while future farmers will be born in the United States.
Hiring farm workers increasingly means navigating the immigration system to check the legal status of newly hired workers and to ensure that special regulations governing guest worker recruitment and employment are followed. The share of hired workers on crop farms who are unauthorized has been about half for much of the past two decades. NAWS data suggest that this unauthorized work force is stabilizing as fewer newcomers increase average days of farm work and farm earnings. The question is whether and how these workers will be replaced by new foreign-born workers. Will they be newcomers who are unauthorized, as occurred over the past two decades; will they be legal guest workers admitted under a revised H-2A program; or will aging farm workers be replaced by machines and trade?
Khan, A, Martin, P and Hardiman, P. (2004). Expanded production of labor-intensive crops increases agricultural employment. California Agriculture. January-March. Pp35-39. http://californiaagriculture.ucanr.org/landingpage.cfm?article=ca.v058n01p35&fulltext=yes
Martin, Philip. (2009). Importing Poverty? Immigration and the changing face of rural America. Yale University Press. http://yalepress.yale.edu/yupbooks/book.asp?isbn=9780300139174
Martin, P, Mines, R and Diaz, A. (1985). A profile of California farmworkers. California Agriculture. May. 16-18. http://californiaagriculture.ucanr.org/landingpage.cfm?article=ca.v039n05p16&abstract=yes
NASS. Various years. Farm Labor Survey http://usda.mannlib.cornell.edu/MannUsda/viewDocumentInfo.do?documentID=1063
NASS. (2009). Census of Agriculture: 2007
NAWS. various years. National Agricultural Workers Survey. http://www.doleta.gov/agworker/naws.cfm
Oliveira, V. (1989). Trends in the hired farm work force, 1945-87. Washington: United States Department of Agriculture, Economic Research Service, Agricultural Information Bulletin 561
Rural Migration News. (2009). AgJOBS: Provisions, eligibility. Vol 15. No 3. July. http://migration.ucdavis.edu/rmn/more.php?id=1466_0_4_0

