2nd Quarter 2011
Agriculture is a major contributor to the U.S. economy and vital to the continued availability of a safe and inexpensive food supply. In 2007, the value of products sold was $297 billion (USDA, 2007 Census of Agriculture), a 48% increase over 2002. The total number of farms during this period increased by 4% (75,810 farms) and 291,329 new farms began operation.
While the average age of farm operators continues to increase, the number of beginning farmers and ranchers, defined as those that have not been operating a farm for more than 10 years, increased slightly (0.6%) from 2002 to 2007. The number of operators with the least experience (two years or less) grew by more than 28% over the five year period while those with five to nine years experience decreased by 6.8%. This indicates a marked need for additional outreach and educational efforts designed for beginning farmers and ranchers to continue the increase in beginning farms and ensure these producers are still engaged in farming after 2 years.
There are many factors that impact the success or failure of beginning farmers and ranchers. A lack of capital and experience in farming, smaller operations, and high land values and production expenses (Mishra, et al., 2002) are but a few of the challenges faced by beginning farmers and ranchers.
In an effort to provide beginning farmers and ranchers with a comprehensive, whole farm approach to decisions related to production practices, farm structure and marketing strategies, the Food and Agricultural Policy Research Institute at the University of Missouri (FAPRI-MU) has adapted an existing representative farm framework and focused it on beginning producers in Missouri. This three-year project will culminate in the fall of 2012 with web-based decision support tools for all beginning farmers and ranchers.
Beginning farm and ranch representative farms were created utilizing a methodology developed by the Agricultural and Food Policy Center (AFPC), at Texas A&M University, in 1981, and first utilized by FAPRI-MU in 1990. In addition, ten year baseline data from the FAPRI-MU modeling system (FAPRI-MU, March 2010) and simulations using the Farm Level Income and Policy Simulation (FLIPSIM) model (Richardson and Nixon, 1986) were incorporated.
The collaborative efforts of AFPC and FAPRI-MU since 1990 have resulted in the development and maintenance of 98 representative farms, in 28 states, with a wide range of commodity coverage. An additional 30 farms have been developed and maintained within the state of Missouri by FAPRI-MU resulting in a database of 128 representative farms consisting of computer-simulated models of established farms and ranches. Each of these computer-simulated “representative” farms is developed with input from a panel of approximately four to eight producers. The data collection is an iterative process of focus group sessions initiated by a local facilitator working closely with AFPC and FAPRI-MU researchers to collect data that would be representative of a farm in the region with detail collected regarding farm structure, existing assets and liabilities, input costs, farm income and machinery needed to operate the farm. New data are collected or updated for each of the 128 representative farms in a three-year, revolving schedule.
| Farm Type | Number of Farms | Acres (Min/Max) | Livestock (Min/Max) | Receipts ($1,000) (Min/Max) | Debt/Asset Ratio |
| Feedgrain-soy | 10 | 890/4,000 | 0/0 | $342/$2,180 | 20% |
| Cotton and rice | 3 | 1,600/4,000 | 0/0 | $765/$2,582 | 20% |
| Crop-beef | 9 | 655/2,955 | 40 cows/250 cows | $257/$1,141 | 20% |
| Pork-crop | 4 | 0/1,015 | 200 sows/1,500 sows | $426/$5,152 | 35% |
| Beef | 5 | 650/2,125 | 150 cows/400 cows | $136/$293 | 4% |
| Dairy | 5 | 245/625 | 110 cows/500 cows | $432/$2,306 | 30% |
| Broiler-beef | 2 | 200/225 | 4 houses/6 houses | $149/$206 | 20% |
Table 1 provides an overview of the characteristics of the traditional representative farms in Missouri. With these models of established farms, debt to asset ratios range from 4% to 35% with a median of 20%. The debt to asset ratios are not actual debt levels set by the producers assisting with data collection, but levels that are set based on the category into which the farm fits. Debt levels are initially set based on the major commodities associated with that farm.
A unique capability of the representative farm system is the ability to assess how much risk each modeled farm may encounter. This is accomplished through the use of projected prices, input costs and policy parameters from the FAPRI-MU annual baseline and incorporating historical risk components from AFPC’s FLIPSIM whole farm simulation model. FLIPSIM, in conjunction with the FAPRI-MU stochastic baseline which incorporates historic variability, simulates the farm 500 times per year of the analysis. The outcomes of these 500 simulations are tabulated and probabilities are reported. The probability of a cash flow deficit, ending cash being negative, and the farm losing real net worth are just a few of the parameters used to determine how much risk the farms are facing.
The representative farm approach treats a farm business unit as a unique system characterized by local features and resources and assumes adaptations are made by farm management. Local conditions are internalized in the creation and simulation of each farm. The first phase in the creation of a representative farm begins with a local facilitator coordinating meetings for four to eight producers in a given area that are similar in size, structure and type of farming or ranching operation. In the case of this research, these producers were also required to meet USDA’s definition of a beginning farmer or rancher with ten or fewer years associated with operating their own farm enterprise. For this research four representative farms were developed throughout the state of Missouri relying upon seasoned University of Missouri extension specialists that had a proven track record in facilitating a representative farm creation and maintenance process over a multi-year timeframe. Data are collected and validated by participants via a consensus process. Producers establish farm structure, size, production practices, production costs and financial requirements for the representative farm drawing upon their own individual operations and experience. Table 2 provides an overview of the characteristics of the four beginning farmer and rancher representative farms developed.
| Farm | Farm Type | Acres | Livestock | Receipts ($1,000) | Debt/Asset Ratio |
| Southwest Cow/Calf | Beef | 710 | 180 cows | $139 | 36% |
| Northeast Feedgrain & Cow/calf | Crop-beef | 830 | 60 Cows | $337 | 53% |
| North Central Feedgrain & Cow/calf | Crop-beef | 550 | 15 Cows | $257 | 74% |
| West Central Feedgrain | Feedgrain-soy | 400 | 0 | $237 | 34% |
Business size, structure and management practices are held constant for the simulation period of 2007 through 2014. For simulation, actual yield, price and operating cost data are utilized for the years 2007 through 2009. This historical data set provides some perspective of simulated financial performance with a known set of variables and provides a point of reference for the five-year projection period.
Farm and ranch financial statements are generated using FLIPSIM from AFPC and price, yield and cost data from FAPRI-MU for the 2010 to 2014 simulation. The financial statements include: (a) income statement, (b) cash flow and (c) balance sheet, and are utilized by the participants to ensure the simulated farm is performing in a realistic manner over the historic period. Once these results are validated by the participants, projected financial statements are prepared for the 2010 through 2014 period and referenced as the “baseline farm”. Information conveyed to participants also includes a risk assessment associated with how likely the representative farm is to cash flow year in and year out.
At least two, and no more than four, alternatives are developed by participants within each representative farm. Parameters that can be altered include farm size, structure and production practices, and can be single or multi-year adaptations. The same methodology is applied to each alternative, and comparisons of the three financial statements and the risk assessment score are available for comparison to the baseline farm simulation. A short-term and intermediate-term risk assessment score is assigned to the baseline and alternatives, as many farming and ranching decisions can have severe short-term cash flow risks and result in longer-term risk reduction.
Updates for each beginning representative farm or ranch were necessary every year, not every three years as had been the case with the traditional representative farms. This adaptation in scheduling representative farm updates provides the ability to work closely with beginning producers as they are contemplating annual changes and allows more timely feedback. While critical changes in farm structure or financial liquidity may happen for any existing farm, the likelihood of this occurring for beginning farmers and ranchers is much higher, and the need to collect data more frequently is therefore more critical. According to data from the U.S, Census Bureau the percent of farm operators in Missouri actively engaged in farming for less than ten years increased by only 0.3% from 2002 to 2007. However the number of producers that had been engaged in farming for two years or less increased by 25.3%. These figures indicate that years five through nine may be the most critical period for significant changes in many beginning farming and ranching operations.
In the traditional representative farm framework, scenarios are often analyzed using the baseline as a benchmark. The scenarios that are developed result primarily from policy debates and Congressional requests while focusing on farm-level impacts of changes in existing agricultural policy or substantial changes in the macro-economy. With respect to the beginning representative farms and ranches, scenarios analyzed were: (a) determined by the representative farm participants and (b) related to changes in farm structure or production and not policy. An adjustment to FLIPSIM was provided by AFPC to allow for the establishment of new debt in any year for major capital changes.
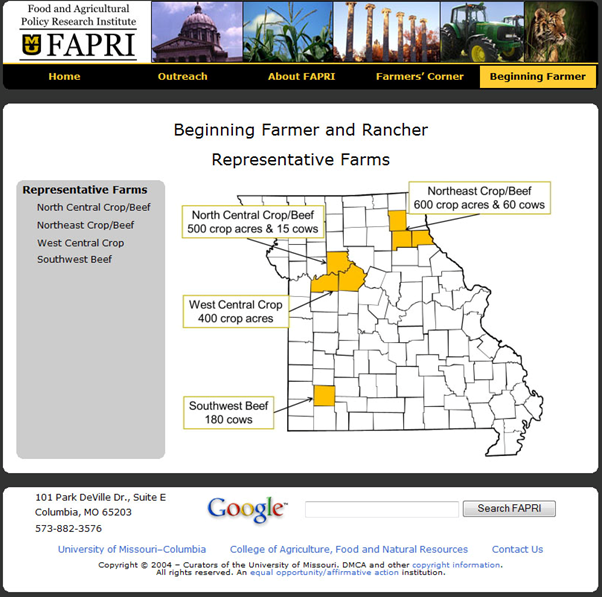
Traditionally, the results of representative farm analysis are included in reports and presented to policy makers, farm commodity groups, and at extension or professional meetings. The establishment of a beginning farmer and rancher section of the FAPRI-MU website will be used to enhance the traditional delivery methods. Reports and presentations are being developed and disseminated to the producers as well as being made available to the public via the web site. Also, a section of the web site will contain details not traditionally available for the existing representative farms (Figure1). Users will be able to browse the four representative farms, look at how the farms are structured, look at key input characteristics, and view output tables and graphics for the baseline, as well as the producer defined alternatives. Furthermore, the alternatives will be summarized, as well as broken down into the components, to show the economic impact of the alternative as a whole and in parts.
The creation of an advisory council comprised of extension specialists, agricultural lenders, agricultural producers, and agency staff experienced in beginning farmer and rancher programs has added depth to the planning and implementation of this beginning representative farm and ranch process. The combined effort of the individuals on the advisory council has increased participation and trust in the research as well as provided a validation component to the output. The national network of agricultural educators, advocates and beginning farmer support structure that the advisory council provides will prove invaluable in the dissemination and evolution of the online, risk management tools.
An additional focus during year two of this research is also an enhancement to the existing representative farm approach. Each representative farm participant has been given the opportunity to work in a one-on-one, confidential setting with a FAPRI-MU researcher to develop individual financial and risk assessments for their own farming operations through modifications to the newly created beginning representative farms. This customization has not been available to past representative farm participants and provides an opportunity for beginning producers to analyze potential impacts on their own enterprises of alternative scenarios. Participation in this portion of the research was voluntary for the participants, and will not be reported in any form during or after the research project.
A significant enhancement to the FAPRI-MU beginning farmer and rancher website will be the inclusion of online and downloadable tools. These tools, with input from beginning farmers and ranchers and stakeholders groups is currently in the initial design and development stage. Once completed, users will be able to utilize an online tool to construct a farm, consisting of commodities currently included in the FAPRI-MU baseline, and analyze the profitability of that operation over a 5-10 year future planning horizon. The user will have limited data entry requirements since the tool will have the entire FAPRI-MU baseline data at its core. Additionally, users will be able to change key inputs and see how those changes impact the profitability of the constructed farm.
Data collection via a survey is an additional component which was not part of the original research design, but is being conducted based on the team’s assessment that a broader sample of information was needed. A significant resource commitment is required for the creation and maintenance of the online risk management system. For this reason, stakeholder input is vital to ensuring an online system is developed that is applicable, easily accessible, user friendly and in a format that has a higher probability of being utilized. The survey provides the opportunity to collect data related to preferences and computer capabilities from a small sampling of beginning farmers and ranchers to increase the likelihood of adoption and use of the online risk management tools.
The survey tool contains 29 data collection variables and is available in a hard-copy or online version. The first half of the survey contains basic questions related to demographic information for the producer or potential producer, farm size and structure, and state where farming or ranching occurs. The second half of the survey contains questions related to computer and technology access, preferences for online format and usage.
The survey was first disseminated in conjunction with the Start2Farm conference hosted by the American Farm Bureau Federation Young Farmers and Ranchers (YF&R) conference and USDA’s National Agricultural Library. This venue offered an opportunity to collect data from agricultural producers from multiple states engaged in diverse agricultural production. Subsequent surveys have been disseminated at conferences in Missouri to gain additional insight.
Information regarding the online survey is being shared with multiple agencies and organizations as well as other recipients of Beginning Farmer and Rancher Development Project grants through USDA. The online survey may be found at: http://www.fapri.missouri.edu/beginning_farmers/survey/index.asp
The initial design for the online risk management system is in the planning stage and will utilize information gleaned from surveys, panel participants and the advisory council. An iterative process involving beta versions of the online tools and testing by panel participants and advisory council members will be utilized. The finalized online tools will be available in 2012, and will be available on the FAPRI-MU website. These tools will initially be focused on farms with characteristics similar to the four beginning representative farms. Additional funding and further research will allow more diversification in the number and type of representative farms and risk management tools available.
A comparison of Table 1 and Table 2 provides insight into initial research findings related to similarities and differences of the beginning representative farms and the traditional representative farms. Quantitative analysis indicates higher debt-to-asset ratios for the beginning representative farms. The debt-to-asset ratio for the beginning representative farms was derived differently than the traditional representative farms. For the beginning representative farms, it was determined when the farm actually came into existence and purchased the land and buildings. It was then determined how much long term debt would be left at the beginning of the simulation period (2007). Knowing the value of the long term debt in 2007 and how much was still owed on it, the beginning debt-to-asset ratio was calculated.
The Southwest Cow/Calf farm has a debt to asset ratio of 36% compared to an average of 4% for the five existing Missouri beef representative farms. The Northeast and North Central feedgrain and cow/calf farms have an average debt to asset ratio of 64% compared to an average of 20% for the nine existing Missouri feedgrain and cow/calf farms. The West Central feedgrain farm has a debt to asset ratio of 34% compared to an average of 20% for the ten existing Missouri feedgrain/soy farms. These beginning farms and ranches are typically more leveraged than existing farms and ranches, and thus, face more financial risks resulting in a higher probability of a cash flow deficit in both the short and intermediate terms. Access to government supported financing options through agencies in Missouri such as the Missouri Agricultural and Small Business Development Authority (MASBDA) and USDA’s Farm Service Agency (FSA) in collaboration with Missouri’s Farm Credit Service, FCS Financial ,and commercial lenders provides a critical risk reducing component – lower interest rates and an increased loan repayment timeframe.
The results of the initial baseline and alternatives simulation were presented to the representative farm participants, discussed, and used to help educate the participants about the inherent risk associated with farming and ranching. From the perspective of an established agricultural producer many of the alternatives analyzed were not unique. However, the ability to assess risk in a computer-simulated environment from a whole farm perspective is an added benefit for these beginning farmers and ranchers. In multiple instances, this research exercise prompted discussions among participants and the local facilitator creating an educational opportunity to explore real-world applications and economic impacts of diversified practices.
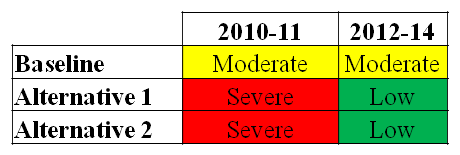
The cow/calf producers were the most conservative of the four groups. The two alternatives they chose to analyze, purchasing calves to background, and increase their cow herd with purchased cows and management intensive grazing, resulted in increased cash flow pressure initially but ultimately resulted in lowering that same risk longer term. Figure 2 shows how the cash risk rating changes over time for the baseline and two alternatives. The cash risk rating is how likely a farm is to have a cash flow deficit in a particular time period. A low rating means the farm has less than a 25% chance of cash flow deficit, moderate is between 25% and 50%, high is between 50% and 75%, and severe is more than 75%. The baseline farm was in that moderate category over the five year projection period (2010-2014). However, the two alternatives both increased the likelihood of having a cash flow deficit in the early projection period (2010-11), but a lower likelihood (less than 25%) in the later years (2012-14).
In contrast to the cow/calf representative farm, the three representative farms that received the majority of their income from their crop enterprises were more aggressive in the alternatives they wanted to analyze. These three groups chose to look at adding acres to their operation through leasing more cash rented land, in many cases at a higher per acre rental rate, purchasing additional acres, adding grain bins, purchasing more equipment, or adding more cattle to their small cattle enterprises. In many cases, these groups chose to look at several of these options together. This aggressiveness resulted in most cases with increasing the likelihood of the farm have cash flow deficits. Many of these producers have experienced higher than average yields and higher prices over the last several years. This higher income level in recent years may have influenced the producers in setting what alternatives they wished to analyze.
From a qualitative perspective, comparative observations of beginning representative farm and ranch participants to existing national and Missouri representative farm participants indicates an increased willingness to utilize technology and discuss their individual operations with a group of their peers. A higher percentage of these beginning farm and ranch participants have received postsecondary education, and many are involved with a larger family operation in addition to their own enterprise.
Preliminary results for 270 surveys completed indicate 54% of respondents consider themselves full-time farmers/ranchers with 39% indicating part-time, 3% planning to start within 24 months and 5% currently not actively engaged in farming/ranching or planning to start within 24 months. In addition, 90% of respondents were 34 years of age or younger and 65% were male.
Surveys were completed by respondents from 42 states in the United States with grains, oilseeds, cattle and hay listed by over 50% of the respondents as a primary enterprise. 87% of the respondents indicated they farmed in conjunction with someone else—either a spouse, other family member or partner.
With respect to computer usage, 259 out of 270 respondents chose to answer this question. Of those 259, 100% of the respondents indicated they used a computer, 97% owned the computer they used, and 93% used a PC with 7% indicating use of a Mac. Over 80% of the 270 respondents indicated they use the internet, email, and have Microsoft Excel. A little over 50% of the respondents indicated utilization of a specific computer software package for farm or ranch budgeting/reporting. 6% of the respondents indicate dial-up internet access with the remainder indicating access to high-speed internet. Surveys will continue to be collected throughout Summer 2011 with final results analyzed in early September. These results will support the final web-based format and delivery mechanism incorporated into the FAPRI-MU Beginning Farmer and Rancher website.
Input from representative farm participants and advisory council members has been extremely positive regarding the real-world application of a representative farm approach to risk management for beginning farmers and ranchers. The combined utility of existing historical data for a farm or ranch enterprise, the FAPRI-MU ten year baseline to provide potential price, yield and input costs from 500 possible outcomes, and applicable financial statements and risk assessment scoring provide a tool for beginning producers. This tool allows single and multi-year decisions to be analyzed and discussed with farming partners, lenders and peers prior to actual changes in farm structure or production practices occurring.
Through the adaptation and enhancement of existing research methodology and decision support and risk management tools, beginning and potential farmers and ranchers throughout the U.S. are provided with timely and applicable information to further their enterprise while reducing or managing risk.
Food and Agricultural Policy Research Institute. (2010). FAPRI U.S. Baseline Briefing Book (#01-10). Columbia, MO.
Mishra, A.K., Morehart, M.J., El-Osta, H.S., Johnson, J.D., and Hopkins, J.W. (2002, September). Income, Wealth, and Well-Being of Farm Operator Households. Agricultural Economics Report 812. Washington, DC: U.S. Department of Agriculture, Economic Research Service.
Richardson, J.W., and Nixon, C.J. (1986). Description of FLIPSIM V: A General Firm Level Policy Simulation Model. Texas Agricultural Experiment Station, Bulletin B-1528. College Station, TX: Texas A&M University.
United States Department of Agriculture Census. (2002). 2002 Census of Agriculture. Available online http://www.agcensus.usda.gov/publications/2002/index.html.
United States Department of Agriculture Census. (2007). 2007 Census of Agriculture. Available online http://www.agcensus.usda.gov/publications/2007/index.html.

