4th Quarter, 2014
The United States is unique in the world insofar as private individuals own a majority of subsurface minerals. While federal and state governments also own minerals, the market for mineral prospects includes many sellers and buyers. Many mineral owners are willing to lease acreage for exploration and experimentation with new extraction technologies (Hefner, 2014). Those individuals capture a share of the proceeds if and when production occurs. Local residents own minerals and stand to gain from production, but the extent to which they do so is not well known. Understanding the legal framework of minerals rights and royalty interests is critical to better understand the magnitude of economic gains from oil and gas royalties.
Recent years have brought a dramatic technological change to the U.S. oil and gas sector, described as the “natural gas revolution,” or the “shale gale” to reflect the presence of both natural gas and petroleum in widespread shale deposits (Yergin, 2011; and Deutch, 2011). Technological changes in extraction techniques have made extraction of unconventional resources economic, vastly increasing potentially productive acreage. That change, in turn, has pushed exploration and production into numerous regions that had not seen oil and gas production in recent past and, in other regions, never. Places with marginal resources using conventional technology became very profitable with new technology. As a result, regions such as rural Pennsylvania, much of which overlies the Marcellus shale, have become hotbeds of oil and gas activity.
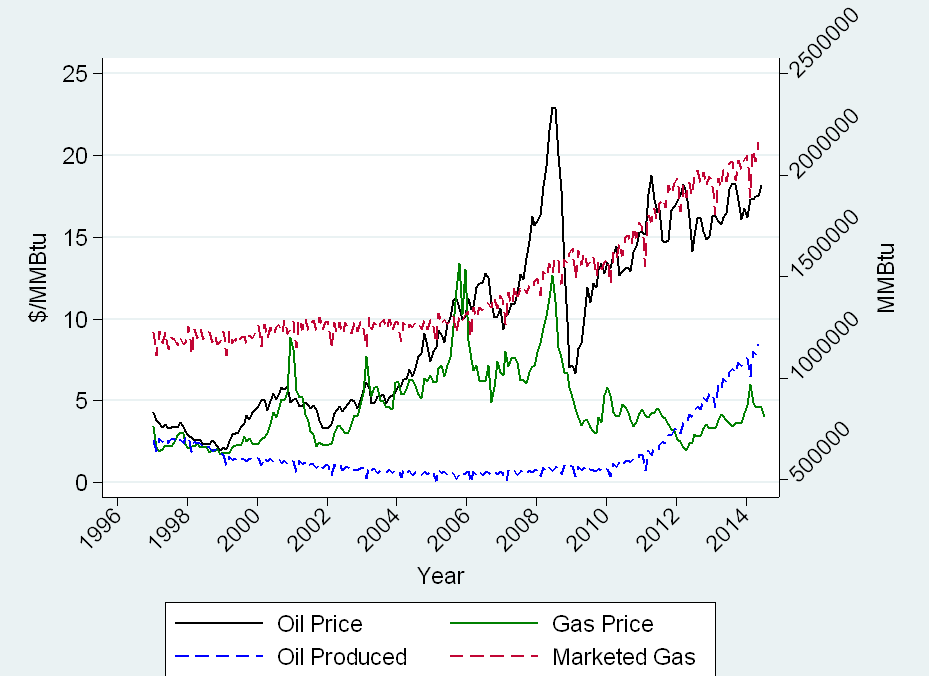
Source: EIA. Oil converted to Btu at
5.83 MMBtu/bbl.
The value of the change in U.S. production due to this technological change is impressive. Figure 1 shows U.S. oil and natural gas production and benchmark prices since 1997. Between 2008 and 2013, onshore oil production in the lower 48 states increased by 81%; natural gas production increased by 30% over the same time span, but began to increase before 2008. How much of the value of this change accrues to local residents, and the spatial pattern of royalty capture, are important questions asked by policymakers.
Royalties accruing locally might well have different effects than revenue that accumulates to oil and gas companies, which are often based out of state. Gilje (2012) investigates the consequence of local capture of oil and gas royalties, finding increased deposits in local branch banks lead to an increased number of business establishments dependent on external credit. Counties with more oil and gas production experienced an additional 8.2% in deposit growth during the period 2000-09. A major source of these additional deposits is proceeds from oil and gas royalties and lease bonus payments. The size of royalties themselves is not well known. The value of production varies across counties, and that value is likely to be captured differently. Understanding such variation is useful in making more accurate forecasts of local economic performance.
Predicting support for development and attendant policy issues is a second key implication of understanding dispersal of mineral rents. Widespread ownership and realization of royalties shape a different political landscape than concentration and absenteeism do. Policy issues such as natural gas and crude oil exports, construction of the Keystone XL pipeline from Canada to the Gulf Coast, and regulation of hydraulic fracturing are likely to vary according to the degree to which residents benefit from oil and gas activity. State and local policy issues also arise, such as the collection of tax revenue from out-of-state mineral owners. Tracing ownership and mineral rent distribution is a more direct link to individual economic welfare than previous studies of employment effects (Weber, 2012; and Jacobsen and Parker, 2014).
As testament to the potential wide scope of benefits to royalty owners from oil and gas production, independent oil and gas producer Chesapeake Energy claims 1 million mineral owners have signed leases with their company, or nearly 1 in 300 Americans (Zuckerman, 2013). Those million leases could be concentrated in the hands of far fewer than 1 million mineral owners, however, and the owners may or may not live atop their minerals. So understanding the specific structure of leasing and mineral ownership is elemental to the economic effects of oil and gas development. Kinnaman (2011) cited the failure to consider location where royalties are received and spent as a major shortcoming of studies that forecast the economic impact of natural gas development.
Many different entities own mineral rights in the United States: private individuals and firms, federal and state governments, and in federal trust for tribally owned minerals. The provenance of mineral ownership for these different groups varies and is often directly related to the history of property claims in a particular location. Prior to 1908, the federal government conveyed rights to all minerals through homestead claims, with very little acreage ineligible for claim. After that time, and especially after 1916, mineral rights were never conveyed to private owners and, instead, reserved by the federal government. States and tribes received minerals from federal land grants. As a comparison, in most other countries the government retains ownership of all subsurface minerals. The diffuse ownership in the United States gives many owners an opportunity to benefit from resource wealth.
Property rights are sometimes likened to a bundle of sticks. In that framework, mineral rights are not one stick, but a sub-bundle, because rights to distinct minerals can be held separately. For example, coal and petroleum rights can be separately owned. Mineral rights can also be separated from surface rights. Severance of minerals from surface, commonly called split estate, is a typical arrangement—surprisingly so to some people. The U.S. government reports 57.2 million acres of federal minerals that underlie private surface, though these holdings are concentrated in states in which many land claims were made after 1908. Forty percent of the federal split estate is in Montana and Wyoming; adding Colorado, New Mexico, and North Dakota increases the proportion to nearly three-quarters.
Split estates are related to dissatisfaction with development (Collins and Nkansah, In Press), and one reason for that dissatisfaction is the inability of a surface owner to share in the value of the extracted minerals. This begs an important question—why would it ever make sense to split up the sticks in the bundle? The ability of mineral owners to sever mineral rights from the surface, or rights to one mineral from others, hinges on the degree to which one owner can benefit from both surface and minerals (Huffman, 1982). Specialization provides an important rationale for severance (Barzel, 1997); because agriculture and oil and gas production require different combinations of inputs, it is natural to expect that separate ownership of the surface and mineral rights would generate larger gains than requiring a single owner. The same argument applies to separation of the rights to different minerals. However, the gains from specialization come at the expense of increased transaction costs (Chouinard and Steinhoff, 2008); in the case of federal oil and gas leases, bidders appear to anticipate those higher costs (Fitzgerald, 2010).
A key issue surrounding mineral rights is that ownership of a single acre is often divided among more than one individual. Fractionalization of mineral rights is common and often begins when mineral property is conveyed between generations. An example is a mineral owner bequeathing equal shares to multiple children. By default, mineral rights are conveyed as tenants-in-common rather than as owners of separate acreage, implying each of four children owns a quarter of the whole acreage, rather than all of one quarter of the acreage. This fractionalization compounds with generations and fecundity.
In a vast majority of cases, an oil and gas company interested in exploring for and producing oil or gas does so by leasing rather than buying the acreage. Oil and gas leases are option contracts with several important dimensions. The option has a primary duration and, if that duration elapses before production occurs, the lease expires. A common example is a three-year primary term. Usually the mineral owner is interested in minimizing the delay until production begins.
Monetary compensation from private leases comes in two parts—a royalty share of gross production revenues and an upfront payment called a bonus. If a lease ultimately produces, the royalty revenue usually far surpasses the bonus payment. However, the risk of no production may make bonus preferable to royalty.
In addition to these two payments, the lease language can be negotiated on an individual basis. While almost all leases share a common structure, contractual protections in the form of lease stipulations may be important to some owners. An important example of such a stipulation is a surface use clause. Such clauses legally restrict the extent to which a developer can occupy the surface. Owners of severed minerals likely have less incentive to include surface use clauses, but may be keenly interested in other types of clauses, such as "Pugh" or delay royalty clauses. Oil and gas leases can be customized to the wishes of the mineral owner.
Private oil and gas leases are negotiated between mineral owners and procurement specialists called landmen. Landmen may work for oil and gas companies interested in producing the minerals themselves, or may work as independent contractors who procure leases and bundle them for sale to developers. Regardless of the type of landman with whom the mineral owner negotiates, there are two reasons to expect that an asymmetry of information prevails between the lessor and the lessee. First, because oil and gas leases can have a long duration, negotiation of a lease may be infrequent for any given mineral owner. In contrast, landmen acquire leases regularly and, during busy periods of leasing, one landman may be working on multiple leases simultaneously. This gives the landman an informational edge with respect to the structure of leases as well as current conditions in the leasing market. Second, the technical demands of modern oil and gas production increase the information required to assess the value of mineral acreage. Company landmen are instructed to procure acreage in specific areas, and many independent landmen have technical training that allows assessment of the resource before negotiating. Most mineral owners lack comparable experience, and may be forced to rely on information provided by the landman in the course of negotiation.
After a lease is signed, a delay of months may elapse before additional activity occurs. Leases may be assigned to new owners, who then have to determine where and when to drill wells, obtain necessary permits, and arrive at a prospective well site. The amount of time spent drilling varies depending on the depth and complexity of a well. After the well is drilled, it must be completed, including treatments such as hydraulic fracturing that affect the reservoir characteristics and likely production from the well. Only after completion is the well ready to begin producing commercially and sale of products can begin. Most leased mineral owners eagerly anticipate the first sales because of the expectation of accruing royalties.
Because most mineral owners do not develop minerals on their own, one of the most important events in the life of an oil and gas owner is when he or she becomes a royalty owner. After a paying well is brought in on the lease, a division order is signed by the mineral owner to specify the terms on which royalties will be paid. Signing the division order makes the mineral owner a royalty owner.
The first check usually pays six months of royalties, and so is often a large sum. In most cases the royalty owner will subsequently receive monthly checks. Royalties are almost always calculated on gross revenue, so they can fluctuate with production and prices. Because of the geophysics of extraction, production usually falls over time from each well. More wells may be drilled on a property, and that can increase royalty payments. Price risk remains an issue for royalty owners, who may not have access to the full range of hedging strategies due to scale.
Royalty ownership comes with its own special set of problems. One important reality for royalty owners is that the operator has much better information about produced quantities, price received for products sold, and the costs of moving products to the point of sale. A second important reality is that the operator of the well is usually able to deduct reasonable expenses incurred in transporting and processing the produced quantities from the wellhead (where royalties are theoretically due) to the point of sale (where a price can be attached to the units that are sold). These post–production costs, or deductions and allowances, are a regular item on a royalty owner’s check stub and often amount to 10% or more of the gross royalty. Here, again, the royalty owner is often at an informational disadvantage. The operator likely considers the benefit of alternative gas-processing contracts, whereas the royalty owner may have limited knowledge of why gas processing is needed.
Royalty owners commonly have disputes with operators. These disputes are often settled amicably, but sometimes result in legal action that receives a judgment. Questions about adherence to lease stipulations, measurement and timing of production, lease expiration, or accounting for post-production costs all crop up periodically. Considerable precedent reduces uncertainty about the outcome of any given dispute, helping to lower costs of resolution.
Understanding the disposition of mineral rights and how leases lead to royalties leaves an important question about who are mineral owners. Are local residents the owners of their own minerals, or do absentee ownership and split estate direct most of the rents of mineral development into the pockets of others?
| Coverage | Owner | Owner | ||||
| Counties | Leases | In-state | In-county | Federal | State | |
| State | (Count) | (Percent) | (Percent) | |||
| Colorado | 25 | 42,336 | 61.17 | 34.52 | 17.1 | 1.7 |
| Louisiana | 54 | 100,723 | 81.7 | 51.16 | 1.3 | 23.2 |
| Montana | 8 | 16,919 | 47.73 | 25.16 | 15.1 | 6 |
| New Mexico | 3 | 20,177 | 36.51 | 18.96 | 51.1 | 19.4 |
| North Dakota | 13 | 88,557 | 36.4 | 15.13 | 11.7 | 23.5 |
| Ohio | 32 | 31,175 | 95.85 | 74.03 | N/A | N/A |
| Oklahoma | 60 | 460,952 | 60.28 | 24.58 | 0.7 | 19 |
| Pennsylvania | 26 | 50,094 | 90.32 | 65.66 | N/A | N/A |
| Texas | 190 | 618,905 | 80.92 | 28.23 | 0.2 | 6.2 |
| Utah | 1 | 1,574 | 64.1 | 12.39 | 48.8 | 1.5 |
| West Virginia | 16 | 34,258 | 65.32 | 41.85 | N/A | N/A |
| Wyoming | 10 | 6,733 | 41.35 | 29.35 | 63.2 | 6.8 |
| Total | 447 | 1,472,403 | 74 .96 | 36.46 | 11.7 | 12.1 |
To gain some insight into mineral ownership, Table 1 summarizes a substantial collection of mineral leases complied by DrillingInfo from 12 of 32 producing states. These states include 8 of the top 10 producing states in 2012, and all are in the top 20. Within states, the leases were summarized at the county level to account for geographic variation in leasing terms and underlying geology. The first columns report the number of counties represented in the sample and aggregate number of distinct leases in those counties.
There are considerable differences in mineral ownership across the states. The data allow matching of the reported address of the grantor with the lease location. When the grantor reports an address in the same state as the lease, the lease is recorded as being owned in-state. When the grantor reports an address in the same county as the leased property, the final column records whether the minerals are owned within county.
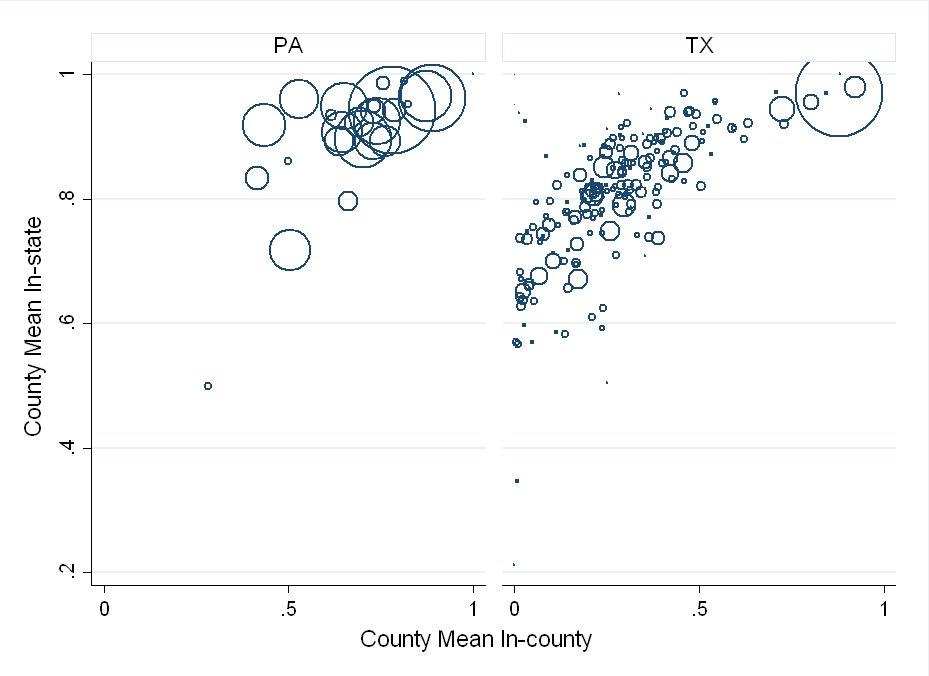
The contrast across states is depicted in Figure 2, which compares mineral ownership in counties in Texas and Pennsylvania. A large majority of the counties in Pennsylvania for which there are data indicate that most of the minerals are controlled by Pennsylvania residents. In fact, a large majority of counties also have local ownership of minerals, as measured by counties. In contrast, absentee ownership is more common in Texas counties. Like Pennsylvania, some counties are characterized by a very high proportion of local ownership. Greater variation across counties within Texas is evident, with several counties reporting no in-county mineral ownership for the sample of leases examined here. However, for almost all of the reported counties in Texas, the minerals are controlled within the state. This is an important distinction between Texas and other states.
Source: DrillingInfo. Elaboration by the
author.
| County | Percent In-County | Percent In-State | Number of Leases |
| Billings | 2.1 | 36.28 | 4,859 |
| Burke | 11 | 35.47 | 7,262 |
| Divide | 7.35 | 28.54 | 6,745 |
| Dunn | 11.31 | 41.85 | 9,030 |
| Eddy | 0 | 0 | 2 |
| Mckenzie | 12.06 | 32.74 | 18,102 |
| McLean | 11.84 | 39.89 | 752 |
| Mercer | 17.68 | 43.96 | 803 |
| Mountrail | 16.82 | 38.28 | 10,245 |
| Renville | 13.16 | 43.14 | 2,735 |
| Stark | 30.3 | 43.38 | 5,756 |
| Ward | 33.03 | 47.38 | 1547 |
| Williams | 30.09 | 42.33 | 20,719 |
Mineral ownership is not uniform within states. Variation within one state, North Dakota, is reported in Table 2. Across the 12 counties for which there are reliable data, in-state ownership ranges from a high of nearly one-half to less than one-third. The in-county numbers are lower, ranging from one-third to only 2% in Billings County. North Dakota has a high degree of absentee ownership compared to eastern states.
Table 1 also reports the percent of mineral production revenue attributable to federal- and state-owned minerals in selected states (Fitzgerald and Rucker, 2014). A weighted average of the states with data on government mineral ownership, using 2012 production of oil and gas as weights, is included in the total. This suggests that 76.2% of producing oil and gas minerals in the onshore lower 48 are privately owned.
Royalties are calculated based on gross revenues. Aggregate quantities produced are widely available. The extent of price dispersion and variability in royalty rates makes estimation of gross royalties more difficult. As a starting point, one large mineral owner secures a uniform royalty rate—the federal government for onshore production. The federal government reported oil and gas royalties of $2.7 billion for fiscal year 2013. Royalties represented 92% of total revenues from onshore oil and gas for 2013, with the balance made up by bonus and rental payments. This underscores the importance of royalties relative to other forms of compensation.
The federal royalty figure also provides a guideline for the aggregate value of royalties. Suppose all other mineral owners captured the same share of production as the federal government. In that case, the aggregate royalties in fiscal year 2013 would be about $23 billion.
State governments own and lease substantial mineral acreage. Because different states have retained differing amounts of land, the importance of state ownership varies across the states. In general, western states have retained more land in state ownership and are more likely to have active leasing programs. Exceptions exist, however. For example, Michigan is a relatively modest producing state, but almost one-quarter of gross revenues are generated on state minerals.
| Oil & Gas | Mean | |||
| Counties | Counties | Royalty | Term | |
| State | (Count) | (Count) | (Percent) | (Months) |
| Arkansas | 38 | 27 | 15.69 | 53.42 |
| California | 3 | 31 | 17.46 | 45.52 |
| Colorado | 25 | 38 | 14.91 | 53.00 |
| Kansas | 38 | 91 | 13.5 | 38.00 |
| Louisiana | 54 | 63 | 21.26 | 38.55 |
| Mississippi | 42 | 43 | 18.4 | 47.02 |
| Montana | 8 | 34 | 15.4 | 52.69 |
| New Mexico | 3 | 13 | 20.8 | 38.49 |
| North Dakota | 13 | 18 | 17.74 | 46.07 |
| Ohio | 32 | 61 | 12.63 | 47.62 |
| Oklahoma | 60 | 74 | 18.59 | 35.88 |
| Pennsylvania | 26 | 36 | 13.98 | 58.24 |
| Texas | 190 | 228 | 19.6 | 37.46 |
| Utah | 1 | 11 | 16.57 | 56.68 |
| West Virginia | 16 | 50 | 13.56 | 59.96 |
| Wyoming | 19 | 22 | 15.33 | 52.33 |
| Total | 559 | 840 | 17.65 | 42.89 |
Unlike federal minerals, a summary of royalty payments from private oil and gas production is harder to come by. Because private minerals account for about 75% of onshore U.S. production in recent years, we could estimate gross royalties as three-quarters of the usual royalty rate times gross revenue. At least four factors contribute to the variation in private royalty payments. First, there is considerable dispersion in private royalty rates, in contrast to federal or even state-owned minerals. Second, royalty rates vary across regions and over time. Third, royalty owners never actually see the gross royalty, but instead receive a net royalty after transportation and marketing allowances are deducted. Fourth, product prices vary around the country, largely in keeping with transportation and quality basis differentials.
Table 3 presents information about private oil and gas lease terms. Dispersion in royalty rates is prominent both within and between states. Lease terms vary from just over three years in several active states to closer to five years in Utah and West Virginia.
As an illustration of state variation in the value and capture of oil and gas royalties, Table 4 reports calculations for several states using 2012 calendar year production figures. (The gross production revenue values natural gas as dry gas and does not take natural gas liquids into account.) The reported states have precise estimates of the amount of production from federal minerals. Valuing the federal production share at the federal royalty rate of 12.5% gives an estimate of gross royalties due. The estimate of $3.16 billion is higher than the reported net royalty receipts, although the calendar and fiscal years do not match up precisely. One possible inference is that this approximation is too high. A second is that transportation and marketing allowances amount to about 14.5% of gross royalty value for the federal government. There are no previous estimates of the magnitude of post-production costs, but this figure is within the range of anecdotal deductions on private minerals. This estimate is subject to some unobserved variation in when royalties are paid for production in the federal reports, but the gross value estimate presumes royalties are paid concurrent with production.
Using state-specific average royalty rates to generate predictions of gross royalty due to private mineral owners in 2012, we see that Texas is far and away the most important state for generating royalties. In part this is because it is the largest producing state, but also because it has a high proportion of private minerals and relatively high royalty rates. The aggregate 2012 value of private royalties for the major states considered in Table 4 was about $31 billion.
| State | Gross Value | Federal Value | Gross Royalty | In-State Value |
| Colorado | 9,346 | 199.8 | 1,131.5 | 692.1 |
| Louisiana | 14,785 | 24 | 2,373.2 | 1,938.90 |
| Montana | 2,678 | 50.5 | 325.4 | 155.3 |
| New Mexico | 11,366 | 726 | 697.4 | 254.6 |
| North Dakota | 23,313 | 340.9 | 2,680.0 | 975.5 |
| Oklahoma | 14,321 | 12.5 | 2,137.8 | 1,288.70 |
| Texas | 88,835 | 22.2 | 16,297.3 | 13,187.80 |
| Utah | 4,198 | 256.1 | 345.7 | 221.6 |
| Wyoming | 11,012 | 869.9 | 506.4 | 209.4 |
| Total | 224,860 | 3,160.3 | 31,359.3 | |
The final column of Table 4 provides an estimate of the share of private royalties that are captured by in-state mineral owners. Of course, mineral owners in a state such as Texas may also be receiving royalties from production in other states, and so this estimate is clearly an underestimate of total royalty income. However, due to substantial out-of-state mineral ownership, a state such as North Dakota sees a large chunk of royalty income disappear across state lines. Local figures are even lower.
The effects identified here are fundamentally short term. The long-run financial implications are not well understood. Given the nontrivial revenues accruing to public mineral owners, the long-term fiscal position of state and local governments depends on the ability to use current revenues wisely. For example, many states devote severance tax revenue to a trust fund. Other states, such as Montana, instead dedicate revenues to operational budgets. Disposition of private oil and gas windfalls is subject to a similar tradeoff between investment in long-term productivity and current consumption.
Over the long term, the usage of oil and gas royalty income is a critical question. The reallocation of rents across alternative types of capital is a key question. Most states receiving mineral royalties use the proceeds at least in part to fund education, which is a reallocation from natural to human capital. Rural residents in North Dakota and eastern Montana have experienced decades of population declines. A current population influx has increased the demand for social services, but with the longevity of the Bakken play still in question, infrastructure investments are as difficult for local governments as decisions about investing in the community are for royalty owners.
Questions that rural residents and landowners have about oil and gas development, broadly, and issues of mineral rights and leasing, in particular, are often difficult to answer. And the existing outreach mechanisms, such as the cooperative extension service, have very limited expertise in this area. Oil and gas attorneys can be very useful to landowners considering leases or other contracts. However, the expansion of development into new provinces has outstripped the supply of unconflicted attorneys with expertise in oil and gas issues. While this shortage is likely to correct itself without intervention, the asymmetries of information discussed above are likely to continue in the interim.
Barzel, Y. 1997. Economic Analysis of Property Rights, 2nd ed. Cambridge University Press.
Chouinard, H., and C. Steinhoff. 2008. “Split Estate Negotiations: The Case of Coal-Bed Methane.” Review of Law and Economics 4:233-258.
Collins, A.R., and K. Nkansah. In Press. “Divided Rights, Expanded Conflict: The Impact of Split Estates in Natural Gas Production.” Land Economics.
Deutch, J. 2011. “The Good News about Gas – The Natural Gas Revolution and Its Consequences.” Foreign Affairs 90:82-93.
Fitzgerald, T. 2010. “Evaluating Split Estates in Oil and Gas Leasing.” Land Economics 86:294-312.
Fitzgerald, T., and R.R. Rucker. 2014. U.S. Private Oil and Natural Gas Royalties: Estimates and Policy Considerations. Agricultural Economics and Economics Staff Paper 2014-1, Montana State University, Bozeman.
Gilje, E. 2012. “Does Local Access to Finance Matter?: Evidence from US Oil and Natural Gas Shale Booms.” Working Paper, Boston College, Mass.
Hefner III, R.A. 2014. “The United States of Gas.” Foreign Affairs 93:9-14.
Huffman, J.L. 1982. “The Allocative Impacts of Mineral Severance: Implications for the Regulation of Surface Mining.” Natural Resources Journal 22:201-237.
Jacobsen, G.D., and D.P. Parker. 2014. “The Economic Aftermath of Resource Booms: Evidence from Boomtowns in the American West.” Economic Journal 124: 18 Oct.
Kinnaman, T.C. 2011. “The Economic Impact of Shale Gas Extraction: A Review of Existing Studies.” Ecological Economics 70:1243-1249.
Weber, J.G. 2012. “The Effects of a Natural Gas Boom on Employment and Income in Colorado, Texas, and Wyoming.” Energy Economics 34:1580-1588.
Yergin, D. 2011. The Quest: Energy, Security, and the Remaking of the Modern World. New York, N.Y: Penguin.
Zuckerman, G. 2013. The Frackers: The Outrageous Inside Story of the New Billionaire Wildcatters. New York, N.Y: Penguin.

