4th Quarter, 2014
Economists have long regarded innovation as key to economic growth and crucial to raising the wellbeing of society. The innovative combination of horizontal drilling and micro seismic technology with hydraulic fracturing, commonly referred to as “fracking,” has impacted the economies of communities across the United States. Hydraulic fracturing has opened up previously uneconomical shale resources for oil and gas extraction. Oil and gas production from shale has been steadily growing. Now, after decades of remaining heavily dependent on foreign energy sources, the United States suddenly and unexpectedly appears to be on the verge of becoming the largest oil and gas producer in the world.
Such sweeping change in the energy market has and will continue to benefit energy users from households to firms throughout the United States. While the benefits of low energy prices are shared across the United States, much of the economic benefits, particularly in employment and earnings, are concentrated on the regions that happen to find themselves located atop sizeable shale resources. These communities, which are often small and rural, are growing at exceptional rates.
Hydraulic fracturing has created new boom towns across the United States, but for towns such as Williston, N.D., this is not their first boom. When the energy boom of the 1970s went bust in the 1980s, many of Williston’s new residents and businesses moved on to opportunities elsewhere. There are concerns about what will happen to these towns when this current boom ends. As with previous booms, volatile energy prices or unsustainable resources may make the boom go bust. It is, therefore, critically important for communities to have an accurate estimate of the recoverable resources available through hydraulic fracturing and the expected economic gains in employment and earnings. Communities can then weigh the benefits against the costs to prepare for what lies ahead. The first regions to see hydraulic fracturing drilling rigs on the ground provide valuable lessons learned about what to expect in the first years of shale development. Because this shale boom is still in its early stages, we will have to take a look further back for any lessons learned in the long run.
Arguably the best way for these communities to gauge the probable economic impact is to look to communities that have already started hydraulic fracturing. In the Northeast region of the United States, Pennsylvania was the first. It is centered over the Marcellus shale play, the largest source of recoverable natural gas in the United States. Pennsylvania provides its neighboring states with an excellent case study on the economic impacts as shale development progresses.
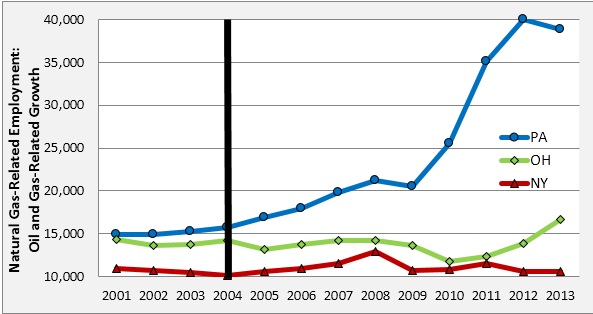
In the first six years of increased activity (from 2004 to 2010), Pennsylvania gained approximately 10,000 oil and gas jobs (Figure 1). However, the impact of drilling reaches beyond that of just the jobs within the oil and gas industry, the direct effect. Shale development also has an indirect effect on industries supplying inputs to them as well as an induced effect from workers spending their earnings, for example, on restaurants, bars, and hotels. All of these additional items are called the multiplier effect. Previous literature generally finds that mining activities have a local multiplier effect of about 2 (or less), meaning that for every oil and gas job created in a locality there will be 1 additional job created in other industries in the area (Kraybill and Dorfman, 1992; and Black, McKinnish, and Sanders, 2005). Thus, using a multiplier effect of 2, Pennsylvania added a total of 20,000 jobs in the first six years of shale development (Weinstein and Partridge, 2011). However, it should be noted that more recent work on the impact of oil and gas employment growth suggests that a multiplier may be closer to 1.7 (Brown, 2014) or 1.3 (Weinstein, 2014). If the multiplier is less than 2, the total impact may be smaller than initial estimates. It also implies that the composition of the workforce is shifting more heavily towards mining industries.
Source: U.S. Bureau of Labor Statistics,
2014a.
Pennsylvania’s neighbors, whom also sit atop the Marcellus and Utica shale plays, should expect oil and gas employment growth similar to Pennsylvania. Just a few years after Pennsylvania began drilling, Ohio followed suit. So far, Ohio’s employment effect seems to be on par with Pennsylvania’s. In three years since 2010, Ohio has gained approximately 5,000 direct oil and gas jobs, implying about 10,000 total jobs were created as a result of drilling activity after accounting for the multiplier effect (Figure 1). New York, on the other hand, instituted a moratorium on fracking in 2008 and recently voted to continue the moratorium until May 2015. Figure 1 depicts the diverging paths of these 3 states as a result of their different experiences with unconventional oil and gas development.
Pennsylvania’s natural gas employment has continued to rise since 2010, adding 13,000 additional oil and gas jobs, bringing the total estimated employment impact of drilling to about 46,000 jobs from 2004 to 2013. The growth in oil and gas employment in just a few short years is impressive, though many, including the oil and gas industry, expected the impact would be significantly larger. Various studies predicted the economic impact would be an order of larger magnitude. One industry-funded report estimated that 140,000 jobs were associated with shale development in Pennsylvania in 2010 (Considine, Watson, and Blumsack, 2011). Another predicted that Ohio could expect closer to 200,000 jobs as opposed to 20,000 (Kleinhenz and Associates, 2011). There are a number of reasons why these studies estimated improbably large effects—from employing unrealistic assumptions in their models to double counting effects—and not accounting for some of the negative effects shale development can have on a community (Weinstein and Partridge, 2011; and Weinstein and Partridge, forthcoming). However, it should not be surprising to find modest employment impacts from shale development. First, the energy industry tends to be rather capital intensive with the output (oil or natural gas) requiring more capital than labor inputs in its production. Second, the energy industry accounts for just a small share of the economy. For example, even after adding approximately 24,000 oil and gas workers in Pennsylvania, the oil and gas industry accounted for just 0.7% of a workforce of about 6 million in 2013. Even with tremendous growth rates, such a small industry would be hard pressed to have much of an impact on a large, state-wide economy.

Source: U.S. Energy Information
Administration, 2014.
Source: U.S. Bureau of Labor Statistics,
2014a.
Pennsylvania is not the only state that has ramped up production of either natural gas or oil from shale by using hydraulic fracturing. Figure 2 shows the dramatic increase in oil and gas production from shale in the United States broken out by the various shale plays scattered across the country.
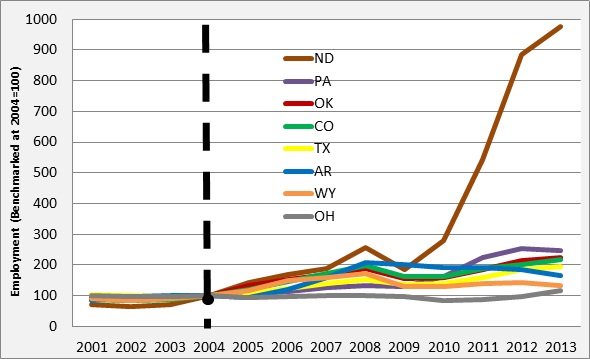
Figure 3 shows the growth of oil and gas employment in the various states most impacted by the recent developments in extraction from shale. For each state, the total number of oil and gas jobs is benchmarked at 100 for the year 2004—approximately when the boom began. The impact of shale development on Pennsylvania and the other states represented in Figure 2, though still notable, is dwarfed in comparison to North Dakota (Figure 3). North Dakota sits atop the Bakken shale play, the second largest source of recoverable oil from shale in the United States. Its oil and gas sector is now at about 24,000 jobs, up from 2,400 in 2004.
North Dakota’s economy is significantly smaller than that in Pennsylvania. Thus, the oil and gas sector will likely have a larger impact on North Dakota than Pennsylvania. However, oil and gas jobs still make up less than 6% of employment and North Dakota’s unemployment rate has dropped only slightly from 3.5% in 2004 to 2.9% in 2013 (Weinstein and Partridge, forthcoming; U.S. Bureau of Labor Statistics, 2014b). Expecting such a small industry to make a significant impact on even a small state economy is a bit unrealistic. The oil and gas industry is more likely to affect smaller economies, especially rural and remote areas, where drilling activity is often concentrated. That is where the large impacts will be.
North Dakota’s drilling activity is most concentrated around Williston in Williams County. The share of oil and gas employment in Williams County was over 39% in 2013, significantly higher than the state’s share of oil and gas employment (U.S. Bureau of Labor Statistics, 2014a). With a larger share of the economy, the oil and gas sector will likely have more of an impact at the county level. The unemployment rate of North Dakota dropped slightly during shale development, but the unemployment rate in Williams County dropped more significantly from 2.7% in 2004 to 0.9% in 2013 (U.S. Bureau of Labor Statistics, 2014b). With unemployment rates this low, Williston-area businesses reported having trouble finding enough people to work in restaurants, hotels, and other establishments even after raising their wages substantially (Johnson, 2012). The average weekly wage in Williams County tripled from 2001 to 2013 (U.S. Bureau of Labor Statistics, 2014a).
Many of these employees, along with oil and gas workers, come from out of state to fill these jobs in order to meet labor demands and the skill requirements of more specialized jobs associated with the oil and gas industry. The influx of workers has provided counties with a level of economic growth that most policymakers envy. However, the magnitude and abrupt nature of the economic growth in these small towns also means that these economic benefits come with growing pains such as strains on local services and the housing market (Oldham, 2012). There are reports of dilapidated roads, overcrowded schools, and workers sleeping in “man camps” made from shipping containers in Williston. Although higher home values are a boon to homeowners, residents who are renters will be negatively impacted by higher housing prices. However, Farren et al. (2013) found that, in Pennsylvania, shale development raised the fair market rent only in those counties experiencing the highest levels of drilling activity. In general, shale development had a somewhat minimal impact on the housing market in Pennsylvania. The contrasting housing market experience of counties in Pennsylvania and North Dakota is due to the fact that Williston is more rural and remote. Drilling counties in Pennsylvania can rely on nearby cities and more populous counties to supply extra housing. More rural and remote counties will likely be less prepared to deal with the strain on local services and the housing market.
County policymakers will need to be prepared for all of the costs and benefits that shale development may bring. Luckily, they can look to the regions that started this new wave of unconventional oil and gas development to better estimate their own expected costs and benefits in the short run. To get a fair and accurate estimate of the employment and earnings impact, we need to find a way to measure the immeasurable. We need to compare what happened in these drilling counties to what would have happened had there been no drilling activity at all, a counterfactual. A counterfactual should be a non-drilling county that is nearly identical to a drilling county in every way except there was no shale development. For example, before Ohio began drilling, it was a good counterfactual to compare with Pennsylvania (Figure 1). Without shale development, Pennsylvania’s oil and gas employment would have remained flat or even decreased similar to Ohio.
To examine the impact on drilling counties in Pennsylvania, Weinstein and Partridge (2011) compared counties with the most intensive drilling activity in the Northeast and Southwest regions of Pennsylvania (Washington, Greene, Fayette, Tioga, Bradford, and Susquehanna) to similar non-drilling counties (Perry, Franklin, Cumberland, Union, Columbia, and Carbon). Figures 4 and 5 show the employment and earnings growth of drilling and non-drilling counties in Pennsylvania (benchmarked at 100 for the year 2004). Drilling and non-drilling counties appear to be on the same growth path before drilling activity begins, which suggest the chosen non-drilling counties are good counterfactuals. After drilling activities began, the growth paths of drilling and non-drilling counties diverged. Drilling counties in Pennsylvania have higher employment and earnings growth from shale development.
|
Figure 4: Pennsylvania County
Employment Comparison 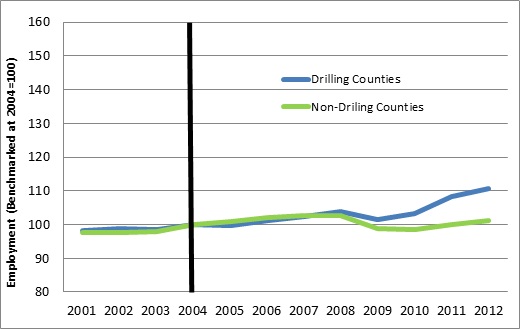
Source: U.S. Bureau of Economic |
Figure 5: Pennsylvania County
Earnings Comparison 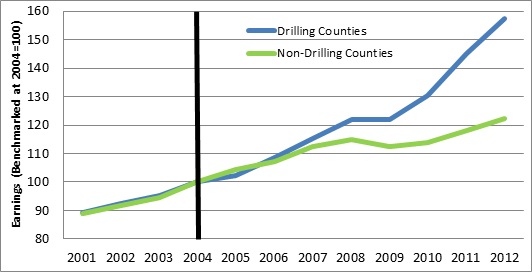
Source: U.S. Bureau of Economic |
To get a more comprehensive look at the impact of shale development, Weinstein (2014) looks at counties across the United States finding that shale development is associated with a 1.3% annual increase in employment and a 2.7% annual increase in earnings. The impact on earnings is likely more significant due to a number of factors including higher wages in the area and income generated from leasing and royalty payments to landowners. Although the examination is short run, Weinstein does find that the economic impact of shale development seems to wane over time. To better predict what the long-run impact on their communities may be, policymakers will have to take a look further back to the fates of previous boom towns.
Source: U.S. Bureau of Economic
Analysis, 2014.
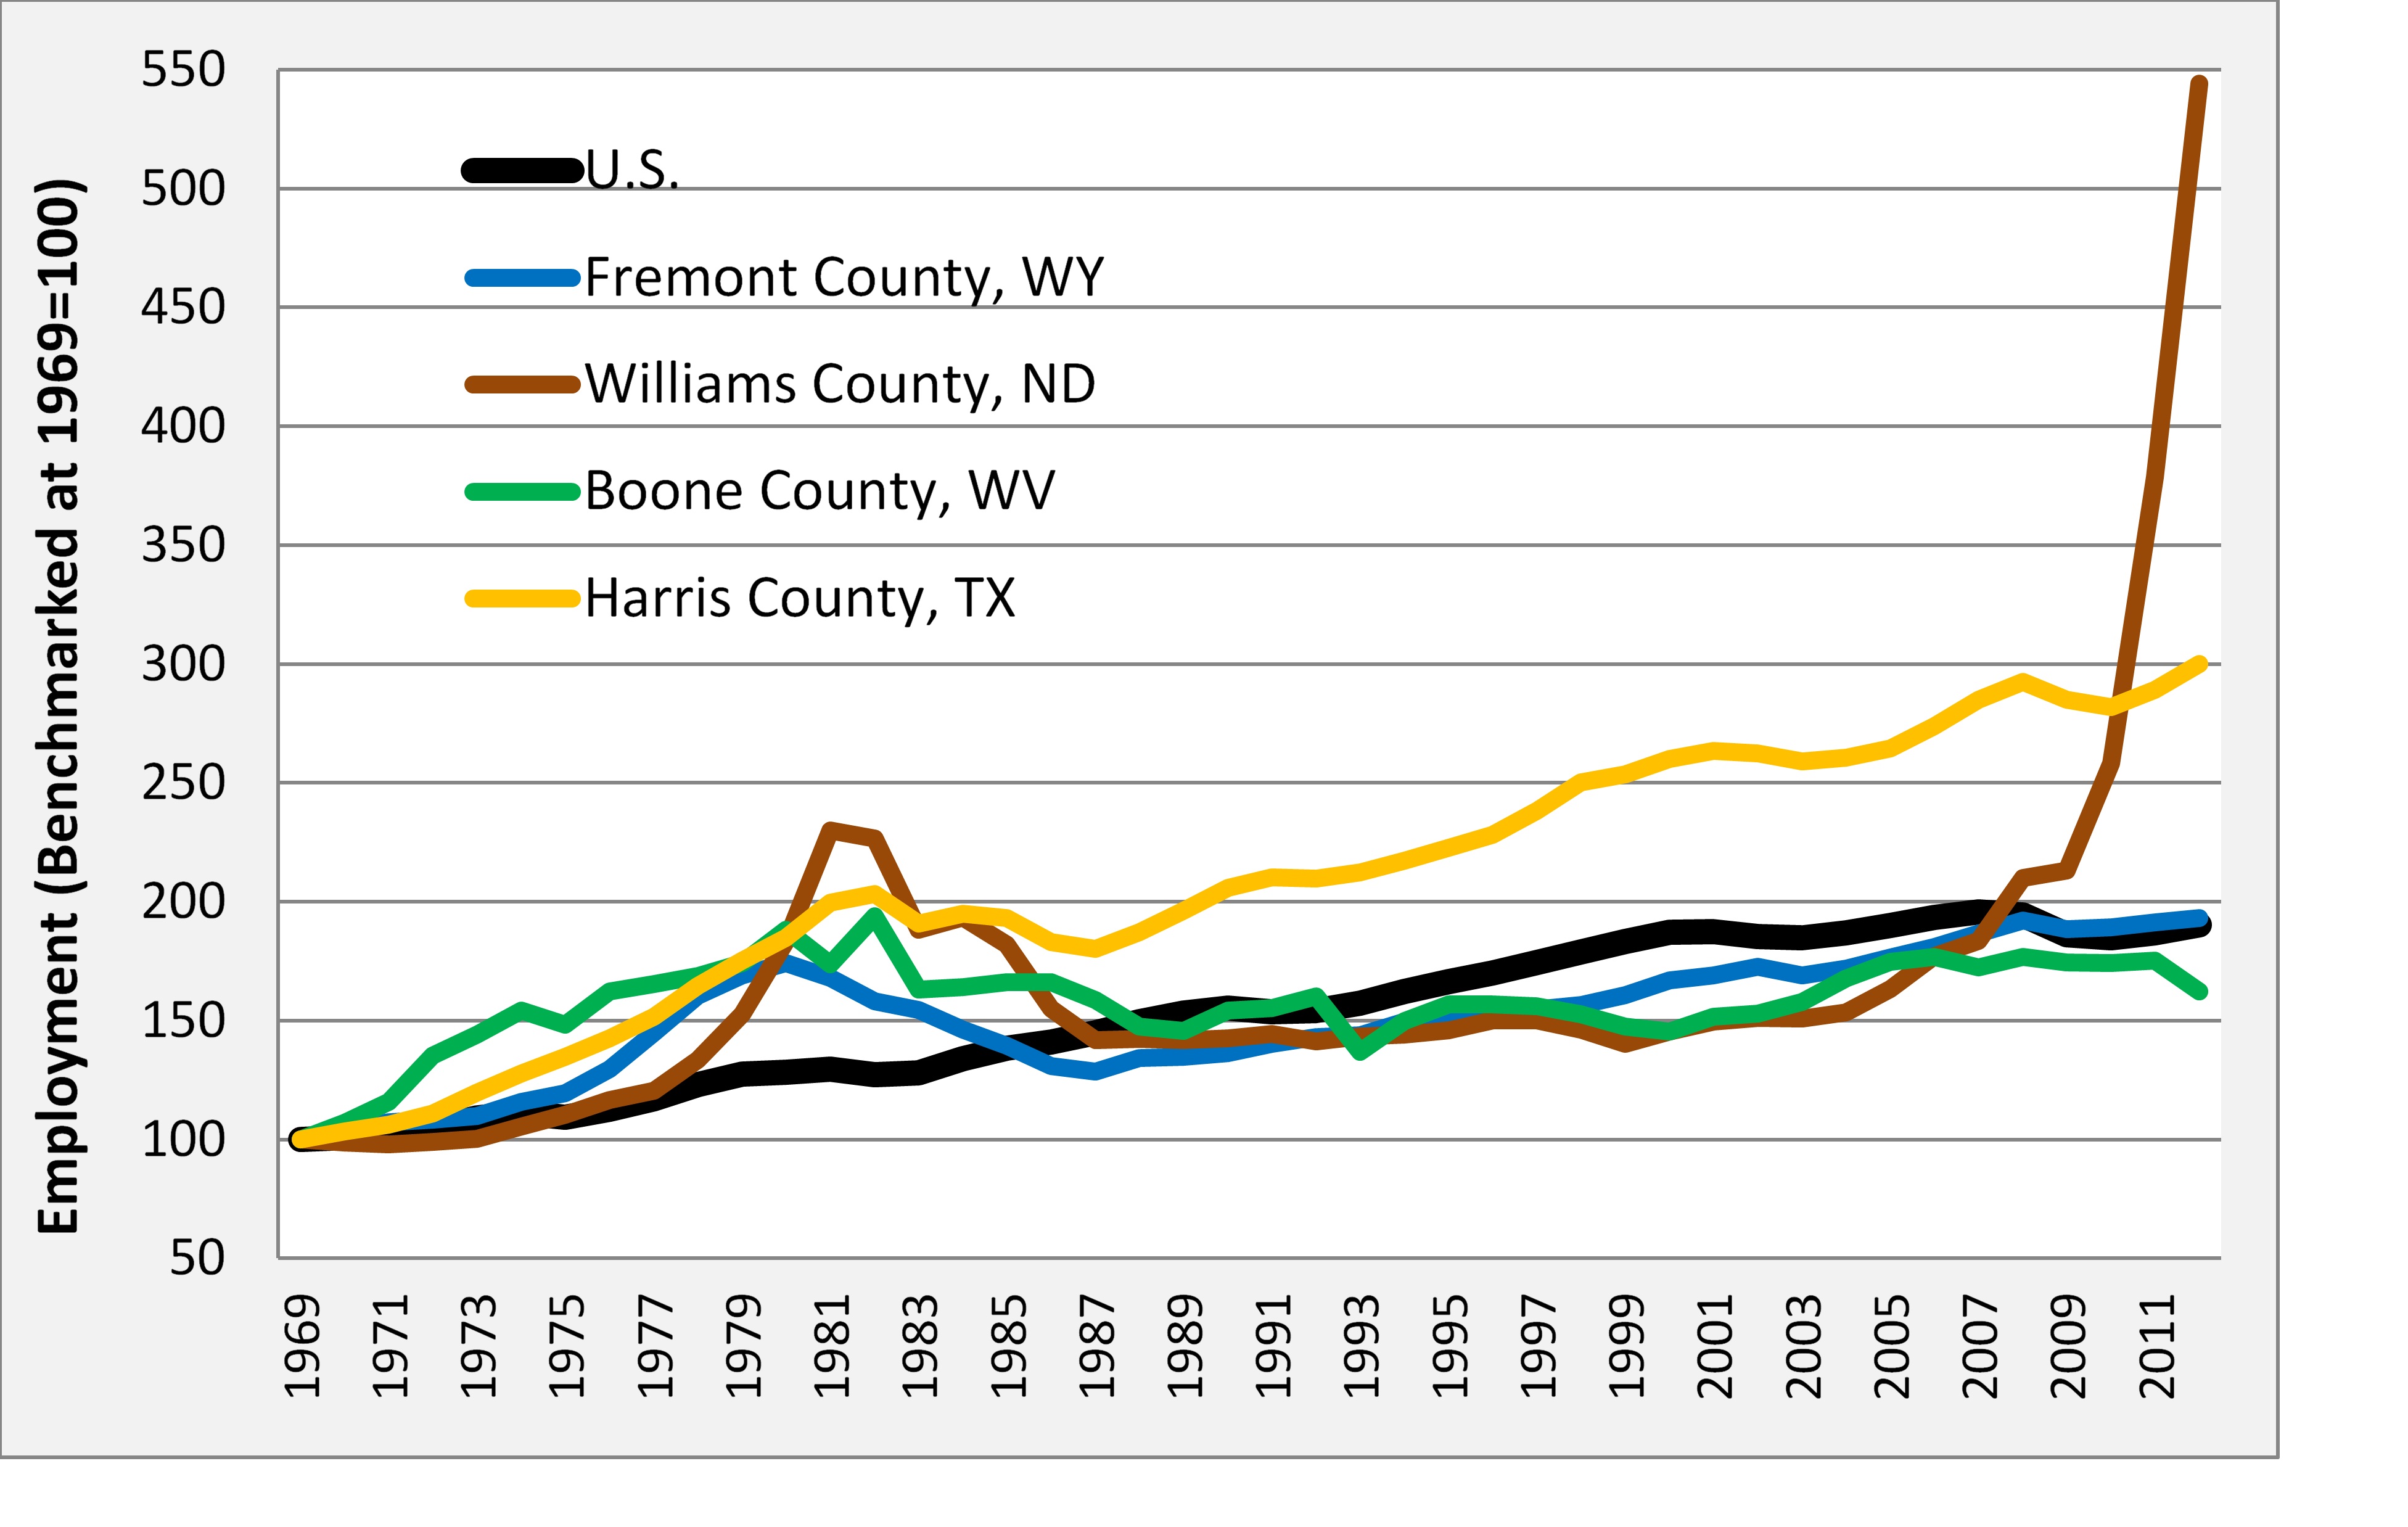
This is not the first energy boom the United States has experienced and will not likely be the last. Figure 6 shows employment growth in the United States from 1969 to 2012. It depicts a few examples of previous booms in various counties across the United States, namely the energy boom of the 1970s.
Some residents of Williston (the county seat of Williams County, N.D.) have been around long enough to have experienced the previous energy boom, and subsequent bust, and are now wary of the current shale boom. The boom of Williston’s past is evident in Figure 6. Williston’s previous boom was among the most prominent during the 1970s with its economic growth far higher than the national average. Figure 6 also shows that Williston’s boom in the 1970s was followed by a bust in the 1980s when energy prices dropped. After the bust, Williston’s employment lagged the United States until the recent shale boom began lifting it back above the U.S. growth path. There are concerns that Williston will once again return to the sluggish employment growth that lags behind the United States but only after another bust hits. If a bust hits as before, there may be little to keep workers in Williston which could turn it into a ghost town.
Williams County is not the only county that received a jolt to its economy during the energy boom of the 1970s. Many of these communities experienced the same type of pattern: a large employment boom far outpacing the United States followed by a bust and fairly consistent sluggish growth thereafter. Jeffrey City in Fremont County, W.Y., has just such a growth path. Jeffrey City developed around the discovery of uranium and became a true company town with Western Energy actually managing the town itself and replacing any form of local government. Most people who moved to Jeffrey City did so to work for Western Energy. As energy prices rose along with expectations of increased nuclear power, the price of uranium rose from $8 to $40 per pound in just three years. As prices boomed so did Jeffrey City; the population rose from 750 in 1970 to almost 4,000 in 1980. Just as Jeffrey City was about to peak, the Three Mile Island accident changed national opinion on nuclear energy. Within just two years, 95% of the workforce left town. The volatility of energy prices and the reliance on one industry left Jeffrey City a ghost town (Amundson, 1995). All busts are not as severe as Jeffrey City, but it shows that the growing pains of the boom are typically minor compared to the strains associated with a bust.
Black, McKinnish, and Sanders (2005) examined how counties in West Virginia, Kentucky, Ohio, and Pennsylvania fared during the coal boom of the 1970s and subsequent bust in the 1980s. In terms of employment effects, they find that the bust had a stronger negative effect than the boom’s positive effect. Less than two jobs were created for every 10 coal jobs created (a multiplier of 1.2) during the boom, but 3.5 jobs were lost for every 10 coal jobs lost during the bust. Additionally, highly skilled workers are more likely to leave in a negative demand shock like an energy bust while low-skilled workers are more likely to stay and become unemployed (Mauro and Spilimbergo, 1999). In these coal regions, local residents became more mobile during the coal bust because of the skills they acquired during (and, in part, because of) the coal boom. This compositional change in the local labor market as a result of a bust can decrease the skill levels in these areas. Counties in this region that are heavily dependent on coal, such as Boone County, W.V., will be especially impacted by such a negative demand shock. Coal mining accounts for over 30% of the workforce in Boone County (U.S. Bureau of Labor Statistics, 2014a) and Boone County’s employment growth has been below the national average since the bust.
These are just a few examples among many of the boom towns that have gone bust in the United States, but does a boom town necessarily have to go bust? Maybe not. Harris County, Texas, which includes Houston, seems to have boomed along with other energy economies in the 1970s, but did not have a severe bust followed by sluggish growth. Its employment growth remained above the United States even after the downturn it experienced. Houston’s experience likely differed because its economy is far more diverse than the other boom towns. The share of mining employment in Harris County is just over 4%, far less than that of Boone County, W.V., or Williams County, N.D. One industry simply can’t bring the entire economy of Houston down. Additionally, the booms that do hit Houston are much more moderate. Dramatic and unprecedented booms like the one Williston, N.D., now finds itself in (Figure 6) may just mean it has farther to fall.
The fate of our economy should not rest in the hands of one industry nor should one industry be expected to have a large impact, especially when that industry holds a rather small share of the economy. It also seems unfair to saddle an industry with such unrealistic goals and short-sighted of communities to ignore the potential long run impact. It should come as no surprise that the true economic impact of shale drilling is smaller than many initial estimates first suggested. Nevertheless, when an industry does hold a large share of the local economy as in Williston, N.D., and other small mining towns, the fate of the economy may rest in the hands of that one industry. In this case, the impact may be large enough to turn a small town into a boom town or a ghost town.
Unconventional oil and gas development has undoubtedly increased the employment and earnings in communities with shale resources. However, sustained, stable economic growth should be the goal of these communities or any community. We look to innovations and innovators to grow our economies and raise the standards of living in society, but these innovations and the resulting economic growth can be accompanied by growing pains, especially if growth happens too quickly. When boom towns arise, we justifiably fear the bust. The volatility of the boom-and-bust cycle can be difficult for a community to overcome. If shale boom communities can find a way to use the economic benefits of the boom to moderate the industry’s impact, they may have less reason to fear a bust. Communities may be able to avoid or lessen the impact of a bust by using their newfound fortunes to prepare for the long run—by diversifying their economies, raising the skill level of their workforce, maintaining or improving their local services, and mitigating any other negative effects associated with drilling.
Amundson, M.A. 1995. “Home on the Range No More: The Boom and Bust of a Wyoming Uranium Mining Town, 1957-1988.” The Western Historical Society 26 (4): 483-505.
Black, D., T. McKinnish, and S. Sanders. 2005. “The Economic Impact of the Coal Boom and Bust.” The Economic Journal 115(503): 449-476.
Brown, J. 2014. “Production of Natural Gas from Shale in Local Economies: A Resource Blessing or Curse?” Economic Review 99(1): 119-147.
Considine, T., R. Watson, and S. Blumsack. 2011. “The Pennsylvania Marcellus Natural Gas Industry: Status, Economic Impacts and Future Potential.” The Marcellus Shale Coalition. Pennsylvania State University. Available online: http://marcelluscoalition.org/wp-content/uploads/2011/07/Final-2011-PA-Marcellus-Economic-Impacts.pdf
Farren, M., A. Weinstein, M. Partridge, and M. Betz. 2013. “Too Many Heads and Not Enough Beds: Will Shale Development Cause a Housing Shortage?” Swank Program in Rural-Urban Policy Summary and Report.
Johnson, R.. 2012. “You've Never Seen Anything Like This North Dakota Oil Boomtown.” Business Insider. Available online: http://www.businessinsider.com/youve-never-seen-anything-like-the-williston-oil-boom-2012-3
Kleinhenz and Associates. 2011. “Ohio‘s Natural Gas and Crude Oil Exploration and Production Industry and the Emerging Utica Gas Formation.” Ohio Oil and Gas Energy Education Program.
Kraybill, D.S., and J. Dorfman. 1992. “A Dynamic Intersectoral Model of Regional Economic Growth.” Journal of Regional Science 32(1): 1-17.
Mauro, P., and A. Spilimbergo. 1999. “How do the Skilled and Unskilled Respond to Regional Shocks: The Case of Spain.” International Monetary Fund Staff Papers 46(1).
Oldham, J. 2012. “North Dakota Oil Boom Brings Blight with Growth as Costs Soar.” Bloomberg.com. Available online: http://www.bloomberg.com/news/2012-01-25/north-dakota-oil-boom-brings-blight-with-growth-as-costs-soar.html
U.S. Bureau of Economic Analysis. 2014. “Local Area Personal Income and Employment.” U.S. Department of Commerce. Available online: http://www.bea.gov/regional/
U.S. Bureau of Labor Statistics. 2014a. “Quarterly Census of Employment and Wages.” U.S. Department of Labor. Available online: http://www.bls.gov/cew/
U.S. Bureau of Labor Statistics. 2014b. “Local Area Unemployment Statistics.” U.S. Department of Labor. Available online: http://www.bls.gov/lau/
U.S. Energy Information Administration. 2014. "Outlook for U.S. Shale Oil and Gas.
U.S. Department of Energy. Available online: http://www.eia.gov/pressroom/presentations/sieminski_01042014.pdf
Weber, J. 2013. “A Decade of Natural Gas Development: The Makings of a Resource Curse?” Resource and Energy Economics 37: 168-183.
Weinstein, A. 2014. “Local Labor Market Restructuring in the Shale Boom.” The Journal of Regional Analysis and Policy 44(1): 71-92.
Weinstein, A., and M. Partridge. forthcoming. Economic Implications of Unconventional Fossil Fuel Production in Our Energy Future. New York, N.Y: Routledge, pp. 19-39.
Weinstein, A., and M. Partridge. 2011. “The Economic Value of Shale Natural Gas in Ohio.” Swank Program in Rural-Urban Policy Summary and Report.

