The “digital divide”—a gap in access to modern information and communication technologies found among different demographic and economic groups, as well as communities and regions across the country—is a recognized problem in the United States and a growing concern in rural America. Not only is access to fast, reliable broadband a necessity in many facets of everyday life, it has become a critical component of farming and agriculture-related activities. The USDA estimates that deployment of broadband connectivity and next generation precision agricultural technologies could result in an annual economic benefit of at least $47 billion (U.S. Department of Agriculture, 2019). Further, several studies have found that broadband availability has an appreciable impact on farm profitability (Kandilov et al., 2017; LoPiccalo, 2022). The 2018 Farm Bill called for the creation of the “Task Force for Reviewing the Connectivity and Technology Needs of Precision Agriculture in the United States” (or “Precision Ag Connectivity Task Force” for short). Its charge is to provide advice and recommendations on how to assess and advance broadband deployment on agricultural land and to promote the use of precision agriculture. The success of such a task force, however, is hindered by the absence of detailed broadband-related data that can guide the formation of policies and strategies that expand broadband access and adoption by farmers, agribusinesses, and other key sectors. FCC chairwoman Jessica Rosenworcel has argued, “You cannot manage what you do not measure” (Tibken, 2021a).
Expanding broadband internet availability requires detailed knowledge of the current status of broadband across the country. However, the U.S. approach to gathering broadband availability data has been widely criticized (Ford, 2011; Grubesic, 2012; Busby and Tanberk, 2020; Ford, 2019). Although data have been collected, they have failed to provide an accurate picture of the country’s broadband needs. This article provides a brief history of the current efforts to collect broadband availability data and the new funding initiatives that are intended to accelerate access to various areas of the country. We highlight ongoing efforts for the creation of a “broadband serviceable location fabric” (BSLF), which is a dataset of all locations or structures where broadband could be provided. Next, we explore and analyze preliminary BSLF data for the state of Oklahoma and, as a result, highlight several important takeaways that should be considered as the availability of BSLF data is expanded nationwide.
During the initial onset of the COVID-19 pandemic, Congress passed the Broadband Deployment Accuracy and Technological Availability (DATA) Act (P.L. 116-130) in March 2020, calling for the development of a national BSLF, which must contain georeferenced information on all locations where fixed broadband can be installed. Prior data collection efforts (i.e., the Federal Communication Commission’s (FCC) Form 477) based broadband availability percentages on the estimated number of people/households located in each census block (i.e., without geolocations). For example, the FCC’s annual Broadband Progress Reports regularly use block-level population estimates to generate county, state, and national metrics on the percentage of all residents with access to different broadband thresholds (FCC, 2016, 2021). However, this approach fails to include entities that might need broadband connections, such as businesses, community institutions, agricultural facilities, and recreational venues. The legislated BSLF is intended to address these deficiencies.
In November 2021, the FCC selected CostQuest Associates (CQA), a broadband consulting firm, to be the initial provider of data for a national BSLF. As the FCC and CostQuest move forward with the creation of a national BSLF, it is important that the data that be used to tackle the shortcomings associated with the current broadband mapping system, particularly identifying specific property types in need of service. This includes ensuring that the broadband needs of the agricultural sectors are duly recognized and addressed.
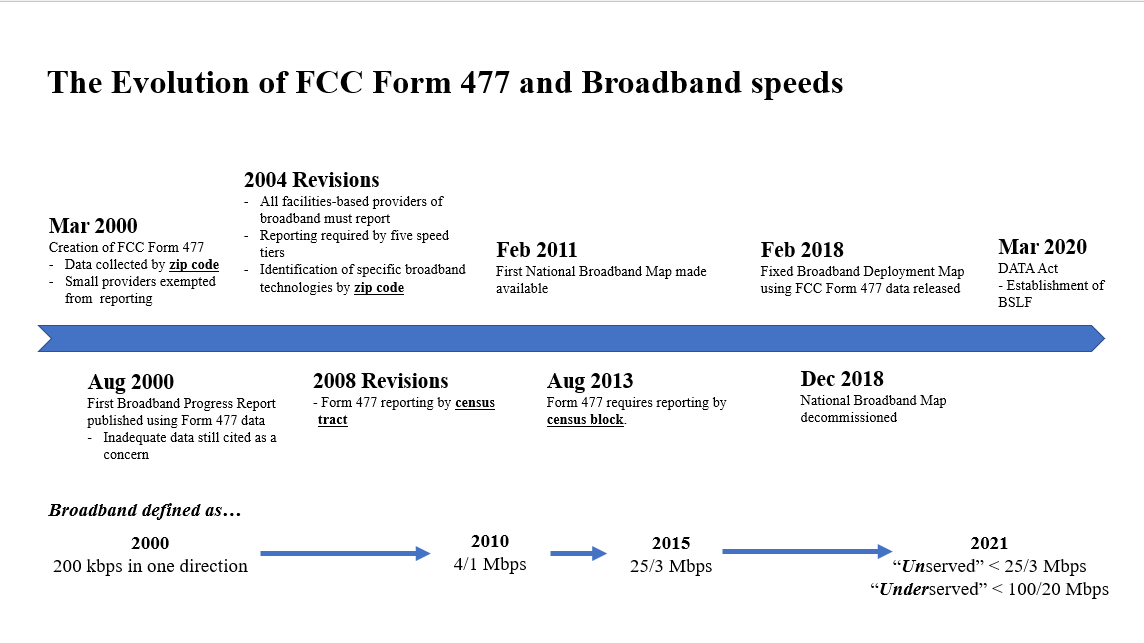
The United States has been gathering broadband data since it was first mandated by the FCC’s Telecommunications Act of 1996. Broadband Progress Reports, now known as Broadband Deployment Reports, have been published annually by the FCC since 1999. In 2000, the FCC established Form 477, a standardized tool for collecting semi-annual data regarding broadband services, local telephone service competition, and mobile phone services (FCC, 2000). In its earliest form, only service providers with more than a threshold number of customer (or service) lines in a state were required to report a list of zip codes where services were provided (FCC, 2000, p. 7). Form 477 reporting requirements have changed a number of times since 2000. Some of the most important changes include the delineation of broadband service by technology types (2004) and the collection of data at the census-tract level rather than by zip code (2008). The reporting of data at the census-block level has been standard practice since 2013. Figure 1 presents a timeline showing changes in how the FCC collected broadband data and how it has defined “broadband.”
A particularly important element in Figure 1 is the 2008 Broadband Data Improvement Act (BDIA), which introduced and formalized the idea of broadband availability mapping and was subsequently funded by the 2009 American Recovery and Reinvestment Act (“Recovery Act”). The act also established the State Broadband Initiative (SBI) to oversee the distribution of funding at the state level and required each state to semi-annually gather broadband availability data at the census block level from providers within their borders (NTIA, 2009a,b). This data was collected, verified, and standardized at the individual state level and then aggregated to produce the first National Broadband Maps from 2011 to 2015. Although these earliest maps were a substantial improvement from having no map at all, they had noticeable limitations. Three of the most glaring issues were (i) reporting at the provider level was incomplete; (ii) the data did not differentiate between residential and business service; and, (iii) a whole census block was considered “served” if one location within its borders could be provided service within 7–10 days (Grubesic, 2012). This last limitation is undoubtedly the most important one for rural locations since some agricultural structures that might need broadband are not always located near households. Further, census blocks in rural areas can be relatively large and thus are more likely to overstate actual availability.
SBI funding ended in 2015 and the FCC took over responsibility for data collection, which was still being gathered at the census block level. The FCC was unable to continue the data verification work previously done at the state level under SBI, which caused additional uncertainty about the reliability of the data. Despite the growing importance of well-informed maps, the FCC did not publish a new availability map until 2018.
Throughout this process, the availability maps have depended on data gathered directly from internet service providers (ISPs). Providers complete Form 477 updates each June and December, and the FCC publishes a national availability map with roughly a 12-month lag (for example, the January 2022 map uses data from December 2020). The map includes broadband and provider availability for over 11 million census blocks. The map contains details including availability by technology type and speed, provider-specific information such as available speed tiers, and the ability to search for a specific area or location by searching for an address. Despite these improvements, the underlying data is still subject to the faulty “one served, all served” logic and continues to overstate broadband availability, particularly in rural areas (Engebretson, 2018). Due to the time lag associated with processing Form 477 data from providers, these maps also do not offer a real-time picture of broadband status.
In light of the significant level of funding being targeted for broadband expansion and the pressing need for accurate broadband availability mapping, it is hoped that the BSLF will produce more granular and accurate data to help inform project investments and policy decisions (GAO, 2021; White, 2021).
Previous federal broadband funding has attempted to address infrastructure development, adoption, and mapping, but COVID has exacerbated the need for more widespread, reliable internet—particularly in rural areas (Whitacre, 2021). Several COVID stimulus packages have included significant broadband components. Two of the largest and most notable are the American Rescue Plan Act of 2021 (“ARPA,” P.L. 117-2) and the Infrastructure Investment and Jobs Act of 2021 (the “Infrastructure Act,” P.L. 117-58).
Passed in March 2021, ARPA provides over $350 billion for state, county, and local pandemic recovery due to COVID. Unlike other grant-based or otherwise restricted funding initiatives, ARPA grants enormous flexibility as to the types of projects and investments that can be supported with these funds (Lide, 2021a). The act strongly encourages, but does not mandate, that monies be spent on broadband infrastructure (Panettieri, 2021). All states are receiving funds, but the act intentionally allows each state, county, and municipality to determine the best uses of the funding. While some have already identified specific broadband-focused projects, only several states have earmarked funds for general broadband infrastructure and development to date (Read and Wert, 2021; Community Networks, n.d.). ARPA funds are required to be expended by December 31, 2024, giving states time to plan.
The Infrastructure Act, passed on November 15, 2021, allocates approximately $65 billion dollars to various aspects of broadband development and adoption (Lide, 2021b; Sullivan, 2021). The largest portion of this funding, $42.45 billion, is dedicated for the Broadband Equity, Access and Deployment (BEAD) Program. BEAD funding is being administered as a grant program by the National Telecommunications and Information Administration (NTIA), but spending power ultimately rests with each state (Engebretson, 2021). Under the act, states are required to consider input from local governments, cooperatives, partnerships, and other eligible entities, in designing a five-year action plan that addresses the intended uses of funding (Keller and Heckman LLP, 2021). Notably, both ARPA and the Infrastructure Act define underserved areas as those lacking access to 100 Mbps download and 20 Mbps upload speeds (i.e., 100/20)—significantly higher than the FCC’s “unserved” definition of 25/3 Mbps set in 2015.
In addition to these federal funding programs, many states have taken matters into their own hands, seeking to create state-level availability maps in advance of the federal BSLF. Georgia, Maine, Pennsylvania, Illinois, Arkansas, and North Carolina are just a handful of the states working to produce their own state availability maps in order to more appropriately apply for and allocate funds (Noble, 2020; Tibken, 2021b). Our home state of Oklahoma has set aside $2 million in ARPA funds to compile a state-level availability map (Savage and Prather, 2021). The state’s Rural Broadband Expansion Council previously purchased a preliminary version of the BSLF to assess how it might be used as part of a broader mapping effort. The next section discusses the details of the fabric and how it could be used to allocate the pending federal broadband funds.
Source: CostQuest Associates Broadband Serviceable
Location Fabric, 2021; FCC Form 477 (Dec. 2020).
Source: CostQuest Associates Broadband Serviceable
Location Fabric, 2021; FCC Form 477 (Dec. 2020).
Since October 2020, CostQuest Associates (CQA) has created three versions of a preliminary BSLF for the state of Oklahoma. The state of Oklahoma licensed this BSLF data from CQA as part of its efforts to create a state broadband availability map. Each dataset contains over 1.5 million entries, or fabric points.2 Each point represents a specific structure—such as a household, business, or farm building—that could potentially need broadband access. Moreover, each point includes a census block identifier, making it easier to assess whether the structure has 25/3 or 100/20 Mbps service available to it, according to Form 477. However, the limitation of Form 477’s assumption that service for one location implies service for the entire census block remains.
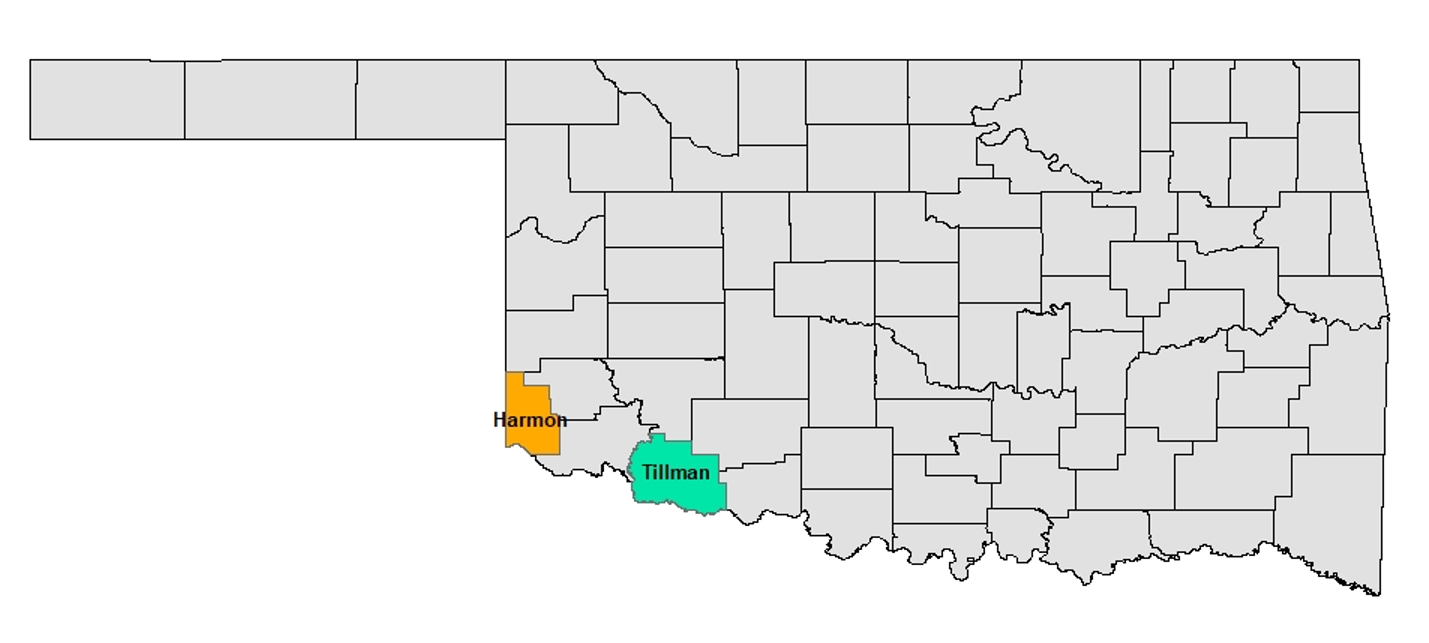
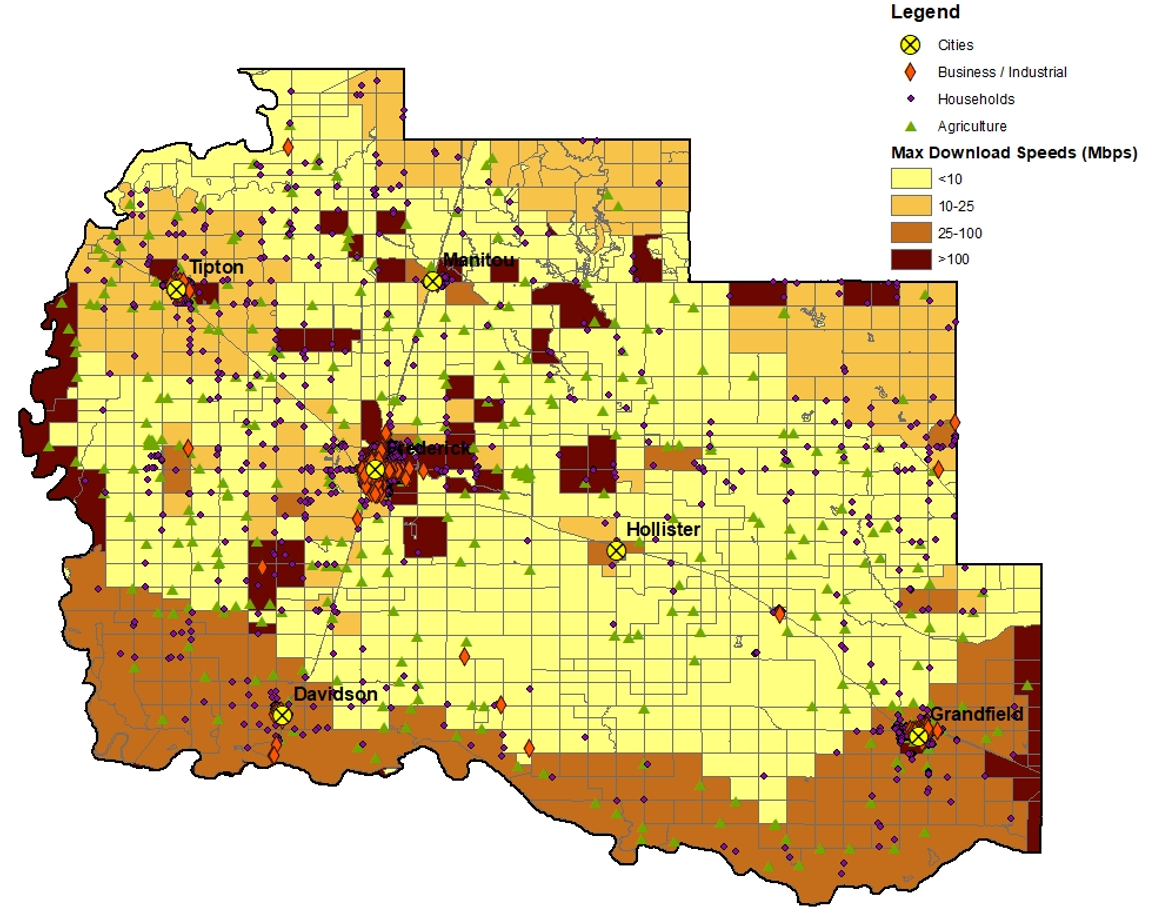
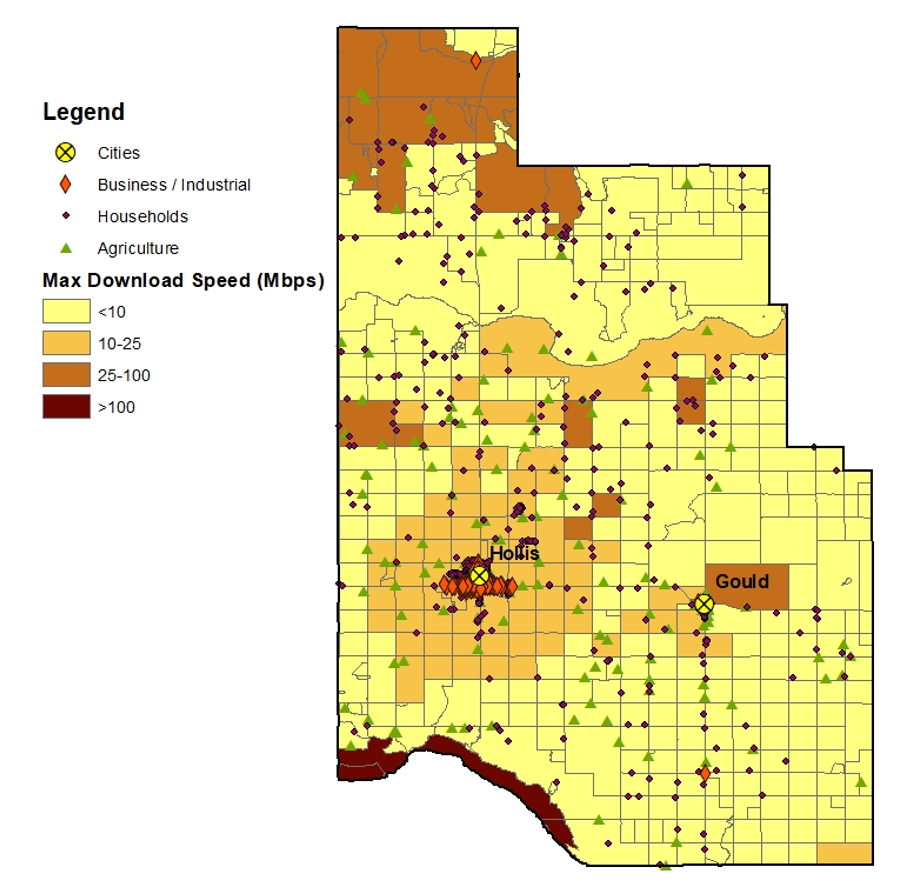
Using the most recent version of the CostQuest data (v3), we take a closer look at two Oklahoma counties: Tillman (2020 population 7,177) and Harmon (2020 population 2,488), both located in the southwest corner of the state, a predominantly rural and farming-dependent region (Figure 2). Both are also classified as persistent poverty counties by the USDA’s Economic Research Service, meaning that at least 20% of the residents have been measured as poor since the 1980 census. We mesh this dataset with the December 2020 Form 477 data on broadband availability from the FCC. Figures 3 and 4 show the resulting maps for Harmon and Tillman Counties.
An important observation from the preliminary BSLF data is that property type matters. The pockets of “good” broadband service are clearly clustered near cities; the households that are located nearby typically have access to the best speeds in the county. However, agricultural structures are located throughout each county and typically have very poor (<10 Mbps) service available. Summary statistics from each county support this assertion; while only 10%–17% of residential structures lacked access to 25/3 Mbps, more than 60% of agricultural structures fell under this classification (Table 1).
The total number of structures lacking broadband access is also visibly impacted by the categories of structures examined. If only residential BSLF entries are considered, Tillman County had approximately 363 units lacking broadband service at 25/3 Mbps speeds. Adding agricultural and land units nearly doubles the number of structures (over 700) lacking broadband. Similarly, Harmon County had 234 residential units lacking 25/3 Mbps access. Including agricultural and land units again approximately doubles this count to over 455. Such significant variance is likely to have an impact on the total amount of investment that will be necessary to bring “full connectivity” to these counties and may further impact whether they are viewed as unserved or underserved areas. While it may be difficult to determine the cost of achieving full connectivity, a study conducted for the state of Illinois came up with a rough estimate of approximately $4,000/structure served based on recent broadband award documentation from several federal and state grant programs (Horrigan, Whitacre, and Rhinesmith, 2020). Employing this figure, the cost of providing ubiquitous 25/3 Mbps access for Tillman County households would be $1.45 million (363 * $4,000), but providing service for all structures would be over $3 million (772 * $4,000). The estimates in Harmon County would also more than double, from $0.9 million when only residential structures are included to over $1.9 million for all possible structures. The costs would be notably higher for providing 100/20 Mbps service (which is the suggested speed threshold for ARPA/Infrastructure Act funding—see Figure 1), totaling $5.6 million for households and $8.6 million for all structures in Tillman County and $5.3 million for households and $7.6 million for all structures in Harmon County.
These data also highlight the lack of broadband services specifically in agricultural locations. While agricultural units make up only 8% of all units in Tillman County, they represent 32% of the points lacking 25/3 Mbps service. Sixty-two percent of all agricultural units lack 25/3 Mbps and 89% do not have 100/20 service. In Harmon County, agricultural units make up 7% of total units but constitute almost 20% of units lacking 25/3 Mbps speed. Some 67% and 96% of agricultural units lack 25/3 Mbps and 100/20 Mbps speeds, respectively. These data support the efforts of organizations like the Precision Ag Task Force and will be necessary to help identify exactly where agricultural properties are located and how best to extend service to them.
| Tillman | Harmon | |||||||||
| Lacking 25/3 | Lacking 100/20 | Lacking 25/3 | Lacking 100/20 | |||||||
| Active BSLF Points by Category | Units | Units | % | Units | % | Units | Units | % | Units | % |
| Residential | 3,782 | 363 | 10% | 1,409 | 37% | 1,352 | 234 | 17% | 1,314 | 97% |
| Business/industrial | 375 | 52 | 14% | 143 | 38% | 189 | 16 | 8% | 142 | 75% |
| Agriculture | 394 | 246 | 62% | 352 | 89% | 137 | 92 | 67% | 131 | 96% |
| Land | 363 | 105 | 29% | 227 | 63% | 290 | 129 | 44% | 261 | 90% |
| Other Points | 51 | 6 | 12% | 24 | 47% | 65 | 6 | 9% | 63 | 97% |
| Total | 4,965 | 772 | 16% | 2,125 | 43% | 2,033 | 477 | 23% | 1,911 | 94% |
Notes: 25/3 refers to 25 Mbps download and 3 Mbps upload. 100/20 refers to 100 Mbps download and 20 Mbps upload.
Source: CostQuest Associates Broadband Serviceable Location Fabric, v3 (2021). FCC Form 477 Broadband Availability Data (Dec. 2020).
More detailed maps of broadband availability data are necessary for the efficient expansion of broadband infrastructure and services. Correctly identifying where service is available and which structures exist and need service is required to accurately design policies and dispense funding and design policies to address existing gaps. The creation of a national broadband serviceable location fabric (BSLF)—a map of all locations where fixed broadband can be installed—is an important step in addressing the needs of all property types, not only of the residential properties but also of the agricultural community.
BSLF data obtained by the state of Oklahoma serve as an early opportunity to assess the strengths and limitations of this more granular data product. As a result of our study, we are positioned to offer input on what changes can be made to enhance the value and impact of the BSLF data. For one, cost estimates vary considerably based on the types of structures included. It is important for policy makers and project managers to focus attention to the various types of structures in rural areas when planning broadband infrastructure build-out and the mix of technologies best-suited for these more rural locations. Second, agricultural units make up a disproportionate number of structures lacking 25/3 and 100/20 Mbps speeds. This finding is in line with the recent conclusions of the Precision Ag Connectivity Task Force. Its data and mapping working group has already identified the need to “ground-truth” usability and coverage availability, particularly in agricultural regions (Precision Ag Connectivity Task Force, 2021).
As the winning contractor for the creation of a national BSLF, CostQuest Associates is expected to provide a draft of the national dataset within 4 months.3 However, this initial version will not be immediately available since ISPs are being given six months to respond to and/or challenge the data. As a result, a national BSLF is unlikely to be available until early 2023, at the earliest. Even then, it is unclear how the proprietary BSLF data will be incorporated into a public-facing format, such as a broadband map, due to data usage rights. Depending on the terms agreed upon by CQA and the FCC, which are so far undisclosed, a public map may only be made available via an end-use licensing agreement (i.e., for a fee). Such a barrier may have significant implications for future research. The CQA data obtained by the state of Oklahoma is similarly restricted with respect to public release, and the state is currently considering how to best utilize the data to implement a state-level broadband availability map while meeting these requirements.
As a final note, a functioning BSLF is by itself not enough to solve the largest problem associated with the U.S. broadband availability maps. Without more detailed information on exactly where each provider currently offers each of its broadband packages (i.e., a shapefile or list of addresses as opposed to the current census block approach), the BSLF could still overlook structures within a block that has service “somewhere” but not at the structure’s actual footprint. This “exact service area” information is also required by the DATA Act, but the expected date of availability is again unclear (Whitacre and Biedny, 2022). Worth noting is that the BSLF’s focus on agricultural structures excludes most production acres, which can benefit from broadband provision for many precision agriculture techniques (Seidemann, 2021; USDA, 2019). Further, precision agriculture largely uses mobile (cellular) networks instead of fixed connections. Data on mobile broadband deployment is also available from the FCC (2022a), but reports generally show that nearly all (99.9%) of the United States has access to at least 5/1 Mbps speeds and that even in rural areas 90% of the population has access to 10/3 Mbps (FCC, 2021a). These figures focus on population measures as opposed to production acres.
However, a recent update from the FCC regarding the national BSLF dataset has made it clear that the types of structures to be included in the final version are not yet finalized. Unfortunately, the only types of structures included in a preliminary version of the data made available to broadband service providers were three specific building types: business only, residential only, and combined business and residential (FCC, 2022b). This is in direct contrast to the earlier version of the data reported on here—and in Whitacre and Biedny (2022)—where agricultural-specific locations were explicitly identified. This is a disappointing development, since the BSLF holds a great deal of promise for documenting agricultural facilities that could benefit from broadband. The data discussed in this paper suggest that it is possible to identify these locations. It remains to be seen whether the final BSLF dataset provided to researchers, policy makers, and providers will include more categories of structures than just those for business and residential purposes.
Recent federal legislation and funding has paved the way for significant improvement in rural America’s broadband situation. Connecting agricultural structures such as barns, silos, or storage should be part of the discussion, but challenges remain. Rural and agricultural advocates should be aware of the pending broadband funding and maintain contact with their state-level entities that are responsible for map development and requests for proposals. The BSLF can help make the case for why agricultural locations should be included in broadband funding decisions. However, each state controls their own purse strings, so the final results may be dependent on local advocacy groups and the strength of the arguments with key decision makers.
American Rescue Plan Act of 2021. Public Law 117-2. Available online: https://www.congress.gov/bill/117th-congress/house-bill/1319/text.
Busby, J., and J. Tanberk. 2020. “FCC Reports Broadband Unavailable to 21.3 Million Americans, BroadbandNow Study Indicates 42 Million Do Not Have Access.” BroadbandNow. Available online: https://broadbandnow.com/research/fcc-underestimates-unserved-by-50-percent.
Community Networks. n.d. “Our Big List of American Rescue Plan Community Broadband Projects.” Washington, DC: Institute for Local Self-Reliance. Available online: https://muninetworks.org/content/our-big-list-american-rescue-plan-community-broadband-projects.
Curi, M. 2021, November 30. “Losing Bidder Throws Wrench in FCC Broadband Dataset Rollout.” Bloomberg Law. Available online: https://news.bloomberglaw.com/tech-and-telecom-law/losing-bidder-throws-wrench-in-fcc-broadband-dataset-rollout.
Engebretson, J. 2018, October 9. “Report: Rural Broadband Availability Is Vastly Overestimated Thanks to Flawed FCC Data.” Telecompetitor. Available online: https://www.telecompetitor.com/report-rural-broadband-availability-is-vastly-underestimated-thanks-to-flawed-fcc-data/.
Engebretson, J. 2021, November 10. “Rural Broadband Funding: Unpacking the Historic $42.5 Billion BEAD Program.” Telecompetitor. Available online: https://www.telecompetitor.com/rural-broadband-funding-unpacking-the-historic-42-5-billion-bead-program/.
Federal Communications Commission. 2000. “Local Competition and Broadband Reporting.” Report and Order FCC 00–114. Federal Register 65(71): 19675. Available online: https://www.govinfo.gov/content/pkg/FR-2000-04-12/pdf/00-9187.pdf.
Federal Communications Commission. 2013. “Modernizing the FCC Form 477 Data Program.” Report and Order. Federal Register 78(156): 49126. Available online: https://www.govinfo.gov/content/pkg/FR-2013-08-13/pdf/2013-19493.pdf.
Federal Communications Commission. 2016. 2016 Broadband Progress Report. FCC 16-6. Available online: https://docs.fcc.gov/public/attachments/FCC-16-6A1.pdf.
Federal Communications Commission. 2021a. Fourteenth Broadband Deployment Report. FCC 21-18. Available Online: https://docs.fcc.gov/public/attachments/fcc-21-18a1.pdf.
Federal Communications Commission. 2021b. Accelerating Broadband Deployment on Unserved Agricultural Lands Working Group: Interim Report. Available online: https://www.fcc.gov/sites/default/files/precision-ag-accelerating-deployment-wg-interim-report-03122021.pdf.
Federal Communications Commission. 2022a. “Mobile Deployment Form 477 Data.” Available online: https://www.fcc.gov/mobile-deployment-form-477-data.
Federal Communications Commission. 2022b. “What Is the Location Fabric?” Available online: https://help.bdc.fcc.gov/hc/en-us/articles/5375384069659-What-is-the-Location-Fabric-and-the-Preliminary-Location-Fabric-.
Ford, G. 2011. Challenges in Using the National Broadband Map’s Data. Phoenix Center Policy Bulletin 27.
Ford, G. 2019. Quantifying the Overstatement in Broadband Availability from the Form 477 Data: An Econometric Approach. Phoenix Center Perspectives 19-03.
Government Accountability Office. 2021. FCC Is Taking Steps to Accurately Map Locations That Lack Access. GAO Report GAO-21-104447. Available online: https://www.gao.gov/assets/gao-21-104447.pdf.
Government Accountability Office. 2022. “Decision: Matter of Lightbox Parent, LP.” GAO Report B-420032.2; B-420032.3; B-420032.4; B-420032.5; Available online: https://www.gao.gov/assets/b-420032.2.pdf.
Grubesic, T. 2012. “The U.S. National Broadband Map: Data Limitations and Implications.” Telecommunications Policy 36: 113–126.
Horrigan, J., B. Whitacre, and C. Rhinesmith. 2020. Universal Broadband in Illinois: Studying the Costs of Providing Free and Affordable Service for All Residents. Presented to the Illinois Broadband Advisory Council. Available online: https://www2.illinois.gov/dceo/ConnectIllinois/Documents/BAC Broadband Affordability Study.pdf.
Infrastructure Investment and Jobs Act of 2021. Public Law 117-58. Available online: https://www.congress.gov/bill/117th-congress/house-bill/3684/text.
Kandilov, A., I. Kandilov, X. Liu, and M. Renkow. 2017. “The Impact of Broadband on U.S. Agriculture: An Evaluation of the USDA Broadband Loan Program.” Applied Economic Perspectives and Policy 39(4): 635–661.
Keller and Heckman LLP. 2021, November 12. “The Broadband Equity, Access & Deployment Program (BEAD): $42.45 Billion for State Broadband Grants.” Beyond Telecom Law Blog. Available online: https://www.beyondtelecomlawblog.com/the-broadband-equity-access-deployment-program-bead-42-45-billion-for-state-broadband-grants/.
Lide, C. 2021a. “Broadband Support Opportunities for State and Local Governments under the American Rescue Plan Act of 2021.” National Law Review 11(74).
Lide, C. 2021b. “An Overview of Broadband Provisions in the Infrastructure Bill (as of July 31, 2021).” National Law Review 11(235).
LoPiccalo, K. 2022. “Impact of Broadband Penetration on U.S. Farm Productivity.” Telecommunications Policy 46(9): 102396.
Noble, A. 2020, February 11. “Frustrated by Flawed Broadband Maps, States Are Trying to Create Their Own.” Route Fifty. Available online: https://www.route-fifty.com/infrastructure/2020/02/looking-incorrect-broadband-maps-states-are-trying-create-their-own/163052/.
National Telecommunications and Information Administration (NTIA). 2009a. “State Broadband Data and Development Grant Program: Notices.” Federal Register 74(129): 32545–32565.
National Telecommunications and Information Administration (NTIA). 2009b. “State Broadband Data and Development Grant Program: Clarification.” Federal Register 74(154): 40569–40570.
Panettieri, A. 2021, September 24. “New Guidance on ARPA Funds for Broadband Projects.” National League of Cities. Available online: https://www.nlc.org/article/2021/09/24/new-guidance-on-arpa-funds-for-broadband-projects/.
Precision Ag Connectivity Task Force. 2021. Task Force for Reviewing the Connectivity and Technology Needs of Precision Agriculture in the United States. Available online: https://www.fcc.gov/sites/default/files/precision-ag-report-11102021.pdf.
Read, A. and K. Wert. 2021, December 6. “How States Are Using Pandemic Relief Funds to Boost Broadband Access.” Pew Charitable Trust. Available online: https://www.pewtrusts.org/en/research-and-analysis/articles/2021/12/06/how-states-are-using-pandemic-relief-funds-to-boost-broadband-access.
Savage, T. and M. Prather. 2021, December 6. “First ARPA Funds Go to Broadband Mapping, Youth Mental Care.” NonDoc. Available online: https://nondoc.com/2021/12/06/arpa-funds-first-uses/.
Seidemann, J. 2021. “From Fiber to Field: The Role of Rural Broadband in Emerging Agricultural Technology.” NTCA – The Rural Broadband Association. Available online: https://www.ntca.org/sites/default/files/documents/2021-07/06.14.21 SRC Ag Tech Final.pdf.
Sullivan, M. 2021, August 11. “$1 Trillion Infrastructure Bill Provides the Biggest Investment in Broadband in Decades.” Fast Company. Available online: https://www.fastcompany.com/90664673/infrastructure-bill-broadband-senate.
Tibken, S. 2021a, February 19. “Millions of Americans Can’t Get Broadband because of a Faulty FCC Map. There’s a Fix.” CNET. Available online: https://www.cnet.com/features/millions-of-americans-cant-get-broadband-because-of-a-faulty-fcc-map-theres-a-fix/.
Tibken, S. 2021b, February 23. “States Couldn’t Afford to Wait for the FCC’s Broadband Maps to Improve. So They Didn’t.” CNET. Available online: https://www.cnet.com/features/states-couldnt-afford-to-wait-for-the-fccs-broadband-maps-to-improve-so-they-didnt/.
US Department of Agriculture. 2019. A Case for Rural Broadband: Insights on Rural Broadband Infrastructure and Next Generation Precision Agriculture Technologies. Washington, DC: USDA. Available online: https://www.usda.gov/sites/default/files/documents/case-for-rural-broadband.pdf.
Whitacre, B. 2021. “COVID-19 and Rural Broadband: A Call to Action or More of the Same?” Choices 36(3).
Whitacre, B. and C. Biedny. 2022. “A Preview of the Broadband Fabric: Opportunities and Issues for Researchers and Policymakers.” Telecommunications Policy 46(3): 102281.
White, T. 2021, March 22. “New Broadband Mapping Fabric Will Help Unify Geocoding Across the Broadband Industry, Experts Say.” Broadband Now. Available online: https://broadbandbreakfast.com/2021/03/new-broadband-mapping-fabric-will-help-unify-geocoding-across-the-broadband-industry-experts-say/.
1 For additional details, see Whitacre and Biedny, (2022).
2 For more details related to the Oklahoma CQA data, see Whitacre and Biedny (2022).
3 Lightbox Parent L.P., a competitor to CostQuest, filed a complaint against the FCC’s selection process, which delayed FCC/CQA progress with the BSLF timeline (Curi, 2021). This complaint was dismissed in March 2022 (Government Accountability Office, 2022).

