Fruit and vegetables that never reach the consumer represent losses of water, chemical inputs, and labor, in addition to the loss of nutrient dense, recoverable food (Hall, et al., 2009; Kummu, et al., 2012). Actions that reduce loss may increase supplies of nutritious food for those who are currently food insecure and contribute to global food needs without additional or more intensive land use and its associated negative environmental impacts (Tilman et al., 2011; Garnett et al., 2013; Royte, 2016; Fan, 2017). U.S. food waste estimates of 40%—estimates that do not include on-farm food loss (Gunders et al., 2017)—have motivated stakeholders across the supply chain to develop improved approaches to measuring food waste, understanding the determinants, and devising waste-prevention strategies. To date, a majority of food waste studies have focused on post-consumer waste and to a lesser extent waste in food distribution and retail settings; very little attention has been given to understanding food loss at the farm level.
Information on the volume and value of food that never leaves the field is important from both the perspective of farmers making harvesting decisions and, on an aggregate level, for informing policy decisions related to food loss. For most farming businesses, utilizing produce that is currently “lost” on-farm, however, is only a reasonable option when revenues earned by harvesting and selling this produce exceed the costs of doing so. Recently, careful estimates have been made of the volume of selected vegetables left unharvested in fields on mid- and large-scale farms in North Carolina (Johnson, 2018; Johnson et al., 2018a,b), which have informed our understanding of growers’ decision-making processes at harvest (Johnson and Dunning, forthcoming). Extending these studies, we explore the costs and potential revenue that could be generated from selling this unharvested produce. We estimate the value of food loss on a per acre basis and aggregate it to a state level using North Carolina as a case example. To the best of our knowledge, this study is the first to offer estimates of monetized values of food loss based on post-harvest field data.

Note: These values reflect the per acre produce
recovered following the final harvest in 2017 relative
to the 3-year average (2014–2016) of per acre yield
for select southeastern crops in North Carolina.
Source: Johnson et al. (2018b).
Existing estimates of on-farm loss in the United States have been based on grower self-reports (Berkenkamp and Nennich, 2015; Neff et al. 2018) or derived from unharvested acreage data from the U.S. Department of Agriculture (2017). The latter comparison of planted relative to harvested acreage does not include produce from fields that were harvested once or several times yet not completely harvested of product meeting market standards. Actual field measurement is rare due to the time-consuming nature of data collection.
The field loss values in this paper are based on estimates of the volume of product remaining unharvested for a set of southeastern U.S. crops in 2017. Johnson et al. (2018b) evaluate in-field produce loss on 68 fields of eight vegetable crops on nine commercial farms in eastern North Carolina. These operations market primarily fresh whole product to wholesale channels and represent 6.8% of the state’s production acreage of vegetables, melons, and sweet potatoes. Samples were collected from randomly selected areas of fields shortly after each farmer reported that the field had been harvested for the last time and before any remaining product was either incorporated into the soil or destroyed to plant another crop. The collected field samples were sorted into categories of marketable, edible (but not marketable), and inedible using USDA quality indicators and equipment for produce inspection. Marketable product met specifications for U.S. No. 1 grade or higher (such as U.S. Fancy), which is commonly used in conventional fresh produce trade. Edible product was in good condition but did not meet U.S. No. 1 grade due to size, shape, coloring, healed scarring, or other types of cosmetic imperfections. Inedible product was past maturity, bruised, cracked, or had evidence of decay or other progressive conditions. Johnson (2018) provides additional details about the approach used to quantify field loss.
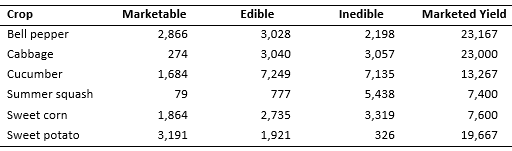
Note: All values measured in lb/acre.
Source: Johnson et al., 2018b.
Figure 1 illustrates the distribution of marketable, edible and inedible produce for six commonly grown southeastern crops left in fields after the final harvest. For additional context, Table 1 summarizes the annual harvested weight for these crops. Combined across the considered crops, the volume of marketable product left unharvested reflects 11% of the average per acre volume harvested in North Carolina. (Estimates are relative to the 3-year average [2014–2016] of volume per acre, U.S. Department of Agriculture 2016, 2017). Including edible weight increases this volume to 34% of the average per acre harvest. Thus, on average across these six crops, the loss of edible food (which does and does not meet grading specifications) reflects one-third of the annual volume of North Carolina sales of these products.
Each crop in Figure 1 is harvested progressively, with three to five harvests occurring in the same field over a period of several weeks. For each field, the first or second harvest is typically of the best quality; when plants are young and healthy, yield is high and of high quality. As plants age, they lose vigor, and harvest traffic causes minor damage. As a result, harvesting efficiency decreases as the season progresses; it becomes more time consuming to identify the preferred blemish-free product. The exception to this approach to harvesting is sweet potato, which occurs as a single event.
Farmer decisions to continue the harvest—to return to a field to harvest what otherwise will be “lost”—are based on the marginal cost and benefit of harvesting and packing that product given their marketing opportunities. In making this decision, growers are typically not concerned with the sunk costs of production; instead, they compare available sale options to the “pick and pack out” costs to harvest, grade, and pack the product. These costs, and farmer decisions made in response to them, can vary considerably due to buyer requirements that impact the costs of packing and packaging (such as size and type of containers) and farm management conditions, including current and projected labor conditions, remaining “shelf-life” for perishable products, the opportunity costs of reharvesting a particular field relative to other options, and the probability of harvested product being rejected based on quality standards that are fixed in principle but flexible in practice (Johnson and Dunning, forthcoming). For southeastern vegetable crops, farm enterprise budgets indicate that “pick and pack out” costs can account for 50% or more of variable costs (e.g., University of Kentucky, 2017).
Conventional sales channels into retail and food service markets typically require that products meet specified standards related to quality (attributes such as size and shape) and condition (type and extent of blemishes of a progressive nature that can reduce shelf-life). Standards for produce grades developed by the USDA Agricultural Marketing Service commonly serve as a baseline requirement. In practice, however, produce buyers (e.g., wholesaler intermediaries) often apply more stringent standards. While the term “standards” suggest these are fixed across time and space, in practice what is deemed to meet a given standard can change based on market conditions. In a market with less supply, what is considered a secondary-quality produce item can be graded as first-quality, and the opposite is true during times of surplus. The price differential between quality grades can be substantial, with growers reporting that slight differences in quality translate to differences of 50% or more in market price. The flexibility of applying standards increases the risk of rejection later in the season, as the last-harvest crops from a grower in one region compete with the higher quality crops newly available from a competing region.
A small but growing number of alternative markets exist for lower-grade products, such as “ugly produce” programs at grocery retailers and subscription box home delivery programs. Food banks are another potential market for lower-quality produce; they may offer tax deductions for charitable donations and in some cases compensate growers for the “pick and pack out” costs of product. While these alternative channels do mitigate on-farm food loss, it is not clear whether these prices are sufficient to offset harvest and packing costs.
A farmer can justify returning to the field to harvest additional product when there is a financial incentive to do so. Using estimates of the mean amount of product left unharvested (reported in Johnson et al., 2018b), we generate estimates of the profit or loss that a farmer would incur by harvesting and selling this product. We consider four scenarios, which reflect differences in sales price and packing requirements of different types of buyers.
As noted above, alternative markets for products not meeting USDA grading specifications do exist in some locations. We account for these possible markets with four alternative scenarios: Scenario 1 reflects the case where marketable and edible categories of product are offered for sale in “ugly produce” markets such as produce-box programs or retail, which pay farmers 50% of the value of USDA No. 1 grade products. Scenario 2 reflects the case of selling the marketable and edible recovered produce to a food bank at $0.07/lb. These sales prices reflect those received by farms in the study region. Scenario 3 reflects the case where marketable product is sold at 100% of the value of USDA No. 1 grade products, while the edible portion of the harvest is sorted and sold to “ugly produce” channels at 50% of this value. Scenario 4 reflects the case where marketable product is sold at 100% of the value of USDA No. 1 grade products, while the edible portion of the harvest is sold to a food bank at $0.07/lb. Inedible produce is assumed to have zero value and thus not included as a source of revenue in these scenarios.
While it is assumed that only marketable and edible product would be harvested, the cost of harvest labor is calculated by pound for the total amount of product (marketable, edible, and inedible) remaining in the field. This approach accounts for the loss of harvest labor efficiency later in the season due to (potentially) large volumes of inedible product (Figure 1). Packing labor is included only for grading and packing that occurs in the packing house and is assumed to vary by the total marketable plus edible volume because growers can ascertain these labor needs by the harvested volume and adjust accordingly. Marketable product is packed in cartons and edible “ugly produce” product is packed in wooden bins. Field pack into wooden bins for sales to the food bank market does not include an additional packing labor cost, as food bank staff or volunteers typically sort this product when packing it into smaller volumes for distribution. The cost of wooden bins is included in the food bank estimates (Scenarios 2 and 4), but it is worth noting that food banks increasingly supply plastic bins for growers to use.
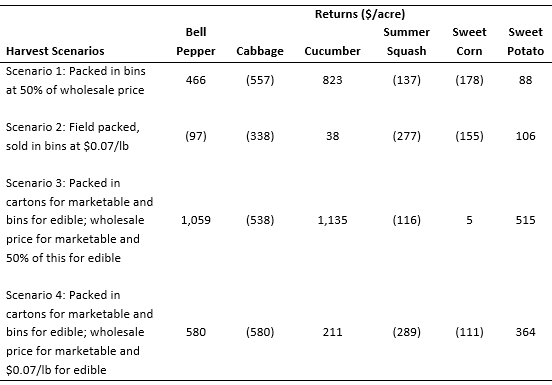
Data sources and assumptions: Wholesale prices: USDA AMS Custom Average Pricing
Tool for USDA No.1 FOB product shipped from North Carolina in 2017.
Harvest and packing labor requirements: Enterprise budgets, University of Kentucky, 2017.
Labor cost: $14/hour based on total costs associated with H2A labor as reported by North
Carolina growers.
Packaging: $1.50 per cardboard box; $20 per wooden bin.
A few caveats of this analysis are worth highlighting. First, it is important to note that these field losses do not include product that is sorted out in the packing house (culls). As such, this analysis reflects the potential profitability of returning to the field for an additional harvest rather than the incentive to sell or donate product that has already been harvested. Secondly, these estimates reflect the marketing opportunities and costs available in the study region (North Carolina) and may not apply in other locations. For example, North Carolina has a large sweet potato processing sector, and local processing is available for some bell pepper growers. This approach further assumes that the labor needed for the additional harvest is available and can be hired at the same wage rates as during the regular harvest period. Thirdly, this analysis implicitly assumed that there is a buyer for the recovered volume of produce and that the increased market supply would not impact market price. These volume and value estimates thus offer insight into the extent of loss for the examined crops in North Carolina but would require reconsideration of several assumptions to be relevant in other settings.
Table 2 summarizes the results of the scenario analysis for each crop. Given the processing opportunities available in North Carolina, and assuming there is demand for the produce, only cucumbers and sweet potatoes offered consistently positive returns across each of the examined scenarios. These results do, however, vary considerably depending on the quality of the unharvested produce and the market opportunities.
An additional harvest of bell peppers and sweet corn may be profitable dependent upon the available market opportunities. In only the most conservative scenario (Scenario 2) was it unprofitable to reharvest bell peppers. For sweet corn, at best, a small, $5/acre return is offered in circumstances where the recovered product is sorted and separately sold to marketable and edible “ugly produce” channels (Scenario 3). Partially due to the relatively high proportion of inedible relative to edible produce, harvesting abandoned cabbage and summer squash was found to be unprofitable under any of the examined scenarios.
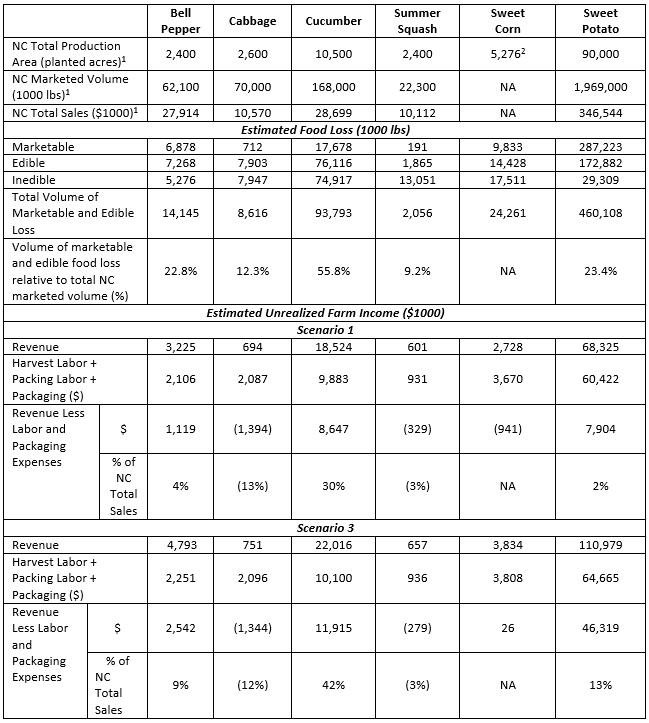
Note: NA = Not Available.
1 U.S. Department of Agriculture (2017).
2 U.S. Department of Agriculture (2012).
While these farm-level results are useful, examining these results in aggregate offers further insight into the magnitude of this issue. Multiplying the total production areas in North Carolina for each crop by their estimated recoverable marketable and edible volume offers state-level estimates of the loss of potentially useable produce. Table 3 presents estimates of both the volume and the value of food loss for each of the considered vegetable crops. At the low end, for summer squash it is estimated that more than 2 million pounds of marketable and edible product remains unharvested in the fields. Sweet potato production, which in North Carolina has a larger area under production than the other considered crops combined, annually leaves an estimated 460 million pounds of marketable or edible product unharvested in fields.
In the lower portion of Table 3, the per acre profitability results (from Table 2) are extended to estimate the aggregate monetized value of food loss for North Carolina. For brevity, results of only two of the considered scenarios are presented. Again, Scenario 1 (all marketable and edible product is sold to wholesale markets at 50% of standard prices) is akin to selling to “ugly produce” markets. These estimates indicate that the unharvested values of bell pepper, cucumber, and sweet potatoes reflect $1.1, $8.6, and $7.9 million, respectively, in forgone income to North Carolina growers. Paying to harvest and pack abandoned cabbage, summer squash, and sweet corn is not profitable. Scenario 3 considers the case of better market opportunities, where marketable and edible product is sorted and sold to standard wholesale and “ugly produce” channels, respectively. By these estimates, compared to Scenario 1, the annual value of North Carolina’s food loss increases between two- and six-fold, and it becomes profitable to harvest sweet corn.
Recent, careful field measurement studies indicate that previous reports have underestimated the volume of on-farm produce loss (Johnson et al., 2018b). Capturing this food loss may offer a means to increase production yield with minimal additional environmental impact and generate additional farmer profits. This study pairs field estimates of the volume of unharvested produce with sale price and cost data to estimate the market value of produce left unharvested in North Carolina fields. Potential returns to harvesting abandoned produce were found to vary considerably among the six southeastern crops examined. Under the examined scenarios, some crops (cucumber, sweet potato) offered consistently large and positive returns to reharvesting, while for other crops (cabbage, summer squash) under none of the examined scenarios was it advantageous to do so. Other crops (bell pepper, sweet corn) varied in their outcomes; under some, but not all, market circumstances it would make good business sense to conduct another harvest of these fields.
A few generalizable insights can be gleaned from this analysis. Most importantly, the mix of marketable, edible, and inedible produce varies considerably by crop and significantly affects the profitability of strategies to recapture food loss. Having more edible relative to marketable crop in the field leads to a preference for selling to an alternative wholesale market. In the same vein, the larger the proportion of inedible produce remaining in a field, the more product there is to examine during harvest and the less profitable it will be to recover any marketable and edible product. These findings have important implications for efforts to reduce food loss. Regardless of the type of crop, the significant volumes of unharvested but edible produce suggest that should opportunities exist to at least reduce or compensate growers for their packaging and labor costs a significant volume of food is available to be recaptured and could be streamed into food assistance channels. These results, however, suggest that no single food recovery strategy will be most appropriate across all crops. Rather, among other considerations, recovery strategies would do well to consider targeting limited food recovery resources to the crops which offer the highest proportion of edible relative to inedible produce.
These findings are instructive in offering both insight into the magnitude of this problem (or, if perceived otherwise, opportunity) and a process through which the value of unharvested produce in other regions could be monetized. This approach to monetizing the value of food loss, however, comes with several important caveats. These results are reflective of food-loss volume estimates based on a set of mid- and large-scale growers in North Carolina. In practice, farm-level decisions should be based on growers’ own estimates at harvest and be made using a tested measurement protocol (Johnson, 2018). Additionally, the results are based on North Carolina processing and marketing opportunities and costs and assume that demand for these products is large and stable enough to absorb a potentially substantial increase in produce volume without adversely affecting market prices (see Table 3).
These results have implications for farm decision making, regional food access strategies, and tax and regional development policies that affect incentives for recapturing abandoned food. At the farm level, these findings can be used to inform growers’ farm management plans. This may mean a reconsideration of harvesting decisions and more intentionality in identifying sales channels for surplus and lower-quality product. Extension personnel and others can be important catalysts by identifying and circulating buyer lists to interested growers and facilitating these connections. (For an example, see the Whole Crop Harvest initiative at North Carolina State University, 2019). Improved understanding of the potential volume of unharvested produce may also encourage conversations with produce growers about the value of food donation.
At the state or regional level, the volumes and associated value revealed in our state-level estimates of food loss offer valuable information to the ongoing work to prevent food waste and loss. By way of example, Feeding America and its national network of over 200 food banks has an online match-making system to arrange regional transportation of surplus food products among member food banks and, more recently, has become active in aggregating and distributing product. This information would allow these groups to better understand the type and scale of potentially available produce and, when estimated by county, product location. Doing so will enable these organizations to make better use of their food infrastructure and to potentially more effectively target farmer recruitment or donation efforts and partnerships.
To the extent that one might want to incentivize the recapture of abandoned produce through policy incentives, this information could also inform federal and state policy provisions and implementation. Currently, tax deductions for donations are available to farm operators who are not incorporated and who opt to itemize their tax deductions. The tax benefits of these donations, however, are limited (van der Hoeven, 2017). A different and expanded federal or state tax treatment of food donations could provide further incentive to harvest abandoned product (Harvard Food Law and Policy Clinic, 2016). Alternatively, states and government agencies could initiate programs that encourage and facilitate food access and other social support programs to purchase surplus and lower-grade products (see Kentucky’s Farm to Food Bank program, KAFB, 2019). Improved information about food loss can also inform economic development initiatives and industry recruitment focused on food processing and manufacturing, which could provide reliable alternative markets for the significant volumes of produce currently left on-farm.
This article illustrates the income opportunities for farmers that can accompany growth in alternative produce markets. If demand for lower-quality produce increases for “ugly produce” programs in retail settings and subscription box home delivery, and from food banks able to compensate farmers for their “pick and pack out” costs, growers of some vegetables could increase their income. This reduction in on-farm food loss also reflects an increase in yield that does not come at the expense of additional land conversion, water and other natural resource use, or application of chemical inputs.
Berkenkamp, J., and T. Nennich. 2015. Beyond Beauty: The Opportunities and Challenges of Cosmetically Imperfect Produce. Report 1: Survey Results from Minnesota Produce Growers. National Good Food Network. Available online: http://www.ngfn.org/resources/ngfn-database/Beyond_Beauty_Grower_Survey_Results_052615.pdf
Fan, S. 2017, September 5. “Reducing Food Loss is Key to End Hunger and Undernutrition by 2025.” International Food Policy Research Institute. Available online: http://www.ifpri.org/blog/reducing-food-loss-key-end-hunger-and-undernutrition-2025
Garnett, T., M.C. Appleby, A. Balmford, I.J. Bateman, and T.G. Benton. 2013. “Sustainable Intensification in Agriculture: Premises and Policies.” Science 341(6141): 33–34. doi:10.1126/science.1234485
Gunders, D., J. Bloom, J. Berkenkamp, D. Hoover, A. Spacht, and M. Mourad. 2017. Wasted: How America is Losing Up to 40 Percent of Its Food from Farm to Fork to Landfill. New York, NY: Natural Resources Defense Council, Issue Paper R10-05A.
Hall K.D., J Guo, M. Dore, and C.C. Chow. 2009. “The Progressive Increase of Food Waste in America and Its Environmental Impact.” PLoS ONE 4(11). doi:10.1371/journal.pone.0007940.
Harvard Food Law and Policy Clinic. 2016. Federal Enhanced Tax Deduction for Food Donation: A Legal Guide. Cambridge, MA: Harvard University. Available online: https://www.chlpi.org/wp-content/uploads/2013/12/Food-Donation-Fed-Tax-Guide-for-Pub-2.pdf
Johnson, L. 2018. How to Determine the Potential to Increase Vegetable Yield through Estimating and Reducing Field Losses. Raleigh, NC: NC State Extension Publication AG-840.
Johnson, L., and R. Dunning. Forthcoming. “Food Loss on the Farm: Lessons Learned from Conversations with Produce Growers.” In T. Minor, S. Thornsbury, and A. Mishra (eds.), Economics of Food Loss in Produce: From the Farm to the Retail Dock. Washington, DC: U.S. Department of Agriculture, Economic Research Service.
Johnson, L., R. Dunning, J.D. Bloom, C. Gunter, M. Boyette, and N. Creamer. 2018a. “Estimating On-Farm Food Loss at the Field Level: A Methodology and Applied Case Study on a North Carolina Farm.” Resources, Conservation & Recycling 137: 243–250.
Johnson, L., R. Dunning, C. Gunter, J.D. Bloom, M. Boyette, and N. Creamer. 2018b. “Field Measurement in Vegetable Crops Indicates Need for Reevaluation of On-Farm Food Loss Estimates in North America.” Agricultural Systems 167: 136–142.
Kentucky Association of Food Banks (KAFB). 2019. Kentucky Farm to Food Bank Program. Available online: https://kafb.org/farmstofoodbanks/
Kummu, M., H. de Moel, M. Porkka, S. Siebert, O. Varis, and P.J. Ward. 2012. “Lost Food, Wasted Resources: Global Food Supply Chain Losses and Their Impacts on Freshwater, Cropland, and Fertiliser Use.” Science of the Total Environment 438: 477–489.
Neff, R.A., E.K. Dean, M.L. Spiker, and T. Snow. 2018. “Salvageable Food Losses from Vermont farms.” Journal of Agriculture, Food Systems, and Community Development 8(2): 39–72.
North Carolina State University, Whole Crop Harvest (NCSU WCH). 2018. Whole Crop Harvest Resources. Available online: https://cefs.ncsu.edu/food-system-initiatives/whole-crop-harvest-resources/
Rethink Food Waste through Economics and Data (ReFED). 2016. A Roadmap to Reduce US Food Waste by 20 Percent. Available online: https://www.refed.com/downloads/ReFED_Report_2016.pdf
Smith, P. 2013. “Delivering Food Security without Increasing Pressure on Land.” Global Food Security 2(1): 18–23.
Royte, E. 2016, March. “How ‘Ugly’ Fruits and Vegetables Can Help Solve World Hunger.” National Geographic. Available online: https://www.nationalgeographic.com/magazine/2016/03/global-food-waste-statistics/
Tilman, D., C. Balzer, J. Hill, and B.L. Befort. 2011. “Global Food Demand and the Sustainable Intensification of Agriculture.” Proceedings of the National Academy of Sciences, 108(50): 20260–20264. doi: https://doi.org/10.1073/pnas.1116437108
University of Kentucky. 2017. 2017 Vegetable and Melon Budgets (Large Scale) Lexington, KY: University of Kentucky Center for Crop Diversification, CCD-BG-10. Available online: http://www.uky.edu/ccd/tools/budgets
U.S. Department of Agriculture. 2012. Census of Agriculture. State Data.
U.S. Department of Agriculture and North Carolina Department of Agriculture and Consumer Services. 2016. North Carolina Agricultural Statistics 2016. Raleigh, NC: Publication 217. Available online: https://www.nass.usda.gov/Statistics_by_State/North_Carolina/Publications/Annual_Statistical_Bulletin/AgStat2016.pdf
U.S. Department of Agriculture and North Carolina Department of Agriculture and Consumer Services. 2017. North Carolina Agricultural Statistics 2017. Available online: http://www.ncagr.gov/stats/AgStat/NCAgStatBook.pdf
van der Hoeven, G. 2017. “Enhanced Deduction for Donation of Food.” NC State Extension. Available online: https://localfood.ces.ncsu.edu/2017/12/enhanced-deduction-for-donation-of-food/
https://doi.org/10.1016/j.resconrec.2018.05.017
https://doi.org/10.1016/j.agsy.2018.09.008

