Total loss and waste of food produced in the United States may be as high as 40% and cost $218 billion a year (Gunders et al., 2017; ReFED, 2016). In addition to food wasted by households at home, institutions such as universities, schools, hotels, healthcare facilities, and other locations with cafeterias and catering contribute to total food waste. On January 26, 2012, the Food and Nutrition Service (FNS) of the U.S. Department of Agriculture (USDA) issued final regulations to align the School Breakfast Program (SBP) and National School Lunch Program (NSLP) with the most recent Dietary Guidelines for Americans (U.S. Department of Agriculture, 2012). The proposed school meal regulations originally included a limitation on starchy vegetables, but this limitation was later removed. Nevertheless, the proposal to limit starchy vegetables in school meals raised questions concerning vegetable intake or plate waste as well as costs and nutritional values of school meals. Despite the elimination of this proposal by FNS, questions dealing with the ramifications of plate waste in general remain largely unanswered.
Motivated by the FNS proposal, we center our attention on plate waste from vegetables offered in school lunch menus. The principal objectives are twofold: (i) to measure plate waste for vegetables from school lunches over the period of April 2012 to January 2013 and (ii) to document the value associated with plate waste of various types of vegetables in school lunches. The topic is important from several perspectives. Evidence shows that diets emphasizing vegetables, fruits, whole grains, and low-fat dairy products are not only beneficial for health but also help prevent obesity. We hypothesize that plate waste from starchy vegetables, particularly white potatoes, is lower relative to plate waste from nonstarchy vegetables. As such, concerns arise from nutritionists because children may not be getting the level of some nutrients from school lunches that alternative vegetables offer. Besides potential differences in plate waste, prices of nonstarchy vegetables are typically higher relative to prices of white potatoes; consequently, costs to school districts in providing nutritious meals may be higher than previously considered.
To keep research costs manageable, we focus on three elementary schools in Bryan, Texas, hereafter referred to as Independent School District 1 (ISD 1) and three elementary schools in Dallas, Texas, hereafter referred to as Independent School District 2 (ISD 2). As such, this work essentially constitutes a pilot study. The respective schools in each district were matched based on the percentage of students receiving free or reduced-price school meals and comparable numbers of student enrollment. Besides geographic location, the sociodemographic composition of the students from these school districts was not the same. On the basis of ethnicity, the students were predominantly white, black, and Hispanic in each school district. Students of Asian and Native American descent represented very small percentages of the populations in the respective school districts.
Buzby and Guthrie (2002) estimated that costs of food waste annually at elementary schools were on the order of $600 million. However, these analysts only had access to aggregate school meal costs and consequently were unable to examine costs of food waste specific to vegetables. Cohen et al. (2013) examined nutrient losses and economic costs associated with school meal waste among middle school students (grades 6–8) in Boston public schools in 2010–2011, estimating the average cost per vegetable item to be $0.21, the average percentage waste for vegetables to be 73%, and the average waste cost per student for vegetables to be $0.09. Our research permits this examination for various types of vegetables for elementary schools in two distinct independent school districts in Texas.
A registered dietitian selected the vegetables to ensure variety. However, the list of vegetables was restricted to the school lunch calendar and menu cycle. All school principals, teachers, and food service and custodial staff were notified of the study objectives, the dates of collection, and the plate waste study protocol. Teachers explained the protocol to their students before lunch on days of collection and instructed students that they were not obligated to participate. Study participants were kindergarten through fifth grade students who selected at least one vegetable as part of the NSLP. Lunch periods were scheduled by grade (K–5), and 30 minutes were allocated for lunch. Menu items and serving sizes were consistent throughout all lunch periods. Each school had complete control over when and what students were served; the research team had no control over menus or any competitive foods offered before or during the lunch periods.
In this study, we define plate waste as the quantity of edible portions of vegetables served that students discarded. Plate waste in school lunches traditionally has been measured using several methods, including physical measurements such as weighing discarded food (Comstock, St. Pierre, and Mackiernan, 1981; Chu et al., 2001; Glueson et al., 1994); visual estimates made by trained observers (Martin et al., 2007; Parent et al., 2012; Taylor, Yon, and Johnson, 2014; Williamson et al., 2003; Kropp et al., 2018); and combinations of methods that include weighing discarded food and photographing and analyzing contents of full and discarded plates (Adams et al., 2005; Marlette, Templeton, and Panemangalore, 2005).
Accurate measurement of school children’s food consumption and waste is challenging. Though labor intensive and time-consuming compared to other research protocols, we utilized a comparison of pre- and post-consumption plate weights as a basis for plate waste estimation. The study design was modeled after the aggregate plate waste method of Chu et al. (2001) and Cohen et al. (2013). For each data collection day, five to ten servings of each sampled vegetable were obtained on “test trays,” which were used to gather preweights for each vegetable item in which plate waste was collected to obtain an average weight in grams (g). The key measure was the percentage of plate waste of the respective vegetable items. To arrive at this measure, the total amount of plate waste was obtained and this total was divided by the number of children who chose the vegetable in question. The ratio provided the plate waste per child. Finally, the percentage of plate waste was calculated by dividing this ratio by the preweight of the vegetable item, also measured in grams. Hence, plate waste was measured on a standardized basis (percentage).
Research assistants affixed coded data tags to eligible student lunch trays after the selection of vegetables in the cafeteria line. Lunch trays were included in the study if the student (i) participated in the NSLP on the day of the data collection; (ii) chose at least one vegetable serving that was sampled on the day of collection; and (iii) returned their tray with the data collection tag to a field worker after the lunch period. In each school district, roughly one of every two school lunches served was sampled.
Data tags identified the vegetables selected as well as student gender and grade. Students received a small incentive—such as a sticker, pencil, or eraser—if their tray and data tag were returned after the lunch period. Plate waste stations were located in the cafeteria to collect the sampled vegetables. Plate waste was collected from each eligible tray, while all other tray contents were discarded. The method was repeated for each lunch period to determine plate waste differences by grade and lunch period. Three trial runs were conducted to familiarize each research assistant with the movement of students through the cafeteria and the mechanics of labeling trays, obtaining samples, and collecting and weighing plate waste.
All plate waste was separated in a labeled and dedicated trash container lined with a plastic bag for each specific item at each given lunch period. Aggregated plate waste for each item was recorded and divided by the number of children that selected the item. In addition, the waste was segregated according to grade level within each of the participating schools. In sum, aggregate plate waste was measured for each vegetable by elementary school and by grade level using a Denver Instrument food balance with maximum capacity of 5,000 g. Percentage plate waste was calculated as follows:
(1) % plate waste = [(aggregate vegetable plate waste for each vegetable/total number of children selecting the vegetable)/weight of the mean serving size for each vegetable] * 100
Calculating plate waste as a percentage allows for comparisons among types of vegetables as well as for comparisons by elementary school and by grade.
Additionally, the respective school districts provided the following public information essential for our analysis: (i) district food costs (excluding labor costs) per menu item and per serving; (ii) school lunch production sheets for the days of plate waste collection that include the number of servings per item served and nutrient information; and (iii) meal counts (free, reduced, paid, and “other” meals served on days of plate waste collection. Information was recorded on the particular school, grade, type of vegetable, number of students consuming particular vegetables, the vegetable preweight, the vegetable plate waste in terms of percentage, the total number of students (male and female) who bought or received a school lunch, the total number of lunches served, the number of free lunches served, the number of reduced lunches served, and the number of paid lunches.
This study adds to the existing literature by providing plate waste measurements for various types of vegetables collected from representative elementary schools from two independent districts of Texas. No previous study has focused on the detail of the plate waste of different types of vegetables.
The respective vegetables in school lunches fell into seven categories:
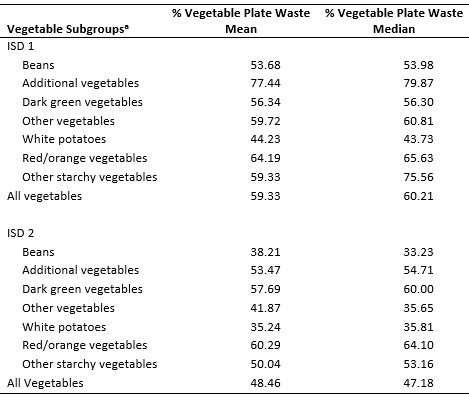
Note: a Test for equality of means; Welch F-statistic 12.20, p-value 0.0000.
Test for equality of medians; Kruskal-Wallis statistic 80.34, p-value 0.0000.
Source: Computations by the authors using EVIEWS 9.5. The level of
significance chosen for all statistical tests was 0.05.
Table 1 reports average plate waste for vegetables in ISD 1 and in ISD 2. On average, plate waste for vegetables was 59.3% in ISD 1 and 48.5% in ISD 2. Based on statistical tests of equality of means and medians, statistically significant differences were evident for vegetable plate waste by vegetable subgroups. Plate waste for vegetables was significantly higher for ISD 1 than for ISD 2. This finding is attributed to differences in regions of Texas, differences in race/ethnicity of the respective student populations, and differences in the percentages of free lunches across the respective schools. The Welch (1951) F-test was chosen to test the equality of means due to the fact that this statistic takes into account unequal variances. The nonparametric Kruskal–Wallis (1952) test was chosen to test the equality of medians.
As measured by the median number of students who selected various vegetables, white potatoes in various forms were the most popular vegetables. On average, plate waste was lowest for white potatoes and beans in both districts and highest for red/orange vegetables. In both districts, significant differences were not evident in mean vegetable plate waste by grade.
Increasing vegetable consumption of children has been a challenge for decades. Reger, O’Neil, and Nicklas (1996) showed that vegetable plate waste, excluding potatoes, was 54% among children in a low-socioeconomic elementary school in southern Louisiana; potato plate waste was 37%. Our study revealed similar results. Our study, like others, shows that vegetable waste remains a notable problem for schools, despite new USDA regulations requiring schools to offer students a greater variety of vegetables. Plate waste of most vegetables was high and similar to that shown in other studies (Adams et al., 2005; Cohen et al., 2014; Cohen et al., 2016; Byker, Farris, and Marcenellel, 2014; Gase et al., 2014; Handforth et al., 2016; Ishdorj et al., 2015; Niaki et al., 2017; Schwartz et al., 2015).
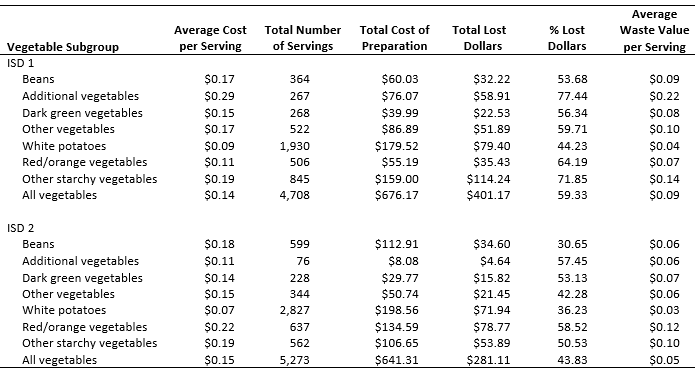
We turn attention to the consequences associated with plate waste for vegetables. Specifically, in this study, our interest centers on lost or wasted dollars per serving of vegetables and the percentage of dollars lost or wasted, and the total amount of lost dollars for vegetables. As exhibited in Table 2, the average waste value per serving on all vegetables in ISD 1 was slightly more than $0.08, and the average waste value per serving was slightly more than $0.05 per serving. In ISD 1, the average waste value per serving of vegetables ranged from $0.0411 (white potatoes) to $0.2206 (additional vegetables). In ISD 2, the average waste value per serving ranged from $0.0254 (white potatoes) to $0.1237 (red/orange vegetables). Notable differences in the lost or wasted dollars were evident across the respective vegetable subgroups for ISD 1 and ISD 2.
As exhibited in Table 2, for the respective vegetable subgroups across the two school districts, average waste costs per serving were lower for ISD 2 than for ISD 1, except for red/orange vegetables. For each school district, white potatoes had the lowest average waste value per serving among the respective vegetable subgroups.
Results from our study suggested that there were nonnegligible costs associated with vegetable plate waste. The variation in plate waste by vegetable type was considerable. Plate waste was lowest for white potatoes compared to plate waste for other starchy vegetables and for nonstarchy vegetables. White potatoes were the most popular vegetables, and they were wasted the least, resulting in cost savings. In addition, white potatoes are relatively inexpensive compared to other vegetables. Indeed, schools serve a variety of vegetables because of their nutritional content. But when vegetables are wasted, schools lose money; we found that 44%–59% of the total value of vegetable preparation (exclusive of labor costs) was wasted. On average, the lost dollars per serving of potatoes was less than $0.04 compared to $0.06–$0.09 for beans, $0.07–$0.09 for dark green vegetables, and $0.07–$0.12 for red/orange vegetables. On average, the percentage of lost dollars for white potatoes was 35%–44%, compared to 31%–54% for beans, 53%–56% for dark green vegetables, and 58%–64% for red/orange vegetables. As such, we find evidence of a tradeoff between nutritional content and the dollar value associated with waste of vegetables.
Actual dollars lost due to vegetable plate waste averaged $9.37 per day per school in ISD 2 and $20.06 per day per school in ISD 1. If we assume a 180-day school calendar, then actual dollars lost attributed to vegetable plate waste alone amounted to $1,687 per school in ISD 2 and $3,610 per school in ISD 1.
Our findings are limited to the six schools from the two independent Texas school districts that participated in the study; therefore, the results may not apply to other regions of the state or other regions of the country. We did not control food menu decisions or vegetable selection, and we did not influence the vegetable choices of children participating on collection days. The schools had control over the menus and foods served as well as any competitive foods served. Purchase of à la carte foods such as ice cream and popsicles may have reduced hunger, leading to decreased consumption of vegetables, especially among older children.
The information gleaned from our study is useful to policy makers, food service professionals, and perhaps other federal, state, or local program staff in addressing the overarching question of how to encourage children who attend elementary schools to eat more diverse and nutritionally beneficial vegetables, while still staying within a reasonable budget. In any research scenario, where it is found that food items are being wasted, particularly those designated as healthy, strategies must be developed and implemented to increase consumption. These strategies could include conducting taste tests, providing nutrition education, and implementing health promotion interventions. Alternatively, the availability of “offer versus serve” (OVS) in school cafeterias makes it possible for schools to save on the preparation of various vegetables. When the OVS policy is in place, students are only required to take a fruit or a vegetable.
The results from this research suggest that plate waste of vegetables differs due to geographic location and diversity of sociodemographic composition of student populations. Importantly, our research efforts have the potential not only to be conducted on a larger scale but also to be implemented at relatively low cost. In essence, this work served as a pilot study. Future research should center on replicating this project in other areas of Texas and elsewhere around the country. In addition, research centered on establishing factors linked to vegetable plate waste as well as the financial and nutritional implications associated with plate waste is needed.
Adams, M.A., R.L. Pelletier, M.M. Zive, and J.F. Sallis. 2005. “Salad Bars and Fruit and Vegetable Consumption in Elementary Schools: A Plate Waste Study.” Journal of the American Dietetic Association 105: 1789–1792.
Buzby, J.C, and J.F. Guthrie. 2002. Plate Waste in School Nutrition Programs: Final Report to Congress. Washington, DC: U.S. Department of Agriculture, Economic Research Service, Food Assistance and Nutrition Research Program E-FAN-02-009, March.
Byker, C.J., A.R. Farris, and M. Marcenellel. 2014. “Food Waste in a School Nutrition Program after Implementation of New Lunch Program Guidelines.” Journal of Nutrition Education and Behavior 46(5): 406–411.
Chu, Y.L., C.A. Warren, C.E. Sceets, P. Murano, L. Marquart, and M. Reicks. 2001. “Acceptance of Two U.S. Department of Agriculture Commodity Whole-Grain Products: A School-Based Study in Minnesota.” Journal of the American Dietetic Association 111(9): 1380–1384.
Cohen, J.F.W., J.L. Jahn, S. Richardson, S.A. Cluggish, E. Parker, and E.B. Rimm. 2016. “Amount of Time to Eat Lunch Is Associated with Children's Selection and Consumption of School Meal Entree, Fruits, Vegetables, and Milk.” Journal of the Academy of Nutrition and Dietetics 116(1): 123–128.
Cohen, J.F.W., S. Richardson, S.B. Austin, C.D. Economos, and E.B. Rimm. 2013. “School Lunch Waste among Middle School Students: Nutrients Consumed and Costs.” American Journal of Preventive Medicine 44(2): 114–121.
Cohen, J.F.W., S. Richardson, and E. Parker. 2014. “Impact of the New U.S. Department of Agriculture School Meal Standards on Food Selection, Consumption, and Waste.” American Journal of Preventative Medicine 46(4): 388–394.
Comstock, E.M., R.G. St. Pierre, and Y.D. Mackiernan. 1981. “Measuring Individual Plate Waste in School Lunches: Visual Estimations and Children’s Ratings vs. Actual Weighing of Plate Waste.” Journal of the American Dietetic Association 79(3): 290–296.
EVIEWS. Irvine, CA: IHS Global Inc. Available online: www.eviews.com.
Gase, L.N., W.J. McCarthy, B. Robles, and T. Kuo. 2014. “Student Receptivity to New School Meal Offerings: Assessing Fruit and Vegetable Waste among Middle School Students in the Los Angeles Unified School District.” Preventative Medicine 67: S28–S33.
Glueson, J., A.V. Shankarm, R.P. Pokhrel, and K.P. West Jr. 1994. “Accuracy of Estimating Food Intake by Observation.” Journal of the American Dietetic Association 94(11): 1273–1277.
Gunders, D., J. Bloom, J. Berkenkamp, D. Hoover, A. Spacht, and M. Mourad. 2017. Wasted: How America Is Losing Up to 40 Percent of Its Food from Farm to Fork to Landfill. Natural Resources Defense Council Report R:17-05-A.
Handforth, K.M., M.B. Gilboy, J. Harris, and N. Melia. 2016. “Fruit and Vegetable Plate Waste among Students in a Suburban School District Participating in the National School Lunch Program.” Journal of Child Nutrition and Management 40(1).
Ishdorj, A, O. Capps Jr., M. Storey, and P.S. Murano. 2015. “Investigating the Relationship between Food Pairings and Plate Waste from Elementary School Lunches.” Journal of Food Nutrition Services 6: 1029–1044.
Kropp, J. D., S. J. Abarca-Orozco, G. D. Israel, D. C. Diehl, S. Galindo-Gonzalez, L. B. Headrick, and K. P. Shelnutt. 2018. “A Plate Waste Evaluation of the Farm to School Program.” Journal of Nutrition Education and Behavior 50(4): 332–339.
Kruskal, W., and W.A. Wallis. 1952. “Use of Ranks in One-Criterion Variance Analysis.” Journal of the American Statistical Association 47: 583–621.
Martin, C.K., R.L. Newton Jr., S.D. Anton, H.R. Allen, A. Alfonso, H. Han, T. Stewart, M. Sothern, and D.A. Williamson. 2007. “Measurement of Children’s Food Intake with Digital Photography and the Effects of Second Servings upon Food Intake.” Eating Behaviors 8(2): 148–156.
Marlette, M.A., S.B. Templeton, and M. Panemangalore. 2005. “Food Type, Food Preparation, and Competitive Food Purchases Impact School Lunch Plate Waste by Sixth Grade Students.” Journal of American Dietetic Association 105: 1779–1782.
Niaki, S.F., C.E. Moore, T.A. Chen, and K.W. Cullen. 2017. “Younger Elementary School Students Waste More School Lunch Foods Than Older Elementary School Students.” Journal of the Academy of Nutrition and Dietetics 117(1): 95–101.
Parent, M., H. Niezgoda, H.H. Keller, L.W. Chambers, and S. Daly. 2012. “Comparison of Visual Estimation Methods for Regular and Modified Textures: Real-Time vs Digital Imaging.” Journal of the Academy of Nutrition & Dietetics 112(10): 1636–1641.
ReFED. 2016. A Roadmap to Reduce US Food Waste by 20 Percent. Available online: www.refed.com.
Reger, C., C.E. O’Neil, and T.A. Nicklas. 1996. “Plate Waste of School Lunches Served to Children in a Low-Socioeconomic Elementary School in Southern Louisiana.” School Food Service Research Review 20: 13–19.
Schwartz, M.B., K.E. Henderson, M. Read, N. Danna, and J.R. Ickovics. 2015. “New School Meal Regulations Increase Fruit Consumption and Do Not Increase Total Plate Waste.” Childhood Obesity (Print) 11(3): 242–247.
Taylor, J.C., B.A. Yon, and R.K. Johnson. 2014. “Reliability and Validity of Digital Imaging as a Measure of School Children’s Fruit and Vegetable Consumption.” Journal of the Academy of Nutrition Dietetics 114(9): 1359–1366.
U.S. Department of Agriculture. 2002. Federal Register. Economic Research Service 77(17), 4088–4167.
Welch, B.L. 1951. “On the Comparison of Several Mean Values: An Alternative Approach.” Biometrika 38: 330–336.
Williamson, D.A., H.R. Allen, P.D. Martin, A.J. Alfonso, B. Gerald, and A. Hunt. 2003. “Comparison of Digital Photography to Weighed and Visual Estimation of Portion Sizes.” Journal of the American Dietetic Association 103(9): 1139–1145.

