The pollination of almonds in February and March attracts more than two million honey bee hives to California each year (Champetier and Sumner, 2019). Almond pollination fees—the price for the rental of a hive for the duration of the bloom—depend on the marginal cost of supplying the hives and the demand for pollination services as an input to almond production. Observed pollination fees and hive rental numbers reflect the shapes and positions of the supply and demand of pollination services in late winter. This article focuses on the supply side of pollination services and discusses important drivers that affect the supply of pollination services. We argue that the availability of forage in the entire United States may become a limiting factor in the further expansion of pollination services to almonds. While other inputs—such as labor, equipment, and feed—can be provided to the beekeeping industry at nearly constant costs per unit, bee forage from crops and natural landscapes is a limited resource. We review the role and importance of forage in the economics of beekeeping and consider whether the quantity of honey bee pollination services to almonds can continue to expand and, if so, at what price.
The demand for almond pollination services can be represented by an inelastic demand curve (i.e., with a quantity demanded not responding much to price changes) that has been shifting right (out) by around 5% per year (Champetier and Sumner, 2019). As we discuss in our companion article in this issue of Choices, the demand for pollination services is inelastic because all but a few, still minor, almond varieties strictly depend on insect pollination. This demand is largely satisfied by hired honey bees. Given sustained growth in almond acreage, further expansion in the demand for bees for almond pollination is likely on the horizon.
Our discussion of the supply side of the pollination and honey markets must begin with a few observations that are well-known to specialists but sometimes misunderstood more broadly:
Improved data collection by the U.S. Department of Agriculture National Agricultural Statistics Service, the Bee Informed Partnership, and others, are contributing to a more detailed and accurate picture of the commercial beekeeping industry. In this article, we use some of these data as well as information we collected from beekeepers to characterize the costs and supply conditions of commercial beekeepers that supply pollination services to almonds.
Recent data show that pollination fees for almonds have changed little in real terms for more than a decade (Ferrier et al., 2018). Improvements in hive quality and the expansion of pollination contract features that monitor hive quality reinforce the observation that there has been little if any increase in cost of pollination services since 2006 or 2007 (Lee, Sumner, and Champetier, 2019). This relative stability of the cost of pollination in the face of rapidly growing almond acreage is consistent with a very elastic long-run pollination supply curve (Champetier and Sumner, 2019; Ferrier et al., 2018). Whether the beekeeping industry will be able to supply increasing numbers of hives for almond pollination without large increases in pollination fees in the coming decade (an elastic supply response) is critical for both the almond and beekeeping industries as well as consumers of almonds and honey and those who like the idea of more honey bees in general.
Recent data gathered from a representative group of California beekeepers who participate in almond pollination documents costs by category for beekeeping operations (Champetier and Sumner, 2019). Most major inputs for beekeeping are not specialized and other inputs, such as queens, hive boxes, and frames, can be readily expanded as well (see Figure 1). These conditions for beekeeping inputs suggest that pollination services may expand with relatively modest increase in marginal costs in these categories. However, two additional and important factors to supply expansion must be considered.
First, the availability of bee forage provided by crops and other vegetated landscapes may limit expansion in the number of hives available for late winter pollination (Champetier, Sumner, and Wilen, 2015). Forage inventory based on the ecological notion of carrying capacity may be helpful in quantifying these limits. Hellerstein et al. (2017) provide a first estimate of such forage suitability for the entire continental United States and find indications of possible declines in forage availability from 2002 to 2012. Such accounting must be updated and refined. Climate change also has the potential to increase or decrease availability and costs of honey bee forage.
Second, potential increases in forgone income from honey production could increase the opportunity costs of supplying hives to almond pollination, if forage is limited and a trade-off exists between these two revenue sources (Rucker, Thurman, and Burgett, 2012).
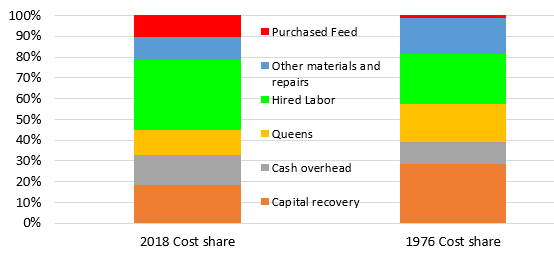
Source: From data in Champetier and Sumner (2019), based
on University of California Cost and Returns Studies.
Figure 1 compares recently collected beekeeper cost information (2018) to costs of a comparable operation four decades earlier (1976). In both years, the costs apply to a moderate-sized (1,000 hives) California beekeeping operation that received revenue from both pollination services and sales of honey into the wholesale market (Champetier and Sumner, 2019). California had about 0.5 million hives in 1976. In 2018, USDA data report that California had about 0.34 million “honey-producing” hives, but other USDA data report that, over the course of the year, the total number of hives in California, including those usually based elsewhere, ranged from about 1.5 million hives in the late winter to about 0.6 million hives in early summer.
Figure 1 shows that fixed costs, defined as annualized capital costs plus cash overhead, were about one-third of costs in 2018 but close to 40% in 1976. Annualized capital costs alone were about 30% of costs in 1976, in part due to high interest rates that year relative to 2018. Costs for queen replacement were also a higher share of total costs in 1976 (about 18% compared to 12% in 2018). Hired labor costs, which were not quite one-quarter of costs in 1976, grew to more than one-third of costs by 2018. The costs in equipment repairs and materials (including pest control costs) were about 18% in 1976 and 11% in 2018. Overall, the most informative difference is that the cost of purchased feed for bees has risen from almost nothing (1%) in 1976 to 10% of costs in 2018. Note that management is not listed as a separate cost category, because net returns to the operation are considered the compensation of the manager for the 1,000-colony firm.
Two reasons account for high use of purchased feed recently. First, bees need to be aroused earlier from hibernation when little natural forage is available to get them ready for almonds early in the winter. Second, after almond pollination is completed, there is intense competition for forage locations among the massive number of hives in California. Almond blossoms provide excellent bee nutrition but only last three to six weeks. Before and after the almond bloom, beekeepers have two options: Find a source of forage from flowering plants from which bees can make their own nutrition (basically pollen and a healthy nectar that they consume within the hive) or feed a cheap and less nutritious substitute mostly made from sugar and plant proteins. In some circumstances, the need to feed bees can be reduced by holding the hives in cold storage before the almond season, during which time they will shut down most activity and essentially hibernate.
Natural forage is an important input for most honey bee operations but does not appear as a distinct category in the list of input costs in Figure 1 because, even with forage becoming more scarce, relatively few beekeepers pay an explicit rental fee to put their bees on pastures or in a crop field. The costs show up in budgets as added labor, capital, and materials used for moving bees.
Forage availability in most places is highly seasonal and depends on the flowering timing of plants. For example, natural habitats in California are dry in the summer and few flowers are in bloom. In places such as North Dakota, adequate spring and summer rainfall make pastures and extensive crops such as rapeseed or clover excellent summer forage. In contrast, winter in California may see early blooms, whereas North Dakota is months away from supplying any forage for honey bees.
Supply of pollination services cannot be expanded much in the very short run. In a period of only a few weeks, there is little a beekeeper can do to expand the number of hives and pollination services they provide. For example, consider a beekeeper that has contracted to deliver 1,200 hives for almond pollination on February 1. If that beekeeper found on January 1 that its hives had suffered unusually high winter losses and therefore the beekeeper only had 1,000 suitable hives, it could not create new active hives by applying more labor or feed inputs. The beekeeper would need to get hives from another operation or fail to deliver on its contractual obligations and suffer the consequences. If many beekeepers had the same problem in the same year, the search for new hives to meet contracted numbers would become more expansive and more expensive. During more favorable periods of the year, such as late spring and early summer, one colony can be split into two, providing beekeepers with a method to replace lost colonies or expand their operation. However, even split hives are not immediately productive for pollination or commercial honey and require a month or two before becoming fully productive units (Oliver, 2018).
Over a horizon of a year or more, most beekeeping inputs that are also used outside the bee keeping industry—such as general materials, general equipment, and labor—can be readily expanded. Similar to other livestock industries, the supply of some more specialized inputs, such as new queens and building new hive boxes and frames, can also be expanded, although it may require more time and may only be possible during certain periods of the year. The specialized services of beekeeping managers and technical specialists may also be attracted and trained within a few years.
In contrast, natural forage can be a limiting factor for the beekeeping industry. As noted, several of the cost items in Figure 1 reflect the costs of accessing forage and the consequences of using the less healthy feeding alternative. These include costs of trucks, fuel, and hired labor for moving bees from place to place as forage becomes exhausted in each location. Moreover, one of the consequences of too much feeding of sugar and protein substitutes rather than natural forage is hives that are less healthy and therefore require costly replacement of dead or dying colonies.
Long-distance migration is an important strategy used by beekeepers to overcome forage scarcity. The most visible outcome of this strategy is the increasing number of hives moved to the large forage sources in the Dakotas in spring and summer (Goodrich, Williams, and Goodhue, 2019). As colony density in the best forage locations increases, however, beekeepers report that they seek other locations such as forests and other vegetated landscapes that provide some forage. Beekeepers adjust hive density to the perceived size and quality of forage resources, accounting for weather conditions. Potential hazards to bees, in the form of predators, parasites, and the possibility of pesticide exposure, can reduce the suitability of otherwise healthy forage. Hellerstein, et al. (2017) provide the only available forage inventory for the continental United States and develop a forage suitability index that accounts for forage nutrition value and pesticide exposure. The study finds that after an increase from 1982 to 2002, the index declined slightly from 2002 to 2012 across the nation, with a more pronounced decline in the Dakotas. Aside from the need for an update, additional forage inventory efforts would help anticipate the potential impact of forage scarcity on the beekeeping industry. Champetier and Sumner (2019) further discuss how beekeepers have responded to scarcity of forage, but much more research is needed to assess where forage might be most available and how much marginal cost may rise as more hives access new forage locations. Better understanding of bee nutrition and health may allow innovations in increasing bee benefits from each acre of forage and in economizing on costs of improving honey bee hive health.
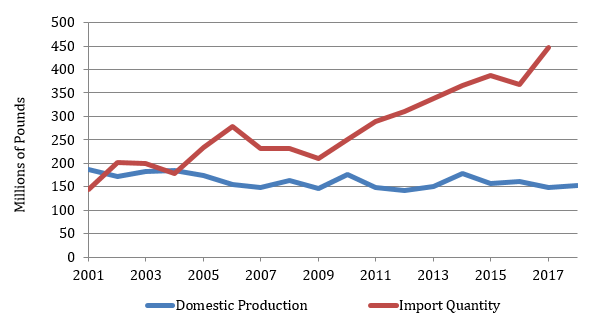
Source: U.S. Department of Agriculture (1999–2018) and
U.S. International Trade Commission.
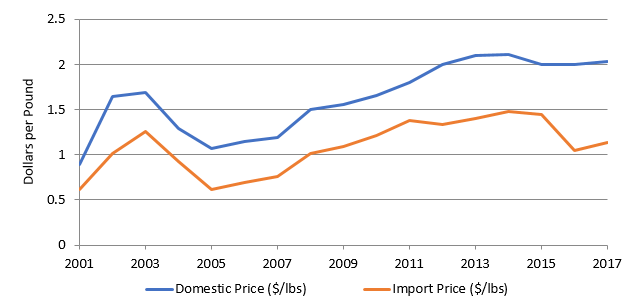
Source: U.S. Department of Agriculture (1999–2018), and
U.S. International Trade Commission, and GDP deflator
World Bank.
Source: U.S. Department of Agriculture (1999–2018).
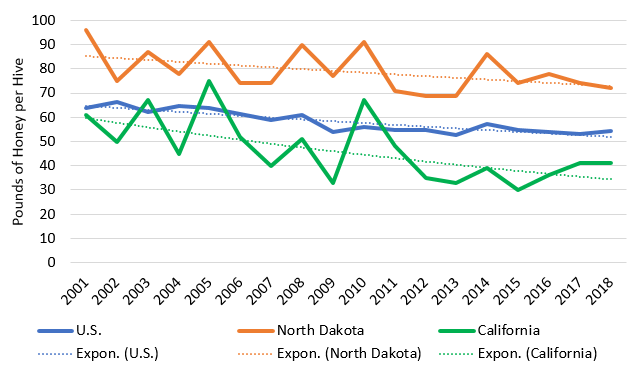
Source: U.S. Department of Agriculture (1999–2018).
Note: Dotted lines are linear trends.
The relationship between honey market conditions and supply of pollination services is complex because of seasonality in forage and bee numbers and the trade-off between extracting and selling honey versus allowing the hive to consume honey that could otherwise be sold. For a given amount of forage, the more a beekeeper focuses on preparing healthy, well-nourished hives for almond-pollinating season, the less honey can be extracted for sale. In this section, we review data on honey production to assess the role that this trade-off may have played in shaping the response of the beekeeping industry to changes in demands for honey and pollination. Let us first characterize the demand for honey facing the U.S. beekeeping industry.
U.S. honey consumption has increased rapidly over the last two decades, but this growth has been for imported honey only. Figure 2 shows U.S. production and imports of honey for 2001–2018. Domestic honey production (and consumption of domestic honey, since exports are almost 0) has fallen by 18% since 2001, whereas honey import quantity has almost tripled. The difference in trends between imported and domestic honey consumption is explained by a difference in price. Figure 3 shows that the price of domestic honey has remained much higher than imported honey and the price premium has grown recently as total honey consumption has continued to rise. This price differential suggests a clear difference in the characteristics of domestic and imported honey. However, the consonant movement in prices over time (with the exception of 2016 and 2017) indicates that the markets have been well integrated with substitution at the margin.
The real price of domestic honey has doubled since 2001. Domestic honey revenue has grown substantially based on higher prices for smaller quantities. The price and quantity changes for U.S.-produced honey are consistent with a relatively stable and inelastic demand for domestic honey and a shift up in the marginal cost of production of domestic honey. While total demand for honey is shifting out, most of the shift may be concentrated in the lower market segment, where imports are competitive.
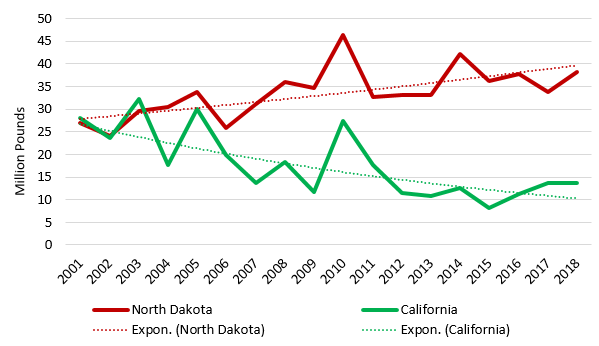
Now let us turn to the evolution of honey production since 2001. Figure 4 shows the average honey production per hive each year in the United States as a whole and in North Dakota and California, the states with the most honey-producing hives. The U.S. honey yield per hive has clearly declined over time. North Dakota honey production per hive has fallen gradually, from over 80 pounds per hive in 2001 to about 70 pounds per hive in 2018. Honey per hive in California fell from more than 60 pounds to less than 40 pounds during the 2012–2016 drought before climbing to 41 pounds per hive in 2018.
The number of honey-producing hives in North Dakota has grown by enough that total honey production has risen, even though honey per hive has fallen (Figure 5). Indeed, more hives competing for the same or less forage is one cause of lower honey production per hive. The expansion of hives that migrate to North Dakota after pollinating almonds is consistent with the observed declines in honey per hive there, even though the available forage is used to produce more honey in total. The trend has been different in California, where the number of hives producing honey has declined along with honey per hive, so total honey production has fallen faster (about 5.6% per year) than has honey per hive (about 3.2% per year). In both states, the pattern of honey production per hive is consistent with less available forage for honey production and illustrates how the forage trade-off between honey and pollination shapes the supply responses of the beekeeping industry. While the effect of this trade-off may have been moderate so far, several factors could increase its importance in the future.
One scenario to consider for its implications for supply of almond pollination services is a substantial shift out in demand for domestic honey, say because of positive health information or negative information about quality or safety of imported honey. A higher price for domestic honey would increase the opportunity cost of feed needed within the hive to maintain large populations of healthy bees for almond pollination in late winter. The honey price increase, or equivalent demand shift, would need to be large, as almond pollination is a large source of revenue, equivalent to selling 90 pounds of honey per hive (assuming, for example, an almond pollination fee of $180 per hive and a price of honey of around $2 per pound). It requires a lot of marketable honey, more than average production per hive in all major honey states, to offset a loss of almond pollination revenue.
While this first-order effect is straightforward, there are offsetting factors. Almonds supply additional forage to hives that can then turn to production of marketable honey during the rest of the year. Without almonds, many more hives would be left dormant later into spring and thus start the productive honey season later and with smaller bee populations. If sufficient forage is available in the post-almond seasons, the nutrition provided during almond pollination likely contributes to lower the marginal costs of honey production (Lee, Sumner and Champetier, 2019).
Forage availability is the significant potential limiting factor that could cause almond pollination fees to rise substantially as demand expands. In the past decade, fees have risen only slightly as more locations are drawn into honey bee forage supply. But it remains unclear how much more forage is available and what beekeepers may do to find it.
Honey demand is another unknown that affects pollination supply. At this stage, the data do not support the hypothesis that honey demand is a major factor in almond pollination supply. However, the research question remains: Would a large increase in the demand for domestic honey shift enough hives away from almond pollination in situations where access to natural forage for honey production is limited, such that the cost of pollination would rise?
Other factors could increase the prominence of the honey–pollination trade-off stemming from forage limitations. Changes in cropping and pesticide patterns, climate change, and pest pressures may contribute to shrinking available forage (Hellerstein et al. 2017). The net effect of such changes will depend on seasonality, while pest and disease pressures on bee health have the potential to increase the benefits of natural forage relative to sugar and other feed.
Beekeepers may find opportunities to improve forage availability. As foraging needs and patterns become better understood, we may see the adoption of more developed bee forage property rights and markets with consequent efficiencies. The rapid increase in almond pollination demand has also created incentives for innovation in feed and pest management offering the prospect of improvements in bee health at lower costs. As in other parts of agriculture, innovation may be the driving force in the evolution of beekeeping economics.
Champetier, A., and D.A. Sumner. 2019. “Marginal Costs and Likely Supply Elasticities for Pollination and Honey.” American Journal of Agricultural Economic 101(5): 1373–1385.
Champetier, A., and D.A. Sumner. 2019. “Economics of the Supply Functions for Pollination and Honey: Marginal Costs and Supply Elasticity.” American Journal of Agricultural Economics, forthcoming.
Champetier, A., D.A. Sumner, and J.E. Wilen. 2015. “The Bioeconomics of Honey Bees and Pollination.” Environmental and Resource Economics 60(1): 143–164.
Ferrier, P. M., R.R. Rucker, W.N. Thurman, and M. Burgett. 2018. “Economic Effects and Responses to Changes in Honey Bee Health.” Washington, DC, U.S. Department of Agriculture, Economic Research Service, Economic Research Report, ERR-246, March.
Goodrich, B.K., J.C. Williams, and R.E. Goodhue, 2019. “The Great Bee Migration: Supply Analysis of Honey Bee Colony Shipments into California for Almond Pollination Services.” American Journal of Agricultural Economics 101(5): 1353–1372.
Hellerstein, D., C. Hitaj, D. Smith, and A. Davis. 2017. Land Use, Land Cover, and Pollinator Health: A Review and Trend Analysis. Washington, DC: U.S. Department of Agriculture, Economic Research Service, Economic Research Report ERR-232, June.
Lee, H., D.A. Sumner, and A. Champetier. 2019. “Pollination Markets and the Coupled Futures of Almonds and Honey Bees: Simulating Impacts of Shifts in Demands and Costs.” American Journal of Agricultural Economics 101(1): 230–249.
Oliver, R. 2018. “Modeling Nuc Buildup.” American Bee Journal June: 647–654.
Rucker, R.R., W.N. Thurman, and M. Burgett. 2012. “Honey Bee Pollination Markets and the Internalization of Reciprocal Benefits.” American Journal of Agricultural Economics 94(4): 956–977.
U.S. Department of Agriculture. 1999–2018. Honey Bee Surveys and Reports. Washington, DC: U.S. Department of Agriculture, National Agricultural Statistics Service. Available online: https://www.nass.usda.gov/Surveys/Guide_to_NASS_Surveys/Bee_and_Honey/
U.S. International Trade Commission. 2018. Dataweb Online Database. Available online: https://dataweb.usitc.gov/.
World Bank. 2019. “GDP Deflator (base year varies by country).” World Bank National Accounts Data, and OECD National Accounts Data Files. World Bank Group. Available online: https://data.worldbank.org/indicator/NY.GDP.DEFL.ZS?locations=US [Accessed 18 Aug. 2019].

