U.S. dairy farmers are into the fourth year of relatively low milk prices. Competition for export markets with the European Union (EU) is partly to blame. Milk supplies in the EU have expanded since 2015, when production quotas were dropped. More recently, concerns over retaliatory tariffs from Mexico and China, our first and third largest customers for dairy exports, have contributed to continued price pressure. Changes in U.S. regional milk supplies, demand for dairy products, and processing capacity have compounded the cyclical nature of farm milk prices.
In 2016, the top five milk-producing states were California, Wisconsin, New York, Idaho, and Michigan. Since 2014, California has lost 2.5 billion pounds of milk production and Wisconsin has gained 2.5 billion pounds. Idaho is up by about 750 million pounds, but New York is up even more, at 1.2 billion pounds, and Michigan is up 1.6 billion pounds. Gains in the Great Lakes states have more than offset losses in the West.
Michigan has doubled its milk production since 2000. The state has unique features, including an almost ideal climate for the modern high-producing dairy cow. Evidence of this is that Michigan has the highest productivity of any state, with milk per cow yields of more than 26,000 lbs/year. But the growth in milk production has not been accompanied by growth in the capacity of plants to process that milk. And the peninsular geography of the state has meant that milk must travel long distances around the Great Lakes to find a processing home. Wisconsin, which has also had plentiful milk supplies, has received much of the excess Michigan production.
More milk in the Great Lakes states has consequences. For example, Michigan’s all milk price, which was almost equal to the U.S. average in 2014, had fallen to the lowest in the nation in 2017. We use a spatial model of the U.S. dairy industry to help understand how changes in the spatial distribution of milk production have affected the relative value of milk in different regions.
The U.S. Dairy Sector Simulator (USDSS) is a highly detailed mathematical spatial optimization model that at its core solves a fairly practical problem: how to i) get milk from dairy farms to plants to be processed into various dairy products and ii) distribute those products to consumers in the most efficient way possible (see Nicholson et al., 2015). The model takes the total milk supply, plant locations, product mix, and product demand as they existed for a given month. The solution indicates how best to move that farm milk to plants via the existing road network, process milk into final and intermediate products, and distribute the finished products to consumers.
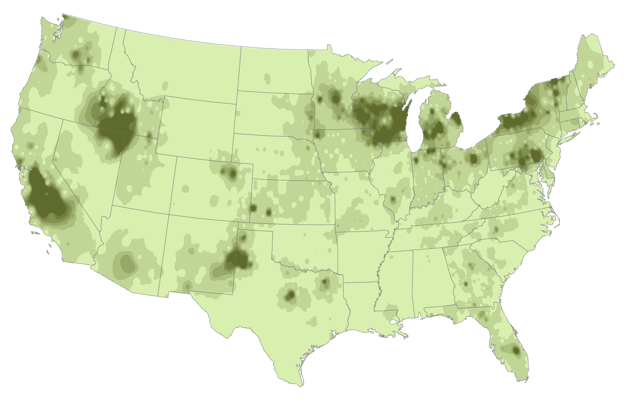
Source: USDA-NASS, AMS, 2017.
The USDSS has significant data needs, including the amounts and composition of farm milk and dairy products consumed, disaggregated by U.S. regions and accounting for imports and exports. To represent the U.S. milk supply, we use county estimates of milk production and composition where possible (as in California and Wisconsin). Where those data are not available, we use state values and estimate county-level milk production using Agricultural Census and Federal Milk Marketing Order (FMMO) data. Figure 1 shows the density of milk production in the 48 contiguous states. Milk supplies are represented by 231 supply points.
The USDSS model is comprehensive and includes all sources and uses of milk and dairy components in the United States. The current structure includes 19 final and 18 intermediate product categories—such as cream, condensed skim milk, nonfat dry milk—which can be used in the further manufacture of other final dairy products such as cheese or ice cream. Final products include fluid milk, yogurt, and cheese, which satisfy domestic consumption (by individuals, food service, and other food manufacturers) or export sales. Dairy products have different component requirements, and some product component values differ by region For example, California’s lower-fat fluid milk is fortified with skim milk solids per state regulations.
A variety of data sources are used to determine per capita demand for dairy products. The U.S. Department of Agriculture Economic Research Service (ERS) reports calculations for some dairy product demands, and other values—such as “route dispositions,” delivery to retail or wholesale outlets—are determined from FMMO reports. County-level demands are calculated based on per capita demand and population and then aggregated to 424 demand locations.
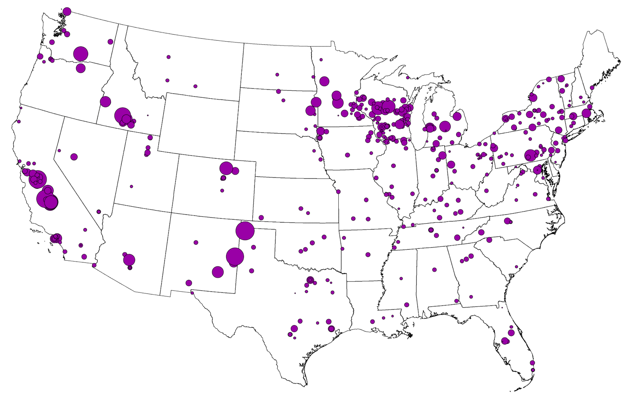
Source: Private Data, 2017.
We maintain an extensive database that includes 1,167 dairy plant locations and products processed in the United States. Of these plants, we have processing volume estimates for more than 500 of the most significant plants (Figure 2), which account for more than 95% of U.S. milk supply. As milk supply and demand locations are aggregated, so too are dairy plants, which are represented at 281 locations in the USDSS.
The USDSS tracks and accounts for multiple product components. Plant locations are constrained to process only the products that we know to be manufactured at those sites. For instance, a fluid milk plant location cannot process cheese. However, a fluid milk plant with excess butterfat can send cream to a butter churn, ice cream plant, or other manufacturing facility with need of the cream. Of course, sending cream from a fluid plant also sends nonfat solids to the receiving plant requiring, somewhat more raw milk than would be necessary to meet only fluid needs.
USDSS uses import and export information for 34 U.S. port districts. Imported and exported products exactly match those reported in the months modeled. Some dairy products are storable and this is accounted for in the model by observed changes in stocks during the months modeled.
A road network of actual road mileage connects all of the supply, demand, plant, and trade locations in the model. About 200,000 possible road routes connect the 628 USDSS locations. States also have differing gross vehicle weight (GVW) limits, which restrict the size of loads shipping raw milk or finished products that can be transferred between some states. These limits are also represented within the model. Most states have an 80,000 lb GVW limit, but others have GVW limits of up to 164,000 lbs. The most limiting state along a route becomes the GVW restriction in the USDSS. The ability to haul greater GVWs reduces the cost of transporting raw milk and products.
We calculate transportation costs for raw milk assembly, inter-plant movements of bulk products (cream, skim milk, condensed skim milk, etc.), and final products, both refrigerated and non-refrigerated, for all of the 200,000 possible routes. These transportation costs are updated to reflect changes in equipment, fuel, and labor costs for 2014 and 2016. The USDSS also reflects regional variations in fuel and labor costs, depending on the point of origin for a transportation movement. Transportation costs are an important driver of model outcomes, and as is other information, are calculated for each month for which the model is used.
Source: USDA-NASS, ERS, BLS, 2017.
The model’s purpose—referred to as the “primal solution”—is to find the least-cost combination of assembling milk from farms to plants, processing the final and intermediate dairy products, and distributing them to meet domestic and export demand while respecting the many constraints imposed. The primal solution describes the physical flows of product through the dairy supply chain.
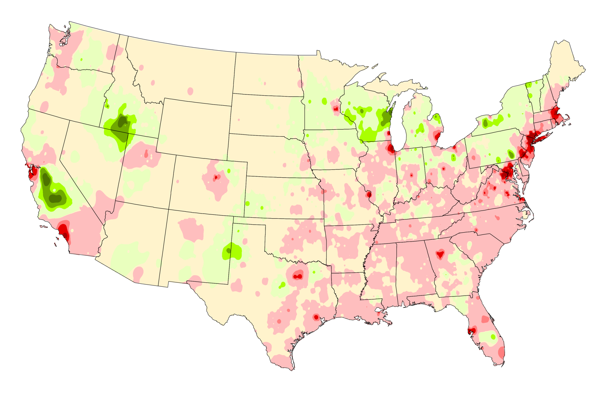
A simplified way of looking at the problem is to show the country’s regions of relative surplus and deficit. Figure 3 illustrates the difference between milk production and the demand for milk used in all dairy products at the county level. Shades of green represent regions of surplus, while red areas are deficit. Tan-colored spaces are relatively balanced.
Not surprisingly, the most milk-deficit regions of the United States are the heavily populated areas from Boston south to Washington, D.C., and between Los Angeles and San Francisco. The entire Southeast has a general deficit of milk. The Great Lakes states have regions of surplus, as do California and Idaho. The model, like the actual supply chain, must move milk from farms through plants and dairy products to consumers to meet all demands for final dairy products.
An optimization model also provides something known as the “dual solution,” which represents the relative monetary values of milk and dairy products at each model location. The primal (physical) and the dual (monetary) solutions are different ways of looking at the same outcome. In fact, the dual values are often called “shadow prices” because they reflect physical movements. The dual values let us measure how regional values of milk have changed over time.
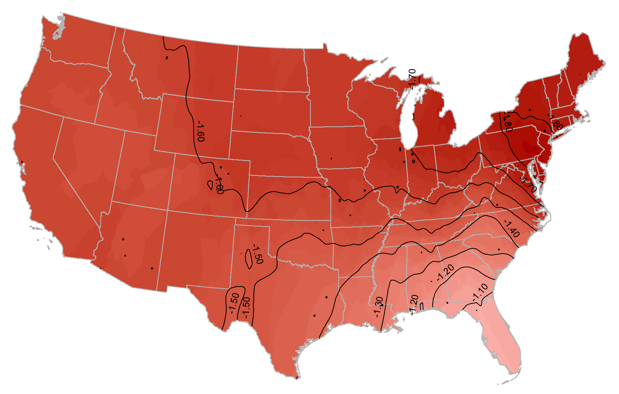
Source: Change in dual values at farm supply points
from USDSS Model simulations for March 2014 and
March 2016, 2018.

Source: Change in dual values at farm supply points for
March 2014 with 2014 transportation costs and 2016
transportation from USDSS model simulations, 2018.

Source: Change in dual values at farm supply points
based on difference between March 2014 with 2016
transportation costs and March 2016 values from
USDSS model simulations, 2018. NOTE: Includes
changes in both domestic and export demand.
Dairy trade had a large influence on world milk prices from 2014 to 2016. In, 2014, milk prices were very high as China purchased more dairy products than ever before and shorted world stocks of product. By 2016, the world had begun to respond to those demand signals and increased milk supplies, only to find China’s purchases retreating. But we can abstract from the world influences to focus on regional changes within the United States.
Figure 4 maps changes in regional farm milk values as calculated by the USDSS from March 2014 to March 2016. The Southeast, and particularly Florida, saw very little change in the farm value of milk, while an arc from Texas through the Northeast saw relatively larger declines in value. Even the Far West saw relatively smaller impacts on milk values during this 2-year period. To better understand why milk values changed (see Figure 4), we can partition the changes into the impacts of transportation costs and the impacts of supply and demand factors.
The transportation costs necessary to assemble and deliver products through a supply chain can be significant. For instance, it can cost about $0.10 to transport a pound of cheese from California to the Southeast, and this affects the relative value of farm milk across the country. From 2014 to 2016 however, the cost of freight declined, largely because fuel costs were lower and the average truck was modestly more fuel efficient.
Figure 5 shows that changes in transportation costs had varying effects across U.S. regions. In the Southeast, the lower costs of transportation of 2016 meant that it was less costly to bring milk and dairy products into the region than it had been in 2014. This pushed farm milk values down in that milk-deficit region. However, the largely milk-surplus region of the West was able to push dairy products into distant regions at lower costs, effectively improving milk values there. The change in transportation costs had a neutral impact in a band from New Mexico through northern Michigan.
The Southeast continued to lose significant amounts of milk, contracting the supply, and the population continued to grow, expanding demand in the region. Figure 6 shows that both of these supply and demand pressures had a positive effect on regional farm milk prices. However, the combined negative effect of transportation almost exactly offset the positive effect of supply and demand, leading to almost no change in farm milk values.
As in the Southeast, the heavy milk-deficit regions of the Atlantic Coast from New York City to Washington, D.C., experienced a negative farm milk price impact due to lower costs of transportation. Nearby milk surpluses in Pennsylvania, New York, and Vermont—coupled with almost no population growth in the region—reinforced the negative farm milk value resulting from changes in supply and demand. This led to significant declines in farm milk values.
Major changes in U.S. farm milk prices may occur for many reasons. Exports can have a large impact, as they did in 2014 by raising milk prices significantly and in 2016 when loss of foreign sales kept prices at relatively low levels. This impact may be described as affecting the “level” of U.S. milk prices. But domestic changes in regional supply, demand, and transportation costs can also affect farm milk values. These impacts might be described as changing the “tilt” of prices across the country. Both level and tilt factors have been at play in the last few years as dairy farms struggle to accommodate the combined impacts on farm milk prices. Regulated FMMO milk prices for Classes II through IV are identical across the country. Changes in regional values must be accommodated by changes in the unregulated premiums paid in different regions above the Federal Order minimum prices.
Hooper, A., and D. Murray. 2017. An Analysis of the Operational Costs of Trucking: 2017 Update. Arlington, VA: American Transportation Research Institute. Available online: http://atri-online.org/wp-content/uploads/2017/10/ATRI-Operational-Costs-of-Trucking-2017-10-2017.pdf
Nicholson, C., and M. Stephenson. 2010. “Normative Class I Price Surfaces for May and October 2006.” Ithaca, NY: Cornell University. Unpublished.
Nicholson, C.F., He, X., Gao, H. and M. Gómez. 2015. Environmental and Economic Analysis of Regionalizing Fluid Milk Supply Chains in the Northeastern U.S. Environmental Science and Technology, 49:12005–12014.
U.S. Department of Agriculture. Milk Production. Washington D.C.: U.S. Department of Agriculture, National Agricultural Statistics Service. Available online: http://usda.mannlib.cornell.edu/MannUsda/viewDocumentInfo.do?documentID=1103
U.S. Department of Agriculture. Commercial Disappearance, Dairy Product Categories. Washington, D.C.: U.S. Department of Agriculture, Economic Research Service. Available online: https://www.ers.usda.gov/webdocs/DataFiles/48685/CmDsProd.xlsx?v=0

