
Source: United Nations, Food and Agriculture
Organization (2014).
Source: Swinnen and Briski (2017).
Source: Colen and Swinnen (2016).
Globally, beer consumption and trade have grown significantly over the past decades. Total beer consumption has increased rapidly since 1990 (Figure 1). The global beer market is around 250 billion U.S. dollars, 2.5 times as large as the global wine market and roughly double the global spirits market. The differences in volume are much larger (beer consumption is more than seven times larger than wine consumption by volume) since wine and other alcohol are typically more expensive than beer (Swinnen and Briski, 2017).
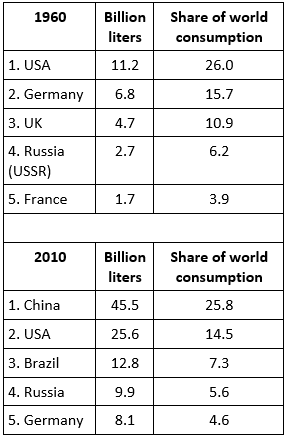
However, the growth in beer consumption has been uneven. For a long time, the majority of beer was consumed in three nations: the United States, UK, and Germany (Table 1). In 1960, these three accounted for more than half of worldwide beer consumption by volume. Fifty years later, in 2010, they claimed less than a quarter. Over the past decade, China surpassed the United States as the single largest beer market, Russia overtook Germany, and Brazil surpassed the UK.
These observations indicate major changes in global beer markets but not what caused them. It may be that beer consumption declined in the leading countries, or that beer drinking increased in the emerging economies or in countries that traditionally consumed other alcoholic beverages such as spirits or wine. It turns out that all three are true.
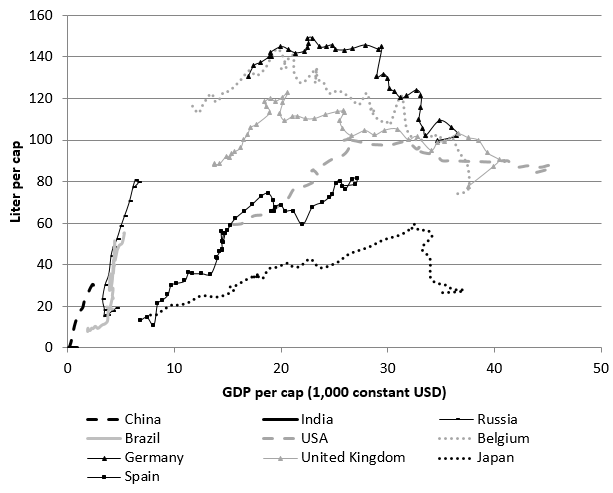
Consumption in traditional beer-drinking nations is shrinking. Per capita consumption in countries like Belgium, the UK, the United States, and Germany increased significantly after World War II and through the 1960s and the 1970s (Figure 2). But beer consumption did not grow forever, peaking in the 1970s or 1980s, depending on the country. Since then, beer consumption has experienced a long (almost 40 years in Belgium), deep (from 145 to less than 100 liters per capita in Germany) decline. Total beer consumption has declined as a consequence. The United States is something of an exception because immigration (and thus population growth) have kept the total beer market growing, even as per capita consumption declined.
The opposite has occurred in countries where people traditionally drank wine, such Spain, Italy, and Argentina, where wine consumption has declined and beer consumption increased. The same is true in countries where people traditionally drank mostly spirits; vodka consumption in Poland and Russia has declined over past decades and beer consumption has increased.
The strongest growth has come from emerging economies, reflected in China’s rise in the global beer market. From close to zero beer consumption as recently as 1980, China overtook the United States as the largest beer market in 2003. In Russia and Brazil, beer consumption has increased strongly over the past two decades and these countries are now larger beer markets than Germany. In all these countries the combination of income growth and economic liberalization has been associated with dramatic growth in beer production and consumption.
The size of these markets is highly dependent on population, of course. The Chinese still don’t drink anywhere near the volume of beer per capita that Germans, Czechs, and Irish do. The Czechs are world-class beer drinkers, with an annual 143 liters per capita in 2014. Still, China’s per capita beer consumption has grown rapidly from a feeble annual one liter per capita in the early 1980s, when their economic liberalization process started, following the country’s economic growth. Today’s 25 liters of beer per capita represents a 25-fold increase over the past 30 years. Similarly, Russian per capita beer consumption grew dramatically during its transition from a Communist, vodka-drinking nation to a capitalist regime.
What caused these changes? The fact that both China and Russia started consuming more beer when they switched from communism to capitalism may suggest that economic ideology (or the market) has something to do with it. However, two other factors seem to have played a bigger role: economic growth (income) and globalization.
Psychologists suggest that alcohol consumption, particularly alcohol abuse, increases during recessions as a response to the stresses of economic downturns. However, economists generally predict that people’s incomes fall during recessions, leaving them with less money to spend; beer consumption will fall as a result. In the short run, Freeman (2011)—who analyzed various datasets using different methodologies—concludes that, at least for the United States, beer consumption does fall when incomes decline, and vice versa, but that the effect is modest.
However, in the long run, the relationship between income and beer consumption is not linear (see Figure 2). In poorer “emerging countries,” there has been a clear increase in beer consumption over the past decades, in which most of these countries have seen a period of rapid income growth. Yet in the richer “beer-drinking nations”—such as Germany, the United States, and Belgium—where incomes have also increased, the evolution of beer consumption is very different: it has declined with income growth. If people are poor and become wealthier, they can afford to spend more, and they consume more beer. But at some point this trend hits a turning point and beer consumption begins to fall as incomes rise.
Why would beer consumption decline as incomes rise? The simplest explanation is that, at some point, people have had enough. There is likely an upper limit to how much consumers appreciate beer consumption. Another explanation is increased awareness and concerns about the potential negative health effects of alcohol consumption when income rises. Since the 1970s and 1980s, the health and social risks of alcohol consumption have become more apparent. Governments have responded by taxing alcohol, imposing limits on advertising and the sale of alcohol, and passing laws against drinking and driving. Health concerns and regulations also work indirectly: Studies find that the ban on smoking in bars has contributed to reduced beer consumption.
Using data from countries across the globe from the past 50 years, we calculated the turning point (i.e., the income level at which beer consumption starts declining with growing incomes) to be approximately $21,000 USD per capita. This income level was reached by Belgium and the United States in the 1970s, by Germany in the early 1980s, and by the UK in the mid-1980s (Colen and Swinnen, 2016).
These countries also demonstrate a tendency toward consuming different types and more expensive beers. The trend away from pilsners in traditionally beer-drinking nations is reflected in a general attitude of “drink less, taste more.” So while beer-drinking countries may be drinking less beer, they are also drinking more expensive beer (Garavaglia and Swinnen, 2017).
Source: Colen and Swinnen (2016).
As consumers in traditional beer-drinking nations get richer, they can also afford to drink more expensive, imported beverages, such as wine. They also travel more, becoming more exposed to different tastes and other alcoholic drinks. At the same time, globalization has reduced the cost of imported wines and other drinks. The combination of increased demand for variety, changing preferences, and reduced costs of imported products induced a shift from beer to wine in those countries. Interestingly, the same factors cause the opposite trend in countries where spirits and wine were the traditional drink. While Dubliners and Berliners now increasingly sip on wines, Parisians, Romans, and Russians have shifted to beer.
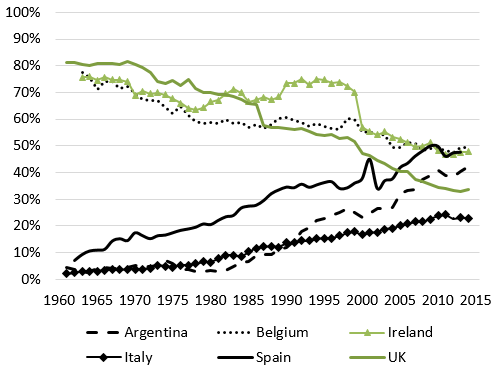
This change is dramatic, as Figure 3 illustrates. The graph shows the share of beer in total alcohol consumption for three traditional “beer-drinking nations” (Ireland, the UK, and Belgium) and three traditional “wine-drinking nations” (Spain, Italy, and Argentina). In the 1960s, the share of beer in the beer countries is around 80% and less than 10% in the wine countries. However, the gap has consistently narrowed since then. There is now little difference between beer and wine consumption in these categories. In fact, some of the traditional wine countries have overtaken some of the traditional beer countries. The share of beer in total alcohol consumption has fallen from around 80% in the 1960s to less than 50% today in Ireland, the UK, and Belgium.
Meanwhile, the opposite has occurred in countries like Spain, Italy, Greece, and Argentina, where beer is the new favorite drink and wine is on its way out. All of these countries experienced sharp increases in the share of beer. In Spain, the share of wine in alcohol consumption fell from 65% to 38% between 1960 and 2010, and Greece experienced a similar fall in wine consumption from 86% to 50%. A similar trend appears to be at work in traditional spirits-drinking nations. In China, spirits consumption fell from 98.5% to 60% from 1961 to 2010. During the same period, beer consumption increased from 2% to 36%. Arguably the most dramatic change occurred in Russia. After centuries of a close relationship between Russians and vodka, the nation unexpectedly switched to beer in the 1990s. The share of vodka as a percentage of total alcohol consumption fell from 40% to 15%, while per capita beer consumption rose from 15 to 80 liters between 1995 and 2008 (Deconinck and Swinnen, 2015). In 2005, Russia’s beer consumption surpassed Germany’s, making it the third largest beer market in the world.
Nations that have long consumed a majority of their alcohol as one traditional drink are now consuming non-traditional forms in higher quantities. The concept of beer-drinking nations (like Ireland and Belgium), wine-drinking nations (like Spain and Italy), and vodka-drinking nations (like Russia and Poland) is a thing of the past. Globalization and income growth have made the world’s alcohol consumption patterns much more homogeneous. A global “convergence of tastes” is changing alcohol consumption patterns.
Source: United Nations, Food and Agriculture
Organization (2014).

Source: Elzinga, Tremblay and Tremblay (2017).
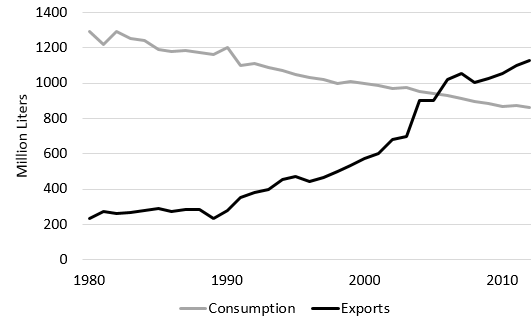
Source: Union of Belgian Brewers (2014).
These global changes in consumption have been mirrored by changes in beer trade. For most of the 20th century, beer trade was largely domestic. Beer exports were limited to a few global branding successes—such as Heineken, Corona, and Guinness—and otherwise to neighboring regions, such as Belgian exports to the Netherlands and northern France and Canadian exports to the northern United States. Beer trade made up less than 2% of global beer consumption until late in the 20th century.
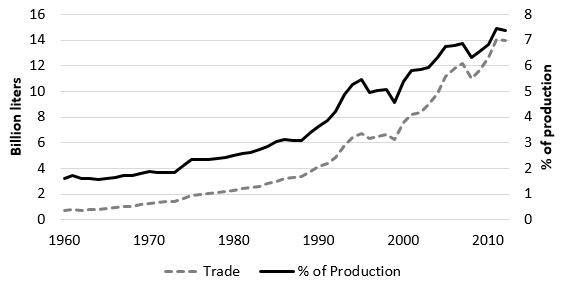
However, trade has grown rapidly since then. International beer markets and trade have fundamentally changed in the 21st century. The volume of beer exported more than doubled over the past two decades—from around 6 billion liters in 1990 to around 15 billion liters in 2014 (see Figure 4). Moreover, the share of production that is exported has increased as well: from less than 2% in 1990 to more than 7% most recently. In the United States, beer imports increased from around 5% in 1990 to almost 15% in recent years (see Figure 5).
Interestingly, the increase in beer trade seems to have been caused by two very different, almost opposing developments: (1) the spread of multinational brewers using takeovers of foreign brewers (and their infrastructure) to launch and sell their premium exports and (2) the shift in consumer preferences toward more local and craft beers, creating increased demand for variety and specialty beers, which are partially imported. The rapid growth of beer multinationals through mergers and acquisitions in the 1990s and 2000s has provided these multinationals with local infrastructure and access to beer retailers, pubs, and consumers in many more countries. In this way they have been able to channel their export brands into many more markets and areas where they were not able to go before.
At the same time, the rapidly growing demand for craft beers in many countries and 21st-century consumers’ willingness to pay extra for specialty beers has created export opportunities for smaller brewers. With craft and specialty beers linking their quality more closely to their geographic location, the beer trade has fundamentally changed in the 21st century.
This is nowhere better to be observed than in countries like Belgium. The recent global fascination with Belgian beer is matched by tremendous growth in Belgian beer exports. The export boom started in 1990; since 2005, Belgium has exported more beer than it consumes domestically (see Figure 6). The export growth is driven both by mergers and acquisitions—culminating in AB Inbev, and the associated global spread in sales of Stella Artois, Hoegaarden, and Leffe—and by the strong growth in exports among much smaller Belgian breweries, mostly selling specialty beers. Small Belgian breweries are now selling their beers in the United States and faraway places in Asia and Latin America.
A historic overview of the evolution of global beer consumption indicates that consumption and trade of beer has changed dramatically in recent decades. Over the past 50 years, consumption patterns have changed substantially, with decreasing consumption in the traditional beer-drinking countries and strong growth in emerging economies and in countries that traditionally consumed mostly wine or spirits. These changes have created convergence in global consumption patterns of alcoholic beverages and a rapid rise in beer trade, accompanied by global mergers and acquisitions among brewing companies.
Colen, L., and J. Swinnen. 2016. “Economic Growth, Globalization and Beer Consumption.” Journal of Agricultural Economics 67(1):186–207.
Deconinck, K., and J. Swinnen. 2015. “Peer Effects and the Rise of Beer in Russia.” Food Policy 51:83–96.
Elzinga, K., V. Tremblay, and C. Tremblay. 2017. “Craft Beer in the United States” in C. Garavaglia and J. Swinnen, eds. The Craft Beer Revolution: An Economic Perspective. London: Palgrave MacMillan.
Freeman, D. 2011. “Beer in Good Times and Bad: A US State-Level Analysis of Economic Conditions and Alcohol Consumption.” Journal of Wine Economics 6(2):231–251.
Gammelgaard, J., and C. Dörrenbächer. 2013. The Global Brewery Industry: Markets, Strategies, and Rivalries. Cheltenham: Edward Elgar.
Garavaglia, C., and J. Swinnen, eds. 2017. The Craft Beer Revolution: An Economic Perspective. London: Palgrave MacMillan.
Swinnen, J., ed. 2011. The Economics of Beer. Oxford: Oxford University Press.
Swinnen, J., and D. Briski. 2017. Beeronomics. How Beer Explains the World. Oxford: Oxford University Press.
Tremblay, V., and C. Tremblay. 2005. The U.S. Brewing Industry: Data and Economic Analysis. Cambridge, MA: MIT Press.
Union of Belgian Brewers. 2014. Annual Report 2014. Brussels. Available online: http://www.belgianbrewers.be/en/economy/article/employment-104
United Nations, Food and Agriculture Organization. 2014. Statistics of the Food and Agriculture Organization of the United Nations. Rome. Available online: http://www.fao.org/faostat/en/#data/QC

