The story of the U.S. beer brewing industry from the late 1800s to the present is a remarkable tale of steady decline followed by exponential resurgence. In the 1870s, the United States had over four thousand brewers, but that number had steadily declined by the 1980s to only 40–80 breweries (Brewers Association, 2017a). No single cause can be blamed for this decline, but major contributors include the decline in agricultural production during the Dust Bowl, the Great Depression, Prohibition, and World War II (Tremblay and Tremblay, 2005). When the 1950s ushered in the age of mass advertising, large brewers engaged in national television campaigns that gave them a competitive advantage over smaller breweries.
The U.S. brewing industry has evolved through several remarkable periods, each distinguished by unique market structure, competition, and performance. An industry that took around 100 years to erode required less than half that time to recover. Over the last four decades, the U.S. brewing industry has exceeded its previous mark, bouncing back with roughly five thousand brewers in 2016. Most of this growth has been in the craft beer and brewpub sectors (Brewers Association, 2017a).
In addition, the industry is governed by complex local, state, and federal regulations that change frequently, making the industry highly policy relevant. This article offers a brief overview of changes in the U.S. brewing industry over the past 40 years, specifically looking at the industry’s link to agriculture and the regulatory environment, then industry structure and growth by size and region.

Source: Alcohol and Tobacco Tax and Trade
Bureau (2017a).
As a product, beer is directly linked to agricultural production both in the United States and abroad. The barley used to make malt is grown in the northern United States and Canada. The hops used to flavor beer are produced mostly in Washington, Oregon, and Idaho, although global varieties are also sought out for numerous brews. Other grains—such as wheat, corn, and rice—are also used in lesser amounts as primary ingredients or adjuncts in certain styles of beer (Figure 1).
These products have important value-added components as well. Maltsters turn barley, and to a lesser extent other grains, into a usable malted grain for brewing or produce a malt extract—a condensed malt syrup or powder. Hop processors turn raw hops into condensed pellets or hop extract—a highly potent syrup. In both cases, processors play a pivotal role in quality control as well by monitoring specific standards required for brewing a consistent beer.
As the composition of the brewing industry has changed from large brewers to smaller craft brewers, use of these agricultural inputs has started to change as well. One example is the use of grains in production. Malted grains have long been a staple of brewing, providing the necessary sugars for fermentation. In addition to malted grains, brewers use some amount of unmalted adjunct grains to help balance the brewing process. These can include corn, rice, wheat, and barley.
As overall production has declined and breweries have gotten smaller, the use of malts, corn, and rice has also declined (Figure 1). Yet the use of barley has been steadily rising. Many potential factors drive this substitution in grain inputs across the industry. Anecdotal evidence suggests that it may be related to changes in the brewing process that allow brewers to use cheaper unmalted grains. The fuel ethanol boom may have caused a substitution away from malting barley in the field, driving up prices, or other general changes in commodity prices may have incentivized brewers to substitute inputs.
Source: Alcohol and Tobacco Tax and Trade
Bureau (2017a).
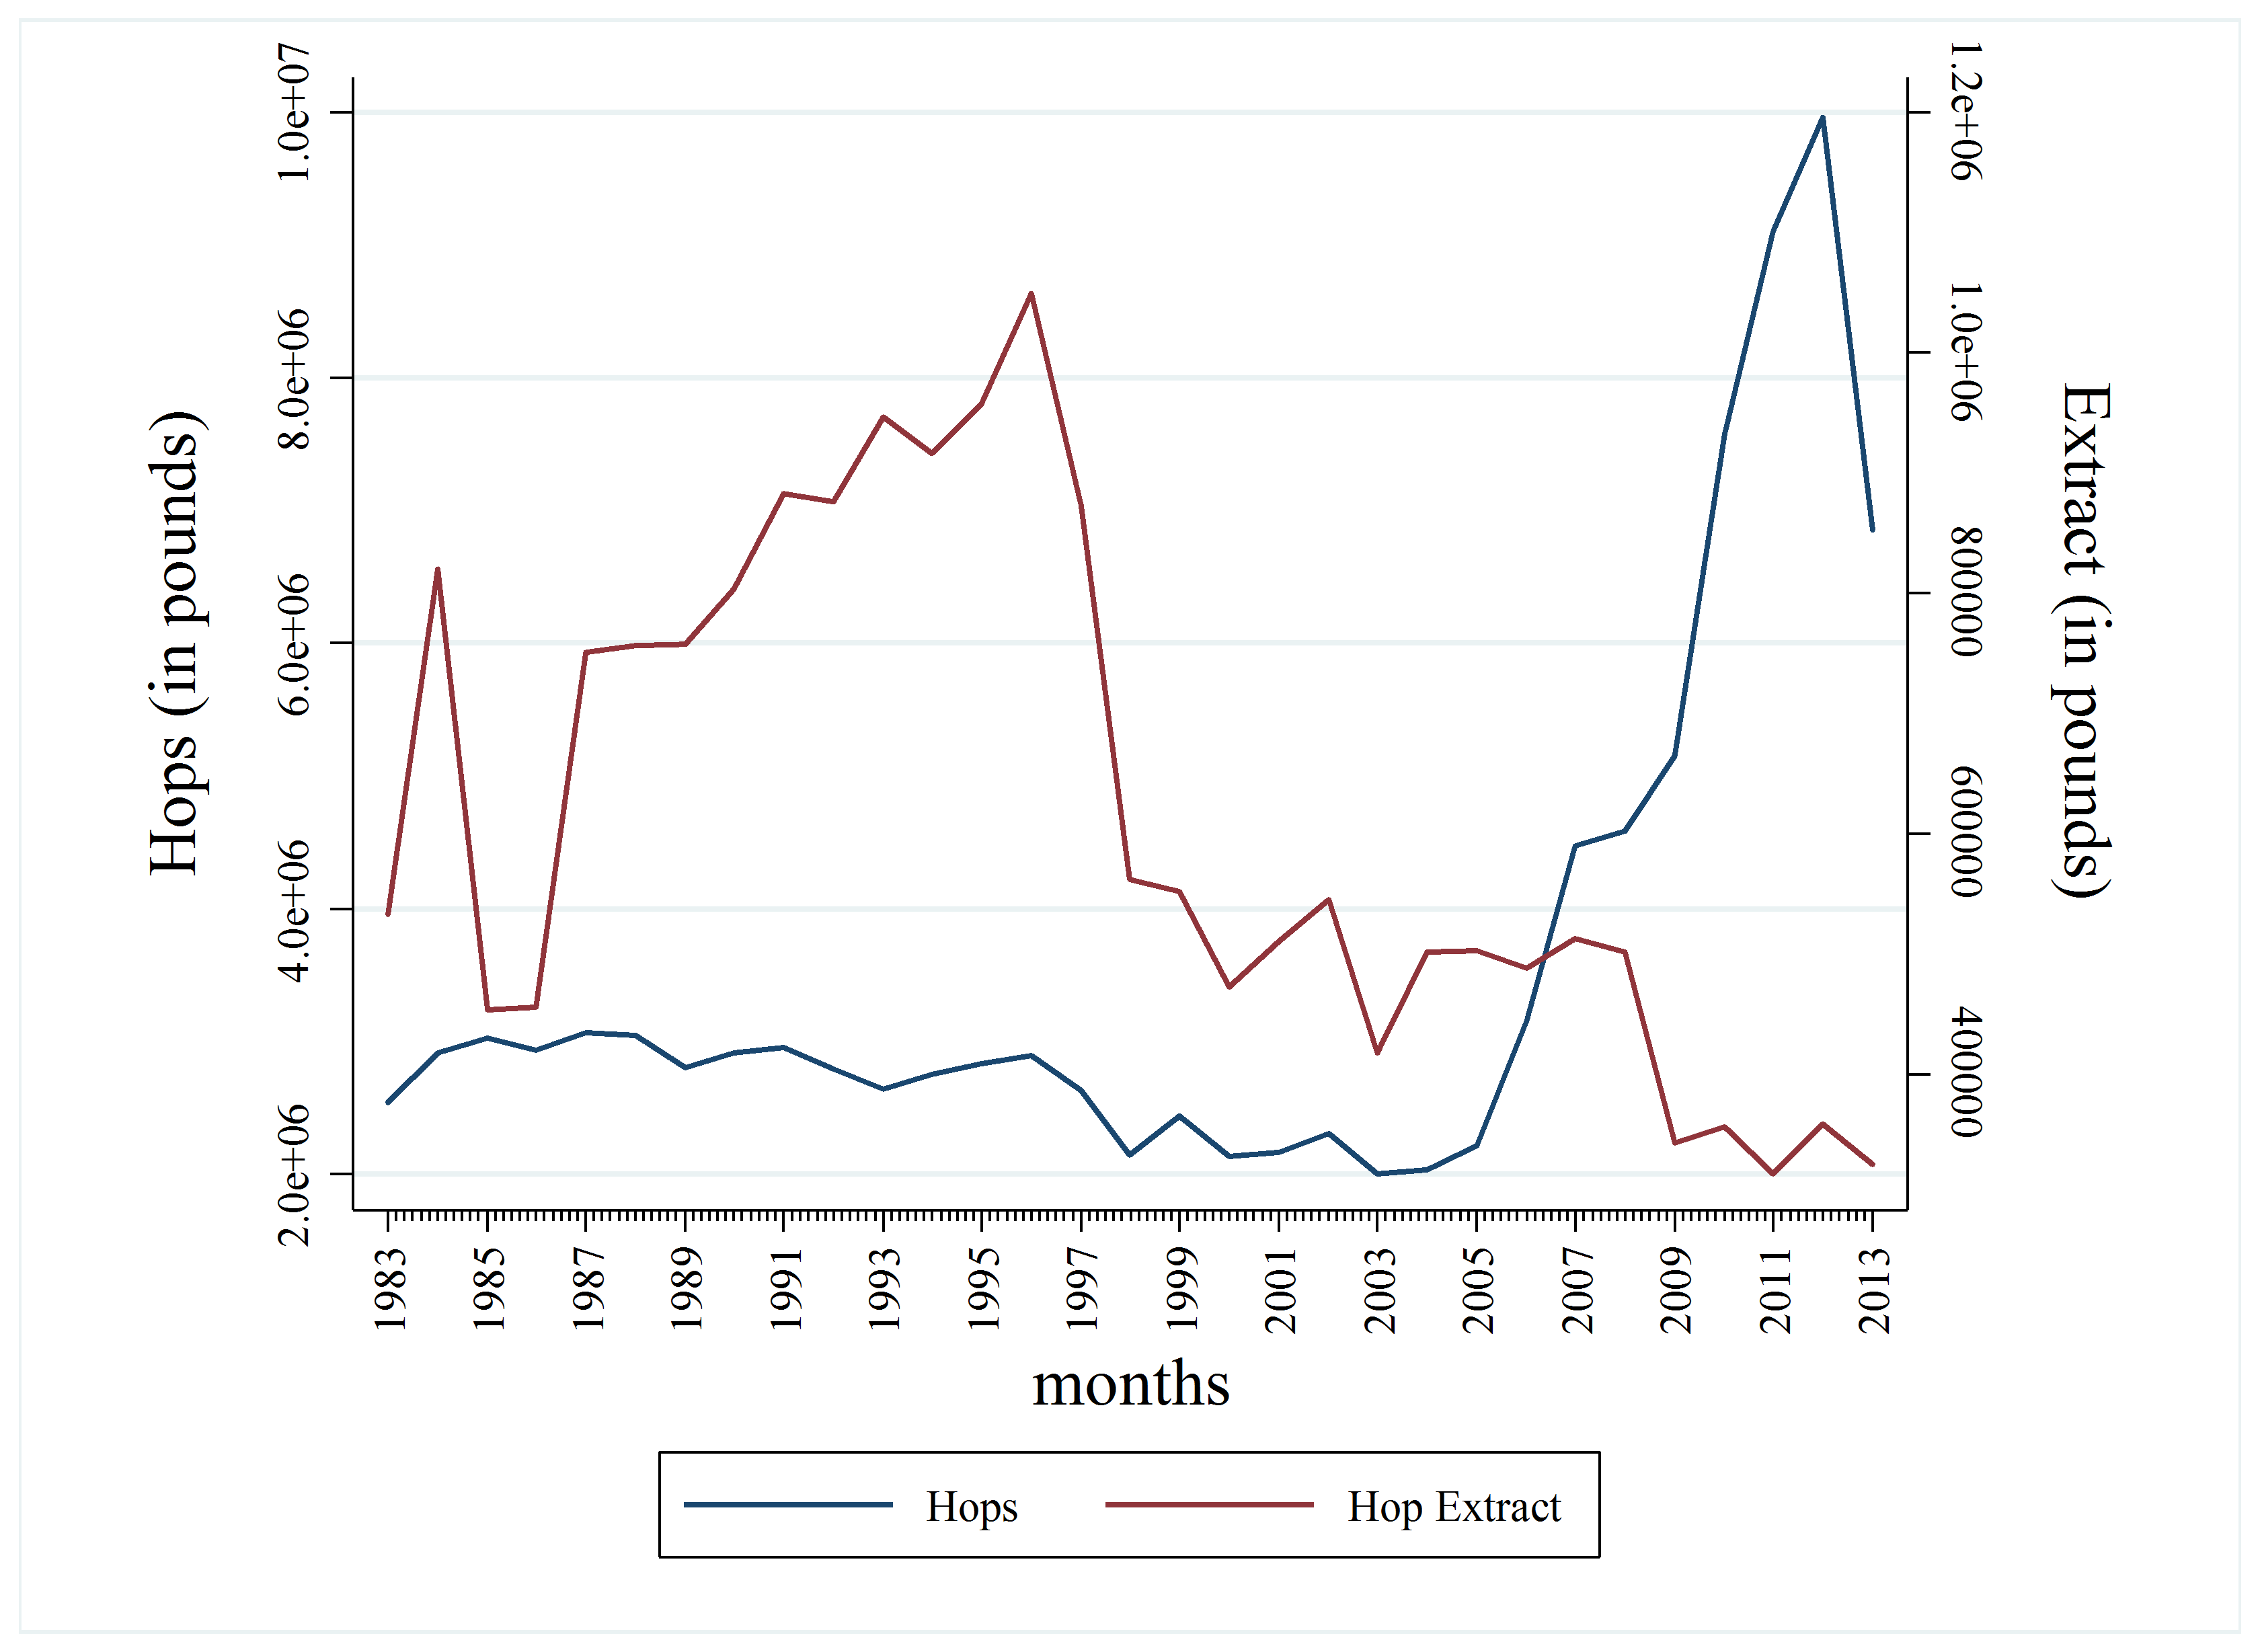
Similarly, the use of hops in brewing has also been changing. Hop extracts have long dominated regular hops as an input (Figure 2). In the mid-1990s, the use of extract fell drastically and steadily decreased. Starting around 2007, the use of dry hops began to increase. This input shift is directly reflective of the types of beers being produced. Light lagers tend to only use small amounts of hop extract for slight bittering, whereas India Pale Ales (IPAs)—which are very popular in the United States—use more hops and tend to be produced with either whole-cone unprocessed hops or hop pellets. On Beer Advocate (https://www.beeradvocate.com/lists/top/), an online community beer-rating forum, five of the top ten beers are Imperial IPAs, which require a large amount of hops relative to the typical light lager.
Again, the reasons for these industry-wide changes in input usage are uncertain, but they have important marketing and production implications. The hop industry has traditionally operated in a contract market where 80–90% of all sales are forward contracted. Given the sheer volume of breweries and their differing input requirements, we can envision how this may create difficulties for small producers trying to secure smaller contracts.
A variety of laws governs the brewing industry, its wholesalers, and its suppliers. Differences in state policies have important implications within and across states. Franchise laws, which govern the relationship between brewers and wholesalers, differ considerably from state to state (Brewers Association, n.d.). In general, most states define how the two parties in the supply chain interact, but the flexibility of the agreement can vary widely. For instance, Massachusetts law states that a brewer can only terminate a contract with a distributor in the state after 120 days of notification with the wholesaler and the state Alcoholic Beverage Control Commission; termination can only for “good cause.” The termination can be suspended, however, upon the wholesaler’s request and a hearing by the ABC Commission. Many other states, such as Colorado, mandate exclusive territories for wholesalers, so that if they deliver outside of their territory they can face hefty fines or other penalties, while other states prohibit exclusive dealing contracts altogether.
Franchise laws such as these were initially put in place to protect small independent wholesalers from large breweries with substantial market power (see Malone and Stack in this issue for a discussion of the historical significance of these and other beer laws). There is controversy, however, over their current effectiveness given the recent exponential rise of small breweries. In a New York Times opinion piece, Steve Hindy, founder of Brooklyn Brewery, relayed a contract dispute with a distributor that ended up costing the brewery $300,000 in legal fees and settlement costs (Hindy, 2014). The brewery claimed the distributor was selling out-of-date beer, selling outside their designated territory, and generally not performing to their contractual agreement. The distributor filed suit, disputing these conditions as “good cause.” This type of anecdotal evidence appears often and can certainly persuade breweries not to operate in areas they otherwise would have. In response to Hindy’s opinion piece on the detriments of franchise laws, Craig Purser, president of the National Beer Wholesalers Association, responded in a letter to the Times editor (Purser, 2014). In Purser’s view, franchise laws actually benefit consumers and the public by providing “an independent system that generates tremendous choice.” Without this system, the double-digit growth rate experienced by the craft beer segment would not have been achievable. Several states have recently passed self-distribution exemptions for small breweries, allowing them to bypass distributors altogether provided their production stays below a given level.
Source: National Institute on Alcohol Abuse and
Alcoholism (2017).
In addition to franchise laws, a number of other state beer policies affect the local beer industry. The National Institute on Alcohol Abuse and Alcoholism has created an interactive interface, called the Alcohol Policy Information System (https://alcoholpolicy.niaaa.nih.gov/), for exploring many of these policies. For example, some states limit the alcohol content (typically 4% alcohol by volume) in beer sold for on-premise consumption (in restaurants and bars) and/or off-premise consumption (in grocery or liquor stores). Up until 1998, 20 states banned Sunday sales of alcoholic beverages. Since then, eight of those states have repealed the law and three have authorized local options. Seven states prohibit happy hours at on-premise locations and another nine allow them, but only during restricted hours, such as before 10pm. At the other end of the spectrum, states such as Idaho allow off-premise retailers to provide consumers samples up to 1.5 ounces, and 34 states allow on-premise establishments to provide free beers as a promotion or for a special occasion. All of these laws influence a brewery’s ability to reach their target consumers. We would expect relatively larger industry growth in states where it is easier for a brewery to move its beers to market and practice perfected marketing techniques.
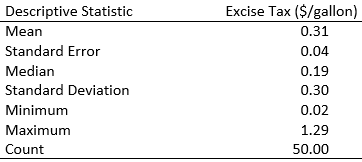
Taxation and pricing policies also vary widely. Seven states currently require wholesalers to establish a minimum markup and maximum discount for retailers. Whether or not the wholesaler can provide retailers with product on credit varies across states, with some states prohibiting this type of sale and others establishing maximum days on credit. Fourteen states ban the practice of offering volume discounts altogether. Finally, there is a huge difference in state excise tax on beer production. Table 1 lists descriptive statistics for excise tax equivalents on a gallon of 5% beer. The taxes range from a minimum of $0.02 to a maximum of $1.29 per gallon. This is on top of the federal excise tax of $0.58 per gallon. The Beer Institute estimates that more than 40% of the final sale price of beer goes to federal, state, and local taxes (Beer Institute, 2017a). Altogether, these rules and others have important implications for interstate distribution of beer.
The U.S. brewing industry can be split into two broad categories: macrobreweries and craft breweries. Macrobreweries (e.g., Anheuser-Busch, Miller, and Coors) collectively produce the largest volume of beer each year and individually produce well over 6 million barrels each, where a barrel equals 31 gallons. Craft breweries are defined by the industry as being smaller, with less than 6 million barrels of annual production, and being independently owned (less than 25% ownership of by a macrobrewery) (Brewers Association, 2017b). Craft breweries generally produce more unique and varied styles of beer compared to the traditional American lagers and light lagers (e.g., Budweiser, Miller Lite, and Coors Original) that have dominated the beer market for decades.
Within these two broad categories, there are still more specific segments: Regional breweries produce between 15 thousand and 6 million barrels annually, while microbreweries produce fewer than 15 thousand barrels annually. Brewpubs (restaurant-breweries) generally produce less than 15 thousand barrels and sell 25% or more of their beer on site. More recently, nano-breweries have been defined as those producing around 3–4 barrels per year.
Some breweries only brew beer for other breweries that handle the marketing and sales of the product. Both brewers in this relationship (the buyer and seller) are referred to as contract brewers—although there are subtle variations to these types of contracts. For example, contract brewing was an important step for the Boston Beer Company (i.e., Sam Adams beer), which used the excess capacity of other brewers to make their own beer early on, thus saving on investment in capital costs.
Source: Alcohol and Tobacco Tax and Trade
Bureau (2017b).
Source: Alcohol and Tobacco Tax and Trade
Bureau (2017b).
Source: National Archives Catalog (2017).
The large macrobrewers dominate the industry with respect to sales and are poised to achieve economies of scale (Tremblay and Tremblay, 2005). They also have greater access to inputs and wholesale distribution. Yet smaller brewers have found ways to compete more on quality than on quantity (Berning and McCullough, 2016).
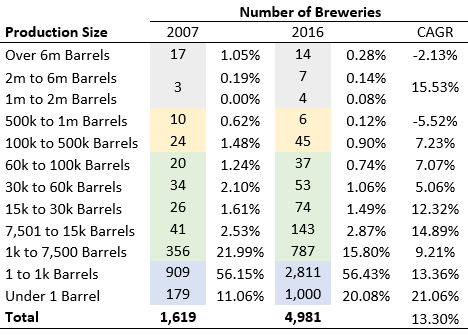
Over the past decade, the U.S. beer industry as a whole has been stagnant or declining. At the same time, the craft beer segment has seen continuous growth. Table 2 presents the number of breweries reported by the Alcohol and Tobacco Tax and Trade Bureau. The number of macrobrewers producing over 6 million barrels has declined over the past decade, with a compound annual growth rate of –2.13%, currently representing less than 1% of the total number of breweries. Alternatively, the number of brewers producing 100 thousand barrels or less has shown significant growth, with breweries producing 7,500–30,000 barrels showing double-digit growth. Notably, more than half the breweries produce fewer than 1,000 barrels a year.
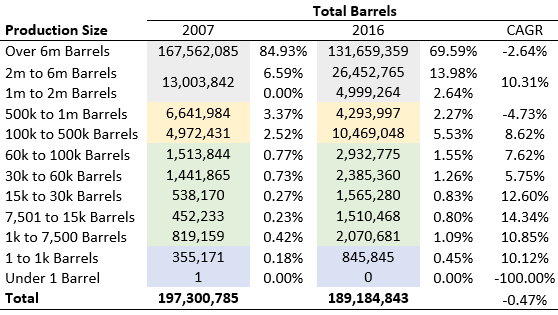
With respect to barrel production, these smaller breweries have also grown faster than their macro counterparts (Table 3). While macrobrewer production in barrels has steadily declined, craft breweries have steadily grown, displaying double-digit growth in many size categories. Within the craft segment, regional breweries make up 73% of craft barrel production, microbreweries 20.4%, brewpubs 5.5%, and contract brewing companies rounded out total 2016 production with 1.1% (Brewers Association, 2017c). It is relevant to note that the largest brewers still owned nearly 70% of total beer production in 2016, down from roughly 85% in 2007. The smaller production categories have roughly 1% or less of total production. In summary, the U.S. brewing industry is still led by a few dominant firms, but this share is declining as the fringe continues to gain market share.
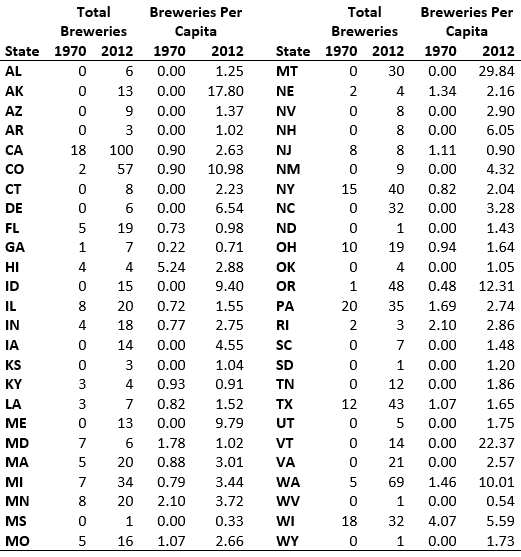
Those familiar with the brewing industry are well aware of exponential growth in the number of U.S. breweries over the past 40 years. Given the commercial and cultural differences across the United States, it is informative to break down this growth by state. Table 4 compares the total number of breweries by state in 1970 and 2012. Not surprisingly, California, Colorado, and Washington lead the way in growth, as these states have well-known and expansive brewing communities in San Diego, Fort Collins, and Seattle, respectively. California and Colorado are also homes to the early home brewing industry that helped launch early craft brewers (Hanson, McCullough, and Berning, 2016). Other states—Michigan, Montana, North Carolina, Oregon, Texas, and Wisconsin—have exhibited growth as well. Although not as large as California, these states all have established craft beer industries that distribute brews well beyond their borders.
Many areas exhibit a conspicuous lack of growth. Excluding Florida and North Carolina, growth in the Southeast has been slow over the past 40 years. This could be due to cultural differences or possibly economic climate. Differences across states could also be driven by variation in the regulatory environment. When Prohibition was repealed by the 21st Amendment in 1933, most alcohol-related policy was deferred to the state and local levels, resulting in a complex and arguably convoluted system of production, distribution, and sales laws. These differences in state beer policies are wide and no doubt have had lasting effects on the development of the brewing industry within state borders.
When we present the number of breweries on a per capita basis, a slightly different story emerges. Some states with large brewing industries, such as California, are not growing as fast relative to the population. Assuming constant per capita consumption, this could indicate that these states may be reaching the limit of their growth potential. It also shows that states not typically in the conversation regarding industry growth—particularly Alaska, Montana, and Vermont—exhibit much steeper growth rates per capita and have burgeoning market potential.
These per capita differences could also reflect state-specific industry conditions. Beer supply chains rely on wholesalers that not only distribute their product but also help market and promote it. In some states, the growth of distributors has also been stagnant or distributors and breweries face excessive regulation.
Breweries also rely on access to necessary malted grains and hops. The growth of breweries has led to competition for these inputs. Climatic events such as drought (hops) and freeze (barley) have led to periodic shortages as well. Consequently, these external factors may favor breweries in certain regions of the country or breweries producing at a larger scale with greater bargaining power.
Given the wide variety of state and local policies regarding beer production, distribution, and sale, it is no wonder that states have experienced disparate growth rates. A number of supply chain factors have also impeded or fostered growth in an industry that has been a pivotal part of this country’s rich history. As the local agricultural movement continues to grow, we can expect to see an increase in local production of barley and hops as well as value-added industries such as maltsters. We can also expect to see changes in local, state, and federal policies, whether they be prohibitionist or supportive. The Craft Beverage Modernization and Tax Reform Act is currently under legislative review and looks to substantially alter federal excise taxes rates. These are interesting times for an industry that provides more than $48.5 billion in tax revenue annually and employs over 1.75 million workers throughout its supply chain.
Alcohol and Tobacco Tax and Trade Bureau 2017a. Yearly Beer Statistics. Available online: https://www.ttb.gov/beer/beer-stats.shtml
Alcohol and Tobacco Tax and Trade Bureau 2017b. Number of Brewers by Production Size. Available online: https://www.ttb.gov/beer/beer-stats.shtml
Beer Advocate. 2017. Top Rated Beers. Available online: https://www.beeradvocate.com/lists/top/
Beer Institute. 2017a. Economic Impact. Available online: http://www.beerinstitute.org/economic-impact/
Beer Institute. 2017b. Federal Excise Tax. Available online: http://www.beerinstitute.org/policy-issues/excise-tax/
Berning, J., and M.P. McCullough, 2016. "Product Line Extension among New England Craft Breweries." Agricultural and Resource Economics Review 46(1):73–86.
Brewers Association. n.d. Franchise Law Resources. Available online: https://www.brewersassociation.org/government-affairs/franchise-law-resources/
Brewers Association. 2017a. Number of Breweries. Available online: https://www.brewersassociation.org/statistics/number-of-breweries/
Brewers Association. 2017b. Craft Beer Industry Market Segments. Available online: https://www.brewersassociation.org/statistics/market-segments/
Brewers Association. 2017c. National Beer Sales & Production Data. Available online: https://www.brewersassociation.org/statistics/national-beer-sales-production-data/
Hanson, J.L., M.P. McCullough, and J. Berning. 2016. “New West, Brew West: Home Brewing an Industry in the West.” Journal of the American West 55(2):49–59.
Hindy, S. 2014, March 29. “Free Craft Beer!” New York Times. Available online: https://www.nytimes.com/2014/03/30/opinion/sunday/free-craft-beer.html.
National Archives Catalog. 2017. County Business Patterns. Available online: https://catalog.archives.gov/
National Institute on Alcohol Abuse and Alcoholism. 2017. Alcohol Policy Information System. Available online: https://alcoholpolicy.niaaa.nih.gov/
Purser, C.A. 2014, April 4. “Beer Franchise Laws.” New York Times. Available online: https://www.nytimes.com/2014/04/05/opinion/beer-franchise-laws.html .
Tremblay, V.J., and C.H. Tremblay. 2005. The US Brewing Industry: Data and Economic Analysis. Cambridge, MA: MIT Press.

