Government subsidization of insurance is commonly employed as a policy tool to incentivize risk management activities. In the United States, a number of examples of subsidized insurance or reinsurance markets exist, including health insurance markets, agricultural insurance, flood insurance, and terrorism insurance, among others. There has also been an explosion in subsidizing agricultural index insurance programs in developing countries. Risk management programs have taken on a central focus in the current U.S. agricultural policy debate, as the environment has shifted from one that historically was more focused on direct payment programs and other income support measures, to one which today is more focused on agricultural insurance and providing risk management support to farmers (Woodard, 2013). The United States Federal Crop Insurance Program (FCIP) is the largest agricultural insurance program globally and historically. It has grown from a small pilot to what is now the cornerstone of agricultural support in the United States, with around $100 billion in liabilities and $10 billion in taxpayer costs annually. Due to its drastic growth and the subsidies involved, increased attention and scrutiny has been placed on its functioning—including rating, design, and other aspects—as well as cost effectiveness (GAO, 2014).
Understanding the impact of subsidies, program design, and premium rate changes on program participation is important given that one of the primary motivators for expanding the FCIP through time has been the argument that it is a superior alternative to ubiquitous ad hoc disaster assistance. A key to any analysis of insurance alternatives is knowledge of the underlying insurance demand elasticities—a measure of the level of insurance coverage demanded as the price of coverage varies. More specifically, to predict the level of subsidy required to reach a given level of participation or coverage in the market, one must have sound estimates of insurance demand elasticities that appropriately model subsidy and related effects. A recent report by the U.S. Government Accountability Office (GAO) concluded—based on elasticity estimates in the literature—that subsidization in the FCIP could be cut without significantly affecting program participation (GAO, 2014). This is somewhat difficult to reconcile, however, given the large increases in participation seen through time in response to increased subsidization and product offerings, despite that it is true that the empirical literature tends to find that crop insurance demand—or participation—is "inelastic", or relatively unresponsive to price changes. The GAO report then goes on to estimate cost savings under the assumption that farmers do not change anything about their insurance purchases as subsidies are removed—that is, perfectly inelastic demand.
Though there is a large insurance demand literature, studies that model aggregate demand responses to changes in crop insurance subsidies are somewhat scarce in recent years. With some exceptions, the vast majority of studies tend to find inelastic demand responses (Goodwin, 1993; Coble et al., 1996; O’Donoghue, 2014; Shaik et al., 2008). Such conclusions can be fairly counterintuitive upon casual inspection of some programs when evaluating uptake in response to increases in subsidization. If demand were nearly perfectly inelastic, this could be interpreted to suggest that these programs accomplish little if subsidizing them does not change behavior or lead to insurance purchases. To better understand alternative policy designs it is useful to review a brief historical perspective on U.S. crop insurance participation trends and outline some core empirical considerations that arise when estimating insurance demand.
Crop insurance in the United States was introduced in 1938, but was limited to a small handful of crops and experienced very limited participation. The modern era of crop insurance in the United States began with the Federal Crop Insurance Act of 1980. The Act led to an expansion in offerings to include all crops and counties where sufficient data existed to estimate premiums. Since the 1990's, we have witnessed a dramatic increase in acres enrolled, subsidization, and average coverage levels in the program, as well as a movement towards revenue insurance, which was introduced in the late 1990’s.
Source: U.S. RMA, 2016.
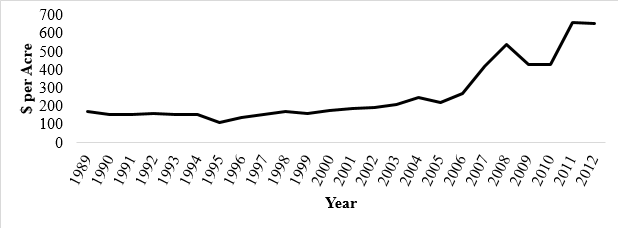
The Federal Crop Insurance Reform Act of 1994 (FCIRA) made participation mandatory at the 50% deductible level in order to be eligible for other government programs—such as deficiency payments—although this coverage was 100% subsidized. This was known as Catastrophic, or CAT coverage under the FCIP. The effective subsidy rate on products sold from 1994-1995, a period when only yield insurance was available, jumped from 26% to 55% as a result of FCIRA, a 110% increase in the effective premium subsidy rate. Insured acreage increased from 29.3 million acres in 1994 to 59.4 million in 1995, a 102.6% increase. Since 1989, liabilities per acre insured have tripled from roughly $200 per acre to more than $600 per acre (Figure 1). This change can be attributed to both increases in coverage levels as well as increases in commodity prices.
The Agricultural Risk Protection Act in 2000 saw further increases in subsidy rates. Over the same period, program subsidies per insured acre increased by more than 600% (Figure 2). However, subsidies have increased at a much faster pace than premium rates, as the subsidy adjusted premium rate increased by only 400%. The upswing in commodity prices also led to large increases in per acre premiums and subsidies, as well as acres enrolled (Figure 3).
|
Figure 2: FCIP Subsidies per Insured Acre

Source: U.S. RMA, 2016. |
Figure 3: Total FCIP Subsidies vs. Insured Acres
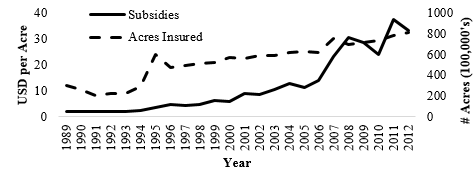
Source: U.S. RMA, 2016. |

Source: U.S. RMA, 2016.
Source: U.S. RMA, 2016.
Source: U.S. RMA, 2016.
The primary insurance products available today are Revenue Protection (RP), Yield Protection (YP), and area-based index protection (ARP, formerly GRIP). RP was the most popular plan in 2012 with 83% of total insured land, followed by YP with 11%, and ARP/GRIP with 3%. RP premiums—due to the fact that they are priced to cover crop price drops and yield losses—tend to have premium rates between two and three times those of YP, but also on average will provide larger indemnities. Coverage is typically available for 50%-85% of expected yield or revenue—that is, 50%-15% deductible. Within a few years of the introduction of revenue insurance, it accounted for more than half of FCIP Premiums (Figure 4).
Every four to six years, Congress passes a major package of legislation which sets national nutrition, food welfare, agriculture, conservation, and forestry policy—known as the Farm Bill. The most recent was the Agricultural Act of 2014. With this legislation, the FCIP became the primary financial risk management tool for commercial-scale U.S. agricultural producers, and also introduced several “revenue insurance-like” programs that stack on top of existing Federal Crop Insurance. This includes the Supplemental Coverage Option, or SCO; Areas Revenue Coverage, or ARC, as well as the Stacked Income Protection Program, or STAX, for cotton.
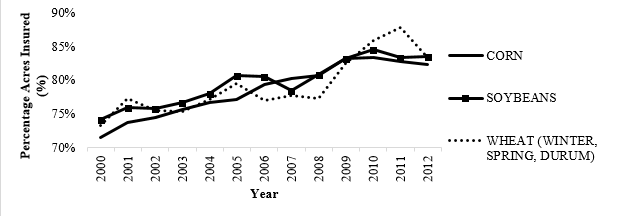
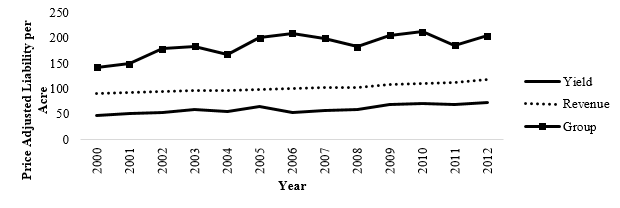
The three crops with the highest percentage of planted acres enrolled are corn, soybeans, and wheat (Figure 5). These three crops accounted for 69% of all enrolled acres and 77% of all program premiums in 2012. There are notable patterns in terms of insurance plan type and coverage level chosen through time. For revenue insurance (RP), participation has shifted significantly through time toward higher coverage levels. Liabilities per insured acre have also increased substantially through time (Figure 6). Even after adjusting for changes in base commodity prices, in just thirteen years, liabilities per insured acre for major commodities have increased by 55%, 31%, and 45% for yield, revenue, and area plan types, respectively.
Demand for insurance is motivated through two primary avenues: risk reduction effects and expected income effects. In private insurance markets, the expected value of indemnities to be received by the person insured is less than the premium cost. In Federal Crop Insurance, however, the expected return from buying insurance minus the farmer paid premium is typically positive since it is subsidized—if it is priced correctly. Effectively, subsidies change the “price” that producers pay for insurance, which affects demand. In general, demand models attempt to estimate the relationship between the quantity demanded for some good or service, as a function of its price and other factors. While many metrics have been proposed for measuring insurance demand, importantly for policy design, there is no generally accepted approach for which metrics should be used or how they should be modeled. Candidates for insurance "quantity" that have been evaluated in previous work include coverage level (or deductible), liability (or total covered value of asset being insured), total premium, product type and unit structure choice, as well as percent of acreage insured. Typically, one or more models are estimated with alternative quantity metrics, then the elasticities interpreted ad hoc in isolation as alternatives for policy inference. How these component measures relate to each other—or how they add up to reflect overall demand impacts—has, however, received much less attention.
An exception is Woodard (2015), which lays out a framework for evaluating how different quantity measures relate to each other—and to rate changes from subsidies versus outright rate changes—in order to determine aggregate market responses for various different target measures of insurance quantity. That study also finds that elasticities are mediated by other factors such as geography, and moreover that producers respond differently to changes in farmer paid premium rates associated with changing subsidy rates than they do from other sources of rate change. Different elasticities from models with different quantity measures should not be interpreted interchangeably or as substitutes in isolation, but rather are structurally related to one another. Overall, the study indicates that demand is likely far more elastic than previously thought.
Another common practice is to use premium rate observed—premium divided by liability—as the "price" variable in crop insurance demand models. In reality, producers do not face a single "price", but rather a menu of prices for different coverage levels they may elect. Most previous studies either:
The issue with estimating demand models in this context is that higher coverage level products (that is, insurance coverage with a lower deductible) are always going to be more expensive than lower coverage level products, as a simple actuarial matter (resulting in a positive relationship between "quantity" and "price"). On the other hand, as we increase the price of insurance, we would expect that this should cause a reduction in demand (that is, a negative relationship between quantity and price). If observed data on purchases are then modeled using standard statistical regression techniques, then this will result in faulty analysis. This is an instance of what is known as the "endogeneity" or "simultaneity" problem in econometrics.
|
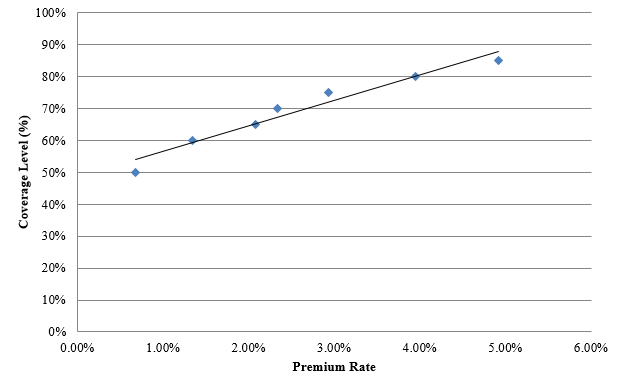
Figure 7: Observed Premium Rate by Coverage Level - McLean County, Illinois 2013
Source: U.S. RMA, 2016. |
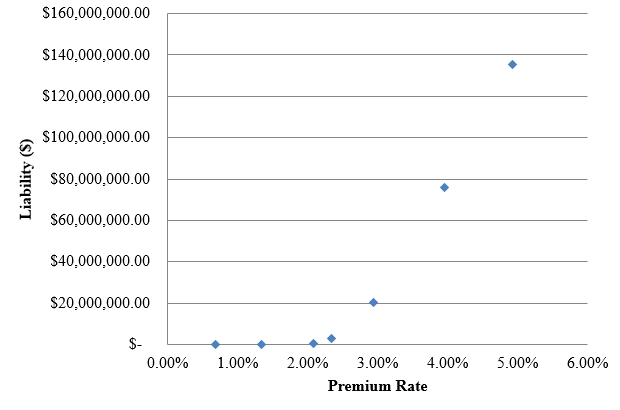
Figure 8: Observed Rate Per Unit by Liability- McLean County Illinois 2013
Source: U.S. RMA, 2016. |
For example, Figure 7 shows actual observed premium rates by coverage level in McLean County, Illinois, in 2013. The curve is upward sloping simply because the government prices higher coverage levels products to have higher premium rates than lower coverage level products, since they have greater expected payouts. Figure 8 shows the same but for observed liability. These both clearly show an upward sloping relationship between coverage level (or total liability) and premium rate, which on its face might be the opposite one would expect to see if the law of demand holds (that is, that price and quantity demanded are inversely related).
The idea of estimating demand is that the analyst would obtain data from many counties and years of data, then estimate models to see how much less insurance farmers buy when the price is increased. In agricultural insurance, the issue is that unless some account is taken of the simultaneity in the choice of coverage level and the corresponding price (or rate) which is charged for it, then these two effects are muddled. In the case of agricultural insurance, if the level of liability or average coverage levels are being modeled as "quantity" of insurance, then the premium rate observed from that purchase is "endogenous" to the observations of the purchase amount. A recent study by Woodard (2016c) proposes an econometric solution to this problem in the case of insurance, and finds elasticities that are three to five times more elastic when properly accounting for this endogeneity. That work also shows that the scaling of the coverage level is also important when interpreting demand elasticity estimates.
As crop insurance is the primary safety net for U.S. agriculture, understanding producer demand responses is critical. However, much of the historical economic analysis falls short in providing useful information or models to infer likely demand responses from changes in subsidy policy, program structure, or rates. More developments are needed to properly address these questions, including approaches that:
(1) explicitly relate various dimensions of quantity of insurance to aggregate market responses
(2) consider differential demand responses due to changes in menu premium rate (certain costs now) and the expected value of the return embodied in the subsidy (risky payments later)
(3) the endogeneity between the premium rate and the deductible chosen
The danger in making policy inference based on ad hoc single dimensions of insurance quantity, as well as improper specification and estimation of statistical models was highlighted by a recent U.S. Government Accountability Office report (GAO 2014). Quite aside from whether or not it is a wise idea to subsidize Federal Crop Insurance, accounting for these issues leads to different conclusions regarding the elasticity of demand for crop insurance. Policy-makers should be properly informed about the likely impacts from altering program structure.
Aron-Dine, A., L. Einav, and A. Finkelstein. 2013. "The RAND Health Insurance Experiment, Three Decades Later." Journal of Economic Perspectives, Volume 27, Number 1 (Winter), Pages 197–222.
Brown, J. R., R. S. Kroszner, and B. H. Jenn. 2002. Federal Terrorism Risk Insurance. National Tax Journal, 55(3): 647-657.
Coble, K. H., T.O. Knight, R.D. Pope, and J.R. Williams. 1996. Modeling Farm-level Crop Insurance Demand with Panel Data. American Journal of Agricultural Economics 78 (2): 439-447.
Glauber, J. W. 2004. Crop Insurance Reconsidered. American Journal of Agricultural Economics, 86(5): 1179-1195.
Goodwin, B.K. 1993."An Empirical Analysis of the Demand for Multiple Peril Crop Insurance." American Journal of Agricultural Economics 75.2: 425-434.
Michel-Kerjan, E., and H. Kunreuther. 2011. “Redesigning Flood Insurance,” Science, Vol. 333 no. 6041 (July). pp. 408-409
Morduch, J. 2006. “Micro-insurance: The Next Revolution.” in Abhijit Banerjee, Roland Benabou, and Dilip Mookherjee, eds., What Have We Learned about Poverty? New York: Oxford University Press.
O'Donoghue, E. J. 2014. "The Effects of Premium Subsidies on Demand for Crop Insurance ERR-169.", U.S. Department of Agriculture, Economic Research Service, Washington DC, USA.
Ramirez, O.A, C.E. Carpio, and R.M. Rejesus. 2011. "Can Crop Insurance Premiums be Reliably Estimated?" ARER 40(1): 81-94.
Shaik, S., K.H. Coble, T.O. Knight, A.E. Baquet, and G.F. Patrick. 2008. "Crop Revenue and Yield Insurance Demand: A Subjective ProbabilityA." Journal of Agricultural and Applied Economics, Vol. 40 No. 3, pp. 757-766.
Smith, V.H., and A.E. Baquet. 1996. "The Demand for Multiple Peril Crop Insurance: Evidence from Montana Wheat Farms." American Journal of Agricultural Economics 78.1: 189-201.
United States Government Accountability Office (GAO). 2014. “Crop Insurance: Considerations in Reducing Federal Premium Subsidies.” Washington: U.S. Government Accountability Office.
U. S. Risk Management Agency. 2016. Summary of Business Report and Applications. Tools. Available online: http://www.rma.usda.gov/tools/.
Woodard, J.D. 2013. "Theme Overview: Current Issues in Risk Management and U.S. Agricultural Policy". Choices. Quarter 3. Available online: http://choicesmagazine.org/choices-magazine/theme-articles/current-issues-in-risk-management-and-us-agricultural-policy/theme-overview-current-issues-in-risk-management-and-us-agricultural-policy
Woodard, J.D., G.D. Schnitkey, B.J. Sherrick, N. Lozano-Gracia, and L. Anselin. 2012. “A Spatial Econometric Analysis of Loss Experience in the U.S. Crop Insurance Program.” Journal of Risk and Insurance.
Woodard, J.D. 2015. "Estimating Demand for Government Subsidized Insurance: Evidence from the U.S. Agricultural Insurance Market," SSRN Working Paper. Available online: http://papers.ssrn.com/sol3/papers.cfm?abstract_id=2826036
Woodard, J.D. 2016a. “Big Data and Ag-Analytics: An Open Source, Open Data Platform for Agricultural & Environmental Finance, Insurance, and Risk.” Agricultural Finance Review, forthcoming.
Woodard, J.D. 2016b. “Data Science and Management for Large Scale Empirical Applications in Agricultural and Applied Economics Res Research.” Applied Economic Perspectives and Policy, (published online: May 13, 2016)
Woodard, J.D. 2016c. “Estimation of Insurance Deductible Demand Under Endogenous Premium Rates.” Selected Proceedings Paper prepared for presentation at the 2016 AAEA Annual Meeting in Boston, MA. Available online: http://ageconsearch.umn.edu/bitstream/236151/2/EndogRateCurveDemand.pdf

