Economic shifts, regulatory change, and disasters always produce winners and losers. Whether or not these changes are good for the local economy, disasters both burden and provide opportunities for individual people, businesses, or groups—local and non-local. Disasters interrupt the stock and flow of resources for firm inputs, distort firm outputs, and alter service consumption patterns in local economies. Consequently, firm income changes are often followed by a redistribution of funds within the local area. Disasters also involve government planning and response, as well as aid for local communities. The 2014-2015 highly pathogenic avian influenza (HPAI) outbreak was the largest animal health disaster in the United States, involving the removal and disposal of nearly 50 million birds. An initial assessment of the local consequences suggests the outcomes from the HPAI outbreak resulted in fewer jobs, lower output, lower value-added, and decreased local, state, and Federal tax receipts (DIS, 2015a). Infected farms directly impacted by the disaster, and the non-infected farms not directly impacted by the disaster, realized different outcomes and consequences. Total social costs of the HPAI outbreak also included government investment for planning, surveillance, biosecurity, and stockpiling for preparation, response, cleanup, and indemnification.
Approximately $879 million was spent on the 2014-2015 HPAI outbreak and Fall planning activities according to data from USDA's Animal and Plant Health Inspection Service (APHIS). This is equivalent to 1.82% of the total poultry production value, including egg values (USDA-NASS, 2014). Approximately $200 million of the total mitigation expenditures were indemnity payments (USA Today, 2015) to farmers, growers, and companies, $610 million to response activities on premises according to USDA-APHIS, $34 million on Fall planning costs, and the remaining $35 million likely applied to overtime, travel, and supplies for Veterinary Services’ employees. Given the likelihood of future HPAI outbreaks and if HPAI becomes endemic in wild birds (USDA-APHIS, 2016d), it is prudent to move forward with an understanding of the likely outcomes on the local economy and the economic agents involved for mitigating and planning for future events.
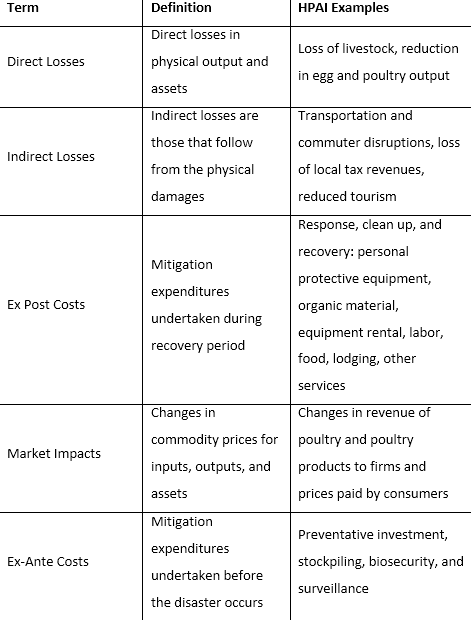
Small, rural, and local economies face both losses and costs because of livestock disease disasters such as HPAI. Table 1 provides a general overview of the types of losses and costs relevant to the 2014-2015 HPAI outbreak.
Along with economic losses and costs, disasters induce other outcomes, such as altered competition between firms, changes in the demand for inputs, and increased prices of services for mitigation and cleanup. Altered competition evolves from the direct impacts of the disease on some farms but not on others. This also includes the effect of non-local firms entering the locality in response to increases in the demand for labor, natural resources, and equipment. In the long run, these impacts—coupled with the occurrence of disease outbreaks in small, rural economies—modify income distribution and resource allocation that can further compound economic losses.
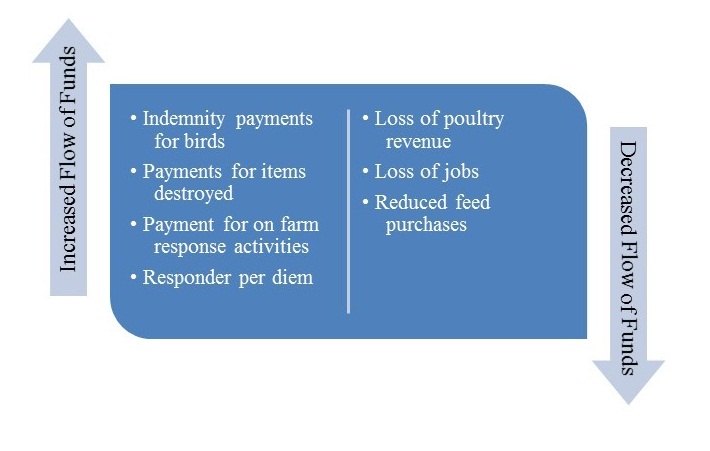
Different outcomes and consequences may be realized by infected premises and non-infected premises. Output prices can rise, making non-infected producers better off—though price fluctuations can be mitigated to some extent by contracts. Not only are infected producers worse off, but if prices increase as a result of these events at the retail level, then consumers can pay more for products. On the other hand, if prices decrease because of export bans on livestock or livestock products, then consumers can pay less for products. State and Federal governments bear many of the economic consequences for stockpiling, response, clean up, and disposal, while some businesses and services, local and non-local, can realize a temporary windfall. Examples of selected changes in the flow of funds to the local economy are shown in Figure 1.
Local economies experienced a major influx of State and Federal responders and contractors, as well as goods and services immediately after HPAI events. Long distances between outbreak locations in rural areas, increased competition, and demand for goods limited the availability of selected local inputs or services. Additionally, simultaneous HPAI events compounded and intensified response efforts, created bottlenecks, and increased costs. The major local response actions and constraints include the following:
Responders immediately needed transportation and lodging. Some responders realized additional search costs locating vehicles and transaction costs due to rental service representatives not always being available. Responders were housed in rural locations with limited hotel room options. Not surprisingly, the more scarce the number of rooms and the higher the willingness to pay for a room, the higher the price—the average increase was about 45%. Price-discrimination worsened in areas near resort locations during summer months. While some Incident Command Posts were established in hotels for convenience, others had technological issues, such as restricted internet and printing services, which forced them to drive to other locations to accomplish tasks, increasing costs.
Federal employees were required to use specific purchase credit cards for selected items; however, local vendors in some locations were not equipped to accept those cards. Responders cleaned and disinfected vehicles at local car washes. If a car wash did not accept a purchase card, for example, responders were forced to locate another option or use their own funds, potentially increasing risk and costs.
Animal disease outbreaks require an immediate demand for labor. Response efforts for the 2014-2015 HPAI outbreak required 1,220 deployments of Federal employees, as well as, numerous state employees, producers, and other labor to respond to the emergency situation. However, crews trained to operate foaming units were in short supply and had a low likelihood of being located in rural areas where infection occurred. To request more labor, the Resource Ordering and Status System (ROSS), which “tracks tactical, logistical, service, and support resources mobilized by the incident dispatch community” (FAMIT, 2016) was activated. Filling labor requests using this system could be time consuming. In addition, the Federal government requires medical clearances for occupational activities related to emergency disease response. These requirements apply to all Federal employees, both temporary and permanent, as well as contractors, and in turn can further delay labor availability and increase ex-post costs. Nevertheless, this system serves an important purpose, such as helping to avoid the long-term costs of hiring responders not meeting labor qualifications or with pre-existing medical conditions.
The stock and flow of rental equipment such as skid steers, loaders, dump trucks, and roll-off dumpsters also experienced changes. These changes were at times seasonal, especially during the warmer weather months, as disease response activities competed for identical resources with crews from the construction industry. During winter months, supplies like heaters, generators, and warming tents could be scarce.
Specialized equipment was also difficult to source. Thermometers used to examine compost efficacy were special order items since they were manufactured outside of the United States. Although proactive measures were taken in planning, preparation, and stockpiling for an HPAI event, the magnitude of the 2014-2015 events exceeded the capacity of the stockpile for certain items. The prolonged 2014-2015 HPAI outbreak weakened distributor inventories, especially for foam depopulation equipment and CO2 carts, and compelled upstream manufacturers to place these items on back order.
Foam depopulation was the most cost-effective measure of HPAI containment due to relatively low labor requirements and speed of depopulation (USDA-APHIS, 2015a), but high water consumption requirements for these machines at times challenged limited water sources and well recharge rates. During summer months, water usage was directed away from crop irrigation resulting in indirect losses. These factors induced transportation of water from other sources in plastic water tanks, but freezing conditions during winter rendered plastic tanks impractical.
When environmental and water supply factors precluded foaming depopulation, responders use carbon dioxide depopulation methods. However, CO2 canisters could not always be locally sourced and suppliers were hesitant to expose canisters to virus, presenting a constraint in meeting HPAI containment goals. Although these needs were recognized during planning and preparation exercises, the size of the 2014-2015 HPAI outbreak exceeded the stockpile capacity for certain items and created further logistical problems. Simultaneous infections in areas with substantial physical distances between flocks increased the demand and scope of these resources. In response, APHIS has evaluated National Veterinary Services’ strategy and is reviewing the acquisition of additional equipment which would be staged closer to high-risk geographic areas, which could decrease response time (USDA-APHIS, 2016d).
Disposal methods differed based on flock size and space, but composting and landfilling were used most frequently (USDA-APHIS, 2015a). Reductions in the supply of organic materials for composting grew as the outbreak continued, driving up ex-post costs. In certain places, disposal by landfill was available near concentrated outbreak areas, but sometimes it was hours away from the infected premises. Even with investments in planning and preparation for disposal, agreements with landfills to accept infected birds took time to negotiate. Ex-post HPAI costs increased as a result.
After disposal, organic materials were removed and barn surfaces cleaned and disinfected. Heating at 100-120 degrees Fahrenheit for seven days was the most cost-effective disinfection method. The average cost of cleaning and disinfection for commercial egg layers was $8 million, compared to just $170,000 for average turkey grow-out farms (USDA-APHIS, 2016b). This cost difference is attributed to infrastructure and production characteristics of layer farms having more barns and birds, as well as, cleaning and disinfecting layer cages is more labor intensive, in comparison to farms raising birds on the floor.
The two States hardest hit by the HPAI outbreaks were Iowa and Minnesota, with a loss of 32 million birds in Iowa (95% chickens) and 9 million birds in Minnesota (54% turkeys). Iowa accounted for 66% of the total birds lost in the United States, or 1.6% of the total production value of chickens (USDA-NASS, 2015). Decision Innovation Solutions (DIS) (2015b) reported 8,444 fewer jobs, $1.2 million in lower output, and $426.9 million in lower value-added in Iowa. Similarly, Minnesota accounted for 19% of the total birds lost in the United States, or 2.09% of the total production value of turkeys (USDA-NASS, 2015; USDA-NASS, 2014; USDA-APHIS, 2015c). Every 100 poultry jobs lost translated into direct loss of an estimated $27.3 million in poultry processing output (UMN Extension, 2015). These initial results are based on modeling exercises using standard impact analysis with economic multipliers to estimate losses, and are not the actual costs incurred during the outbreak.
The trend in the cost of response activities on premises and number of birds depopulated by week serve as a proxy for the demand of supplies, labor, and equipment in the local and surrounding communities. In Iowa, bird losses reach a peak of about 12 million in week 18 (Figure 2). In Minnesota (Figure 3), bird losses reach a peak of over 2.5 million in week 20. The average cost-per-bird for depopulation, disposal, and cleaning and disinfection activities exhibits more variation and increases over time in Iowa relative to Minnesota. The average cost-per-bird was $4.63 in Minnesota and $14.47 in Iowa. This totaled $463 million for Iowa and $42 million for Minnesota. The lower cost in Minnesota could be attributed to the operation type, as well as, lower demand for—and easier access to—equipment and labor. Limited availability of labor and other inputs drove up logistics costs and became constraining for responders working to depopulate quickly after disease detection to help contain disease spread. Also, it is cheaper to clean floor bird facilities as opposed to multi-vertical layer cages, and the majority of operations affected in Minnesota were turkeys. In January 2016, APHIS released the flat rate payments for virus elimination in preparation for future outbreaks in order to expedite payments to infected producers and improve efficiency in HPAI disease response. Those were $1.15, $3.55, and $6.45 per bird for broilers, turkeys, and layers, respectively (USDA-APHIS, 2016b). Flat rates, implemented in the January 2016 outbreak in Indiana, provided an incentive to producers to be efficient in completing virus elimination activities while environmental testing on site ensured the effectiveness of virus elimination activities on infected premises.
|
Figure 2: Iowa Cost-per-bird for
Response Activities on Infected Premises Over Time 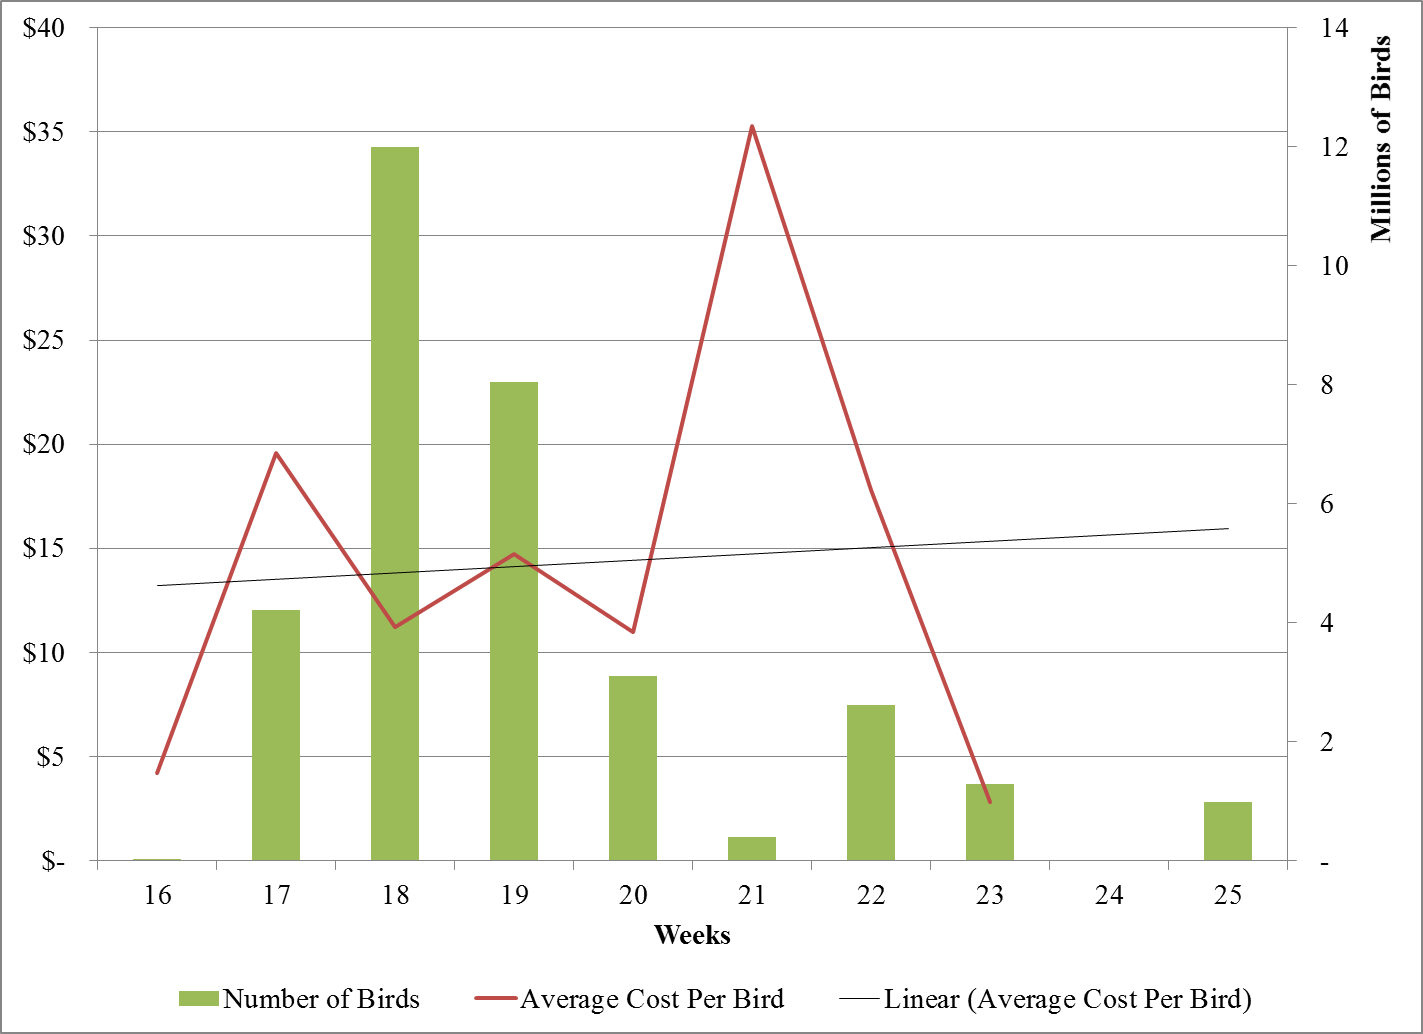
Source: USDA, APHIS, unpublished data. |
Figure 3: Minnesota Cost-per-bird for
Response Activities on Infected Premises Over Time 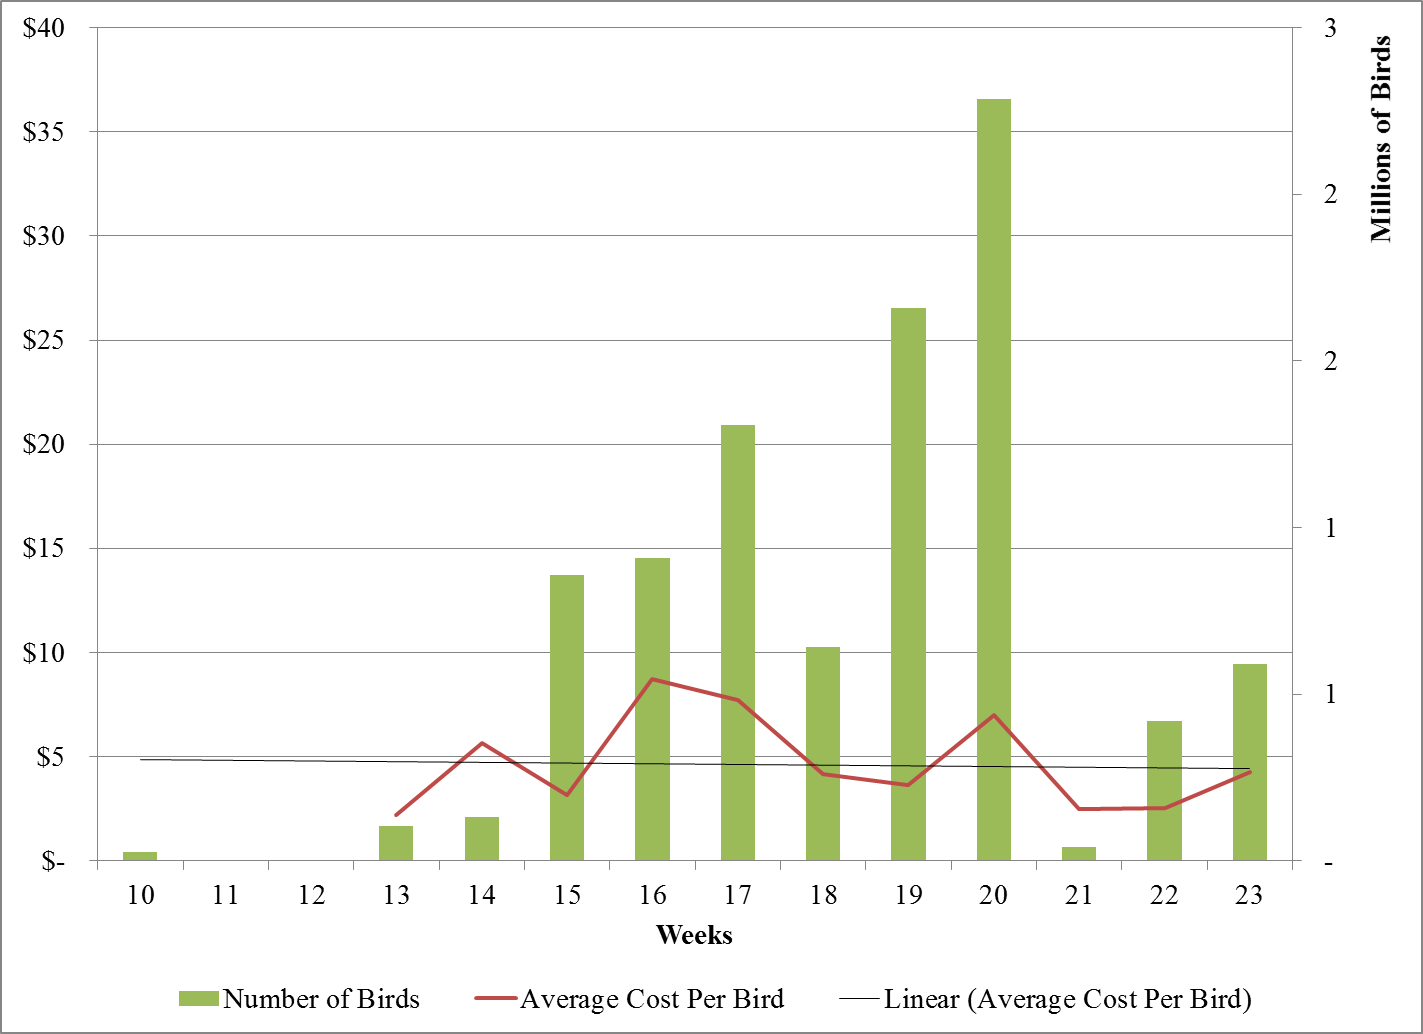
Source: USDA, APHIS, unpublished data. |
The demand for hotel rooms changed in response areas as the outbreak spread, which resulted in increased nightly hotel rates. The average rate in Minnesota (USGSA, 2015) started at per-diem early in the outbreak, and then increased over time to remain over per-diem. Rates in Iowa started at per diem, fluctuated and were over per-diem a majority of the time as well, but the increase over time was small. While a lodging waiver was approved to increase the nightly hotel rate above original per-diem rates, the original rates for 2015 were exceeded more often as the outbreak progressed. Some responders experienced consistent rates at per-diem, or slightly higher, during their deployment. In extreme cases, responders experienced some 15 different hotel rates during a 25-night deployment, with only two of those nights at per-diem and 23 over per-diem. The average nightly hotel rate in Iowa was $121.07 and in Minnesota was $118.87. Overall, the average hotel rate increased about 45% in Iowa and Minnesota.
The HPAI outbreak of 2014-2015 produced both winners and losers. The large influx of government responders and private contractors affected local communities in ways that were both expected and unforeseen. Subsequent changes in supply and demand altered the normal flow of goods and services within the afflicted economies, resulting in the redistribution of income between members of local municipalities as well as to others outside the local economy. Some realized benefits to their business (such as, hotels, restaurants, local supply, and equipment rental stores) while others realized costs and losses (such as, poultry producers, feed distributors, and processing plants). However, most recognized just how challenging HPAI could be, especially in small communities.
Small companies in the businesses of renting equipment or contracting experienced a much greater demand for equipment, even in nearby localities where the outbreak did not occur. There is some evidence that truck transportation output declined because of decreased demand for poultry production (DIS, 2015a). However, demand for truck transportation also increased due to disease mitigation. Whether or not the increased demand for truck transportation or temporary rental price hikes benefitted businesses in the long-run is an empirical question. In the short-run at least, it was apparent that business’ income changed during the outbreak.
The HPAI outbreak also affected input producers for the livestock industry. Feeds and other poultry production related goods were superfluous during the downtime in poultry production in control areas, leading to declines in output for animal food manufacturing and grain farming businesses (DIS, 2015a).
Consequences were clearly realized by the poultry producers themselves. Although contracts in the poultry sector tend to reduce price volatility, changes in revenue and capital were immediate for some poultry producers who were very close to sending products to market, including export markets. Their revenue from selling products on the open market was lost, and their expenses changed from providing food, water, care, and housing to poultry during disease response and cleanup. Producers were provided indemnification and cost recovery for response and cleanup, but this is not intended to cover all the economic costs. USDA-APHIS does not provide funds to cover production or income losses incurred during downtime or other business disruptions (USDA-APHIS, 2016a).
Expediting depopulation, cleaning, and disinfection in order to be cleared to restock poultry was a priority. Producers wanted to get back into business as soon as possible in order to smooth income effects of production downtime. As a result, producers incurred up-front expenses for cleaning activities for which they would possibly be reimbursed for in the near future. However, processing these payments from State and Federal governments required approval and time. To expedite the payments for virus elimination in future outbreaks USDA-APHIS developed the flat rates described above. Although indemnity and flat rate payments greatly helped to alleviate mitigation costs, HPAI created many substantial economic losses for those directly involved.
Preventative investments in planning and preparation, industry contracts, and instruments such as government price lists and per-diem agreements worked to mitigate response and cleanup risk and costs. Other strategic solutions include equipment staging, stockpiling and storage, labor acquisition and procurement plans. “Acquiring additional supplies to close [the] gap…between current supplies on hand and the projected needs of a worst-case scenario” has been an important planning step for mitigating future events (USDA-APHIS, 2015b). Nevertheless, strategic responses to disasters need continual improvement and updating, including enhancing risk management, flexible regulatory policy, and effective reorganizing.
Risk-based instruments such as livestock insurance for diseases have been proposed in the past. This topic, and writing continuity of business insurance policies for situations like HPAI, remains an open question for future research and discussion. During the 2014-2015 HPAI outbreak, no other non-government entities provided payments to producers besides APHIS, with the exception of some poultry companies and producers cost-sharing in the form of time, resources (such as, personal protective equipment), and expenses (such as, non-reimbursed time and utilities). In unique situations, the State provided a limited number of premises with indemnity or reimbursement for resources used in response activities.
Resource constraints have already caused difficulties in responding to a single disease outbreak in multiple states. The risk of another concurrent outbreak in other species occurring in different areas of the nation could further stress resources. Producers, consumers, and state and Federal governments need to respond cohesively to each emergency and allocate resources in the most effective manner.
Some, but not all states have sufficient resources to respond to animal disease outbreaks, depending on the size of the outbreak. The larger the outbreak, the more reliant states are on Federal resources for response efforts. The Federal government has recently evaluated and increased its resources dedicated to emergency response by revising third-party logistics contracts to “provide surge personnel and equipment to support states without sufficient resources (depopulation, decontamination, and disposal)” (USDA-APHIS, 2016c).
Several other observations are important. It is imperative to keep in mind the role of public health as well as animal health in all animal disease outbreaks, especially for potentially zoonotic diseases such as HPAI. Increasing the population density with response personnel stretches public health resources thin in rural communities, and stress on responders and ground-level workers certainly is real and important to acknowledge. Finally, tracking expenses in an effective manner for economic cost assessment is important for both State and Federal agencies to successfully assess the outcomes of disease events.
The experience has also highlighted what would be useful to know in the future. For example, little is known about the impact of market structure and contracts, as well as economies of scale and scope, on response costs. Additional specific areas that would be helpful to know include the impact of changing indemnity payment policies—such as a change to split payments, changing disease response policies—such as virus elimination flat rates, and changes in applications for unemployment benefits in states with infected sites balanced with the increased demand for local labor for disease response activities.
Decision Innovation Solutions (DIS). 2015a. “Economic Impact of Highly Pathogenic Avian Influenza (HPAI) on Layers in the U.S.”
Decision Innovation Solutions (DIS). 2015b. “Economic Impact of Highly Pathogenic Avian Influenza (HPAI) on Poultry in Iowa.”
FAMIT.2016. Resource Ordering and Status System (ROSS). Available online: http://famit.nwcg.gov/applications/ROSS
United States Department of Agriculture, Animal and Plant Health Inspection Service (USDA-APHIS). 2016a. “Appraisal and Compensation: What You Need To Know If You Have an HPAI-Infected Bird Flock.” Available online: https://www.aphis.usda.gov/publications/animal_health/2016/hpai_appraisal_compensation.pdf
United States Department of Agriculture, Animal and Plant Health Inspection Service (USDA-APHIS). 2016b. “HPAI Virus Elimination: Flat Rate Payments.” Available online: https://www.aphis.usda.gov/animal_health/animal_dis_spec/poultry/downloads/hpai_flat_rate.pdf
United States Department of Agriculture, Animal and Plant Health Inspection Service (USDA-APHIS). 2016c. “The HPAI Indemnity and Compensation Process: Start to Finish.” Available online: https://www.aphis.usda.gov/publications/animal_health/2016/hpai-indemnity.pdf
United States Department of Agriculture, Animal and Plant Health Inspection Service (USDA-APHIS). 2016d. “2016 HPAI Preparedness and Response Plan.” Available online: https://www.aphis.usda.gov/animal_health/downloads/animal_diseases/ai/hpai-preparedness-and-response-plan-2015.pdf
United States Department of Agriculture, Animal and Plant Health Inspection Service (USDA-APHIS). 2015a. “Avian Influenza Response: Mass Depopulation and Carcass Disposal.” Available online: https://www.aphis.usda.gov/animal_health/downloads/animal_diseases/ai/QA-MassDepopCarcassDisposal.pdf
United States Department of Agriculture (USDA-APHIS). 2015b. “Equipment and Supply Solutions for a Worst-Case HPAI Outbreak.” Available online: https://www.aphis.usda.gov/animal_health/downloads/animal_diseases/ai/equipment-supply-solutions-for-worst-case-outbreak.pdf
United States Department of Agriculture, Animal and Plant Health Inspection Service (UDSA-APHIS). 2015c. "HPAI 2014/15 Confirmed Detections.” Available online: https://www.aphis.usda.gov/aphis/ourfocus/animalhealth/animal-disease-information/avian-influenza-disease/sa_detections_by_states/hpai-2014-2015-confirmed-detections
United States Department of Agriculture, National Agricultural Statistics Service (USDA-NASS). 2015. “Poultry - Production and Value: 2014 Summary.” Available online: http://www.usda.gov/nass/PUBS/TODAYRPT/plva0415.pdf.
United States Department of Agriculture, National Agricultural Statistics Service (USDA-NASS). 2014. USDA/NASS QuickStats Ad-hoc Query Tool. Available online: http://quickstats.nass.usda.gov/
United States General Services Administration (USGSA). 2015. “Per Diem Rates Look-Up.” Available online: http://www.gsa.gov/portal/category/100120
University of Minnesota (UMN) Extension. 2015 “Impact of Poultry and Egg Production Losses and Poultry Processing Losses Due to the Avian Influenza.” Available online: http://www.extension.umn.edu/community/economic-impact-analysis/reports/docs/2015-impact-of-poultry-production-losses-due-to-avian-infuenza.pdf
USA Today. 2015. “Vilsack says bird flu scare may not be over.” December 29, 2015. Available online: http://www.usatoday.com/story/news/politics/2015/12/29/vilsack-says-birld-flu-scare-may-not-over/78036216/

