The 2015 highly pathogenic avian influenza (HPAI) outbreak was the largest animal health emergency in U.S. history. Two strains of HPAI (H5N2 and H5N8) were found in wild birds and domestic poultry, affecting 21 states. The greatest production impact occurred as a result of HPAI-H5N2, which infected poultry in Iowa and Minnesota. Iowa in particular has dense pockets of egg-laying farms and produced more table eggs than any other state in 2014 (U.S. Poultry, 2015).
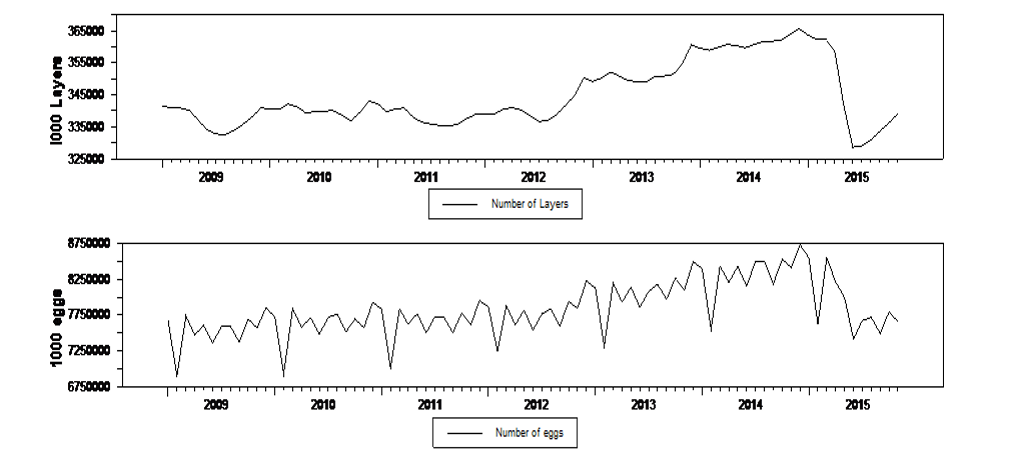
Source: USDA-AMS, 2015
The large decrease in laying-hen inventory in April 2015 reflects the period of heaviest depopulation of layer farms in the Midwest (Figure 1). Movement restrictions were established that prohibited birds, table eggs, or individual pasteurized eggs from infected premises from moving off-farm or entering commerce. Eggs from some infected premises had managed movements that permitted controlled liquid egg pasteurization, under the authority of State Animal Health Officials and USDA officials. Controlled or managed movement restrictions were also placed on non-infected poultry premises within a 10km control area around each infected flock—presumptive and confirmed—for egg and bird movements. The bird and egg movements from non-infected premises were approved by state and USDA response officials as part of the Secure Poultry Supply plans developed prior to the HPAI outbreak.
In addition to the decrease in eggs produced because of bird mortalities, bilateral trade sanctions limited the international demand for U.S. poultry products from the affected areas. These trade sanctions varied geographically, ranging from national trade sanctions put in place by a small number of countries to more common state and control zone trade sanctions. The United States exports a relatively small percentage of its annual egg production but lost over 10% of the national laying-hen inventory to the HPAI outbreak.
In aggregate, the 2015 HPAI outbreak restricted the supply of eggs on the market, leading to the highest egg prices observed in more than 30 years, after adjusting for inflation. The worst of the HPAI outbreak was restricted to the Midwest, but the impact of the price effects were seen across the country.
What Happened to the Cost of My Omelet?
Sometimes a disaster like HPAI happens that can drastically change the price of something you buy regularly. This is particularly true for our industries that have concentrated production and relatively few producers, such as the egg industry, and when consumers don’t greatly reduce how much they buy when prices go up. How does an industry respond to the resulting high prices? The egg production companies that are not infected with the disease respond by increasing production in other regions, but they might not increase production right away. The situation may have to reach a certain level of impact before the producers from other regions are motivated to change their behavior. These are “break points” or “break dates”, beyond which egg producing and consumer region relationships start to shift around in response to market signals. In response to expanding egg production, the price of your omelet goes back down. What about the price of your omelet next month, or next year? Understanding how egg supplies and prices will change in future months allows egg producing companies to plan how many chicks they will hatch that will lay eggs in the future, and it allows companies that trade internationally to negotiate terms and plan shipments. So new price information from each region in the face of a disaster like HPAI triggers a chain reaction of decisions, all of which eventually determine the cost of your omelet.
Using USDA-designated regions, Figure 2a plots the egg price series in the Midwest, Northeast, Southcentral, and Southeast regions of the United States from January 1, 2003, to December 11, 2015. Figure 2b focuses on the period just before and just after the HPAI outbreak. In these two figures, all four regional price series align. The volatilities of the four egg prices series increased at the end of 2014.
|
Figure 2a: Egg Prices, by Region,
January 1, 2003 to December 11, 2015 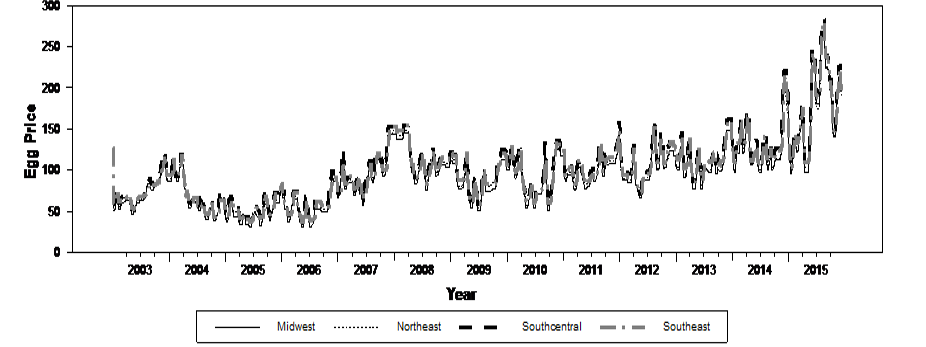
Source: USDA-AMS, 2015
|
Figure 2b: Egg Prices by Region,
January 1, 2013 to December 11, 2015 
Source: USDA-AMS, 2015
|
The decline in egg prices that began in late 2014 suggests that there were one or more unexpected shifts—so-called, structural breaks, by economists—in the egg price series since that time. According to USDA’s Animal and Plant Health Inspection Service (APHIS) stakeholder announcements, the first case of the HPAI-H5N2 virus in a U.S. commercial layer flock was confirmed in Jefferson County, Wisconsin, on April 13, 2015; about 200,000 egg-laying hens were depopulated on that farm. In Iowa, the top egg-producing state in the United States, the first case of HPAI in a large flock of egg-laying hens—4.2 million birds—in Osceola County was confirmed as infected by USDA's National Veterinary Services Laboratory on April 20, 2015 (USDA-APHIS, 2015). This incident was closely followed by HPAI infections on nine more laying-hen farms in Iowa in late April. After the Osceola flock confirmation in Mexico, one of the United States’ top egg shipment destinations, expanded its import ban to include live birds and eggs from Iowa. The price information flows among the four egg price series shown in Figures 2a and 2b may have changed in mid to late April. Rigorous statistical analysis found one break point in the egg price series in the Midwest, Northeast, and Southcentral regions and two break points in the egg price series in the Southeast region. Furthermore, prices from all four regions had a common break date of April 17, 2015. The Southeast region had one other break on August 15 2014. The break point on April 17, 2015, aligns with the timeline of movement restrictions on the first HPAI-H5N2 presumptive positive layer flock in the Midwest.
This finding might mean that when HPAI caused significant damage in the Midwest, the disease shock caused a shift in national egg prices. The Midwest is a major egg producing region. It is expected that a large HPAI event in that region could have consequences across the national egg industry, and the April 2015 break aligns with the timeline of disease spread. Perhaps the more interesting questions are how this break affected price discovery relationships across regions and what this meant for making egg price forecasts after the event.
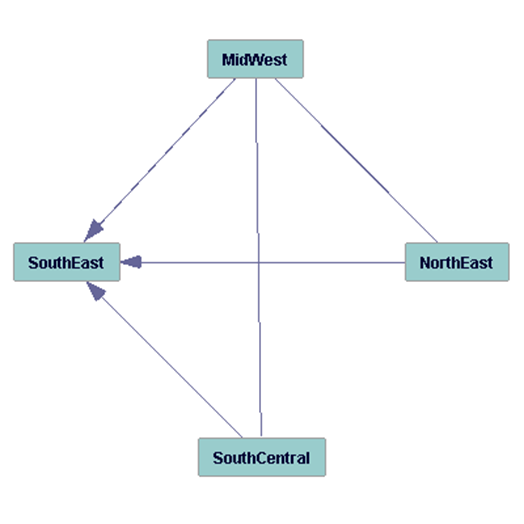
Note: Based on directed acyclic graph analysis.
Price discovery identifies the relative importance of new information arising from markets separated by space, time or form, as is the case for the U.S. table egg market. Based on advanced statistical techniques (Appendix), Figure 3 distills how price discovery might have occurred prior to the 2015 HPAI event. The Southeast price was influenced by price information that originated from the Midwest, Southcentral, and Northeast regions; however, price information generated in the Southeast region had no return influence on those three markets. Additional statistical analysis shows that information flowed from the Midwest region to the Southcentral region, but no relationship was found between the Midwest and the Northeast regions. The price in the Southcentral region performed as an information transmitter, and both the Midwest and the Northeast regions seemed to be information sources. This result makes sense, as states with the highest numbers of egg layers in 2014—1st Iowa, 2nd Ohio, 3rd Indiana, and 4th Pennsylvania—were in the Midwest region (U.S. Poultry, 2015). The Northeast region has a major human population and, therefore, is a prime area of egg consumption.
In comparison to the pre-HPAI relationships shown in Figure 3, Figure 4 shows the flow of market information within these four regions after HPAI infection was discovered in the Midwest in April 2015 until the December 2015. During this period, the shocks from the Midwest were driving egg prices in the Northeast, as was price information originating in the Southcentral and Southeast regions where egg producers might have absorbed the demand for eggs that the Midwest could not meet. There is only one undirected line in Figure 4—between the Midwest and the Northeast. This result makes sense given how HPAI-H5N2 affected the supply of eggs in the Midwest because of the disease and depopulation deaths of presumptive positive laying hens.
The Southcentral region was found to be an information transmitter, and both the Midwest and Southeast regions seem to be information sources. In the Southeastern region, Georgia and Florida are the largest egg producers, and in the Southcentral region, Texas is the largest egg producer (U.S. Poultry, 2015). The Northeast region has the highest human population and, therefore, accounts for the highest egg consumption, and would receive price effects from supply shocks resulting from HPAI.
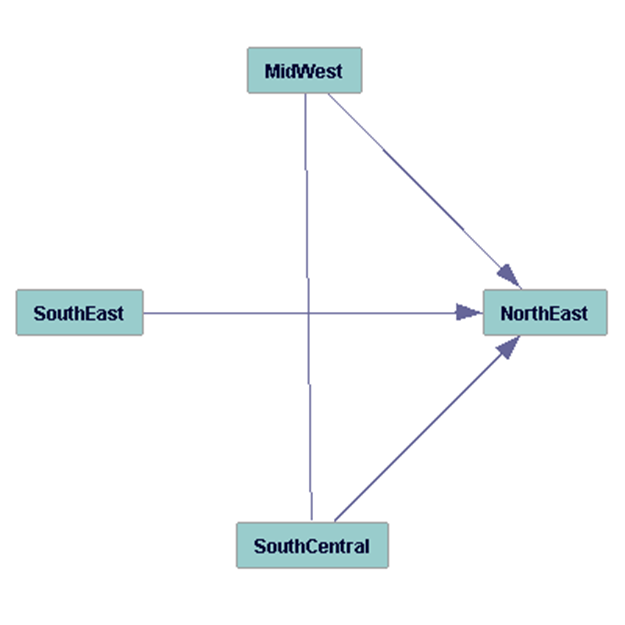
Note: Based on directed acyclic graph analysis.
In terms of relative importance of each region of the United States on egg price uncertainty 21 days ahead—about one month of business days— before the HPAI event information, production or consumption shocks arising in the Midwest, accounted for about 67% of its price uncertainty. New information—production or consumption shocks—from the Northeast accounted for about 17% of the Midwest price uncertainty—at 21 business days ahead—and less than 3% each for information arising from the Southeast and about 13% from the Southcentral regions. So clearly before the event, the Midwest was highly responsible for much of the new information and uncertainty in egg prices. After the event, things change. The Midwest continued to account for about 64% of new price information in the Midwest, but now the Northeast and Southcentral account for less than 3% of the price uncertainty in the Midwest and the Southeast jumps up to more than 33%. After the event the Southeast region has a much greater say in price information in the Midwest than it had before the HPAI event.
A similar pattern exists for other regions. The Northeast as a last example, saw 4% contribution of new information from the Southeast region on price in the Northeast region before the event—at the 21-day horizon—but saw this number jump to over 32% after the event. Again the Southeast region became a major contributor to new price information in the Northeast region after the HPAI event, along with the Midwest, which accounted for about 13% of the new price information in the Northeast before the event and 64% after the event.
Finally, the Southeast region accounted for less than 15% of new price information from 1 to 21 days before the event; whereas after the event, the Southeast region accounted for from over 90% (at two days or less ahead) to over 32% of its price uncertainty at 21 days ahead. This suggests that clearly the Southeast region became a more self-reliant region after the event.
Despite the catastrophic HPAI outbreak event in the Midwest in the spring of 2015, markets did adjust, resulting in changes in prices and price discovery across major producing and consuming regions in the United States. Of course producers and wholesalers understood the firm level aspects of this adjustment in real time, as they were actually working to negotiate price, to secure and unload product. What is possibly not known is how the aggregate data fit into an overall pattern of discovery. What regions turn out to be centers of price discovery? What regions offer no new information for other regions, but use new information arising in other regions? The bottom line here is markets work; old patterns of discovery disappear, as new patterns arise. The market is able to adapt. Even with contracts, people need eggs and inter-regional trade will have price implications across time and space.
The large HPAI outbreak in the Midwest did enough damage to cause a shift in national egg prices, which affected egg producers and egg consumers across the country, as shown by the common break point found on April 17, 2015 for the four regional prices. The HPAI-H5N2 virus was detected in commercial egg laying farms around this break date.
Two general conclusions can be made. First, economic events in one region of the country in egg production or egg demand can affect egg prices and ultimately egg production and egg consumption in other regions, particularly if the event occurs in a region with a high concentration of national production. Prior to HPAI, the Midwest region, a major egg producer, and the Northeast region, a major egg consumer, are the sources of price information in the United States. However, after the outbreak the Southeast region emerged as another source of price information. The Southeast region contains a few states with dense areas of layer farms. Interestingly, the Midwest region’s influence on the Southeast region’s price uncertainty was reduced after the event. That is to say, after the event, the Southeast region appeared to be more self-reliant and have greater price influence in other regions.
The HPAI event of April 2015 changed the price communication structure of the four U.S. regions and had implications for the Northeast consumption region and the Southeast and Midwest production regions. The Midwest region was not particularly influential on Northeast egg prices before the event, but after the event it became the dominant source of price uncertainty. It will be interesting to see, as the Midwest fully recovers to previous egg layer inventory levels, if these price relationships between the Midwest, Southeast, and Northeast regions remain the same or return to pre-HPAI status.
The second general conclusion is that developing forecasts to plan and budget for the future using short-term prices, i.e., less than a month, for one region should account for what is happening in the other regions. Local prices may not suffice. Regional communication around the time of the HPAI event showed up clearly in price forecasts. The interdependence among the four regional prices should not be ignored in forecasting prices.
Hall, Osborn and Sakkas (2013 and 2015) proposed two new information criteria, called the modified Bayesian and Hannan-Quninn criteria. See:
Hall A. R., D. R. Osborn, and N. Sakkas. 2013. “Inference on Structural Breaks Using Information Criteria.” Manchester School 81(3): 54–81.
Hall A. R., D. R. Osborn, and N. Sakkas. 2015. “The Asymptotic Behaviour of the Residual Sum of Squares in Models with Multiple Break Points.” Working paper, University of Manchester.
A directed acyclic graph (DAG) on contemporaneous price shocks presents the contemporaneous causal relationship among these four price series. A DAG is a directed graph with no directed cycles, which is formed by a collection of variables and directed lines. The assumptions behind the validity are given in Spirtes, Glymour and Scheines (2000) and further analysis is presented in Lai and Bessler (2015). See:
Lai, P., and D.A. Bessler. 2015. “Price Discovery Between Carbonated Soft Drink Manufactures and Retailers: A Disaggregate Analysis with PC and LiNGAM Algorithms.” Journal of Applied Economics 18(1):173-98.
Spirtes, Peter, Clark Glymour, and Richard Scheines (2001), Causation, Prediction, and Search. Cambridge, MA: The MIT Press, 2nd edition.
Dawid (1984 and 1985) provides the formal mathematics on probability forecasting systems. See:
Dawid, A.P. 1984. “Statistical theory: A Prequential Approach.” Journal of Royal Statistical Society 147: 278-297.
Dawid, A.P. 1985. “Calibration-based Empirical Probability.” Annals of Statistics 13: 1251-1273.
Bessler, D.A. 1984. “Analysis of Dynamic Economic Relationships: An Application to the United States Hog Market.” Canadian Journal of Agricultural Economics 32(1):109-24.
Dawid, A.P. 1984. “Statistical theory: A Prequential Approach.” Journal of Royal Statistical Society 147: 278-297.
Dawid, A.P. 1985. “Calibration-based Empirical Probability.” Annals of Statistics 13: 1251-1273.
Kling, J., and D.A. Bessler. 1989. “Calibration-Based Predictive Distributions: An Application of Prequential Analysis to Interest Rates, Money, Prices, and Output.” Journal of Business 62(4): 477-499.
Lai, P., and D.A. Bessler. 2015. “Price Discovery Between Carbonated Soft Drink Manufactures and Retailers: A Disaggregate Analysis with PC and LiNGAM Algorithms.” Journal of Applied Economics 18(1):173-98.
Lichtenstein, S., B. Fischhoff, and L. Phillips. 1982. “Calibration of Probabilities: The State of the Art to 1980.” In D. Kahneman, P. Slovic, and A. Tversky, ed. Judgment Under Uncertainty: Heuristics and Biases. Cambridge, UK: Cambridge University Press, pp. 306-344.
U.S. Poultry. 2015. “Economic Data.” U.S. Poultry and Egg Association. Available online: http://uspoultry.org/economic_data.
USDA Agricultural Marketing Service (USDA-AMS). 2015. “Egg Market News Report.” Available online: http://www.ams.usda.gov
USDA Animal and Plant Health Inspection Service (USDA-APHIS). 2015. “HPAI 2014-2015 Confirmed Detections.” Available online: https://www.aphis.usda.gov/aphis/ourfocus/animalhealth/animal-disease-information/avian-influenza-disease/sa_detections_by_states/hpai-2014-2015-confirmed-detections
USDA National Agricultural Statistics Service (USDA-NASS). 2015. “QuickStats.” Available online: http://quickstats.nass.usda.gov/

