Livestock disease trade restrictions were typically implemented at a national level prior to recent trade negotiations. Internationally negotiated sanitary agreements formalized the concept of regionalization where nations could be subdivided into disease-free and affected zones. The underlying assumption was that regionalization in conjunction with other control measures is a preferred strategy in the event of a disease outbreak because export losses often drive the loss in economic welfare. Regionalization allows exports from disease-free regions to continue. Analyses of potential highly pathogenic avian influenza (HPAI) outbreaks by Paarlberg et al., (2007) and the Livestock Marketing Information Center (LMIC) report by Johnson et al., (2014) do find such benefits.
Most analyses of regionalization rely on hypothetical outbreaks. In 2014 and 2015 the United States experienced outbreaks of two strains of HPAI. A total of 49.6 million birds, mostly turkeys and layers, were depopulated and both national and regional trade restrictions were imposed. The importer response to these outbreaks expanded the application of regionalization beyond previous experiences both in a geographic sense as well as using product differentiation. The economic analyses surrounding the 2014 and 2015 HPAI events provide lessons about future regionalization plans that enhance the understanding of the market and economic welfare effects of a disease outbreak and have implications for outbreak response.
The 2014 and 2015 HPAI economic analyses utilized an updated version of a U.S. agricultural sector model presented in Paarlberg et al., (2008) modified to split poultry into chicken meat and turkey meat. This revision is presented in the LMIC bulletin by Johnson et al., (2014). This quarterly model developed from the USDA annual baseline determines percentage changes from the baseline that result from a disease event. The HPAI analyses relied on a baseline updated in the spring of 2014 which was prior to the HPAI outbreaks. The major difference with more recent baseline values is that the baseline used did not include the rapid increase in U.S. egg and egg product exports that were occurring immediately prior to the HPAI outbreaks.
Scenarios analyzing the impacts of HPAI events on prices, quantities, and measures of economic welfare consist of assumptions about output reductions due to disease for poultry and egg products, control measures like movement restrictions, and reductions in poultry and egg product exports. Output reductions are product and region specific. Outbreaks in different flyways affect the extent of egg, turkey, or broiler depopulations very differently depending on regional production patterns. The output reductions assumed early in the HPAI event are from epidemiological modeling. Once the HPAI outbreak ended, actual depopulation could be analyzed. Control measures vary by region since they are linked to the density of production. Export reductions depend on the pattern of regional depopulation and trade partner response. Some trade partners ban imports of all poultry and egg products from the United States, but most trade partners limit imports from infected states, counties, or control zones. Trade restrictions can also be specific to the degree of processing. Export reductions analyzed are based on notifications by importing nations and the share of U.S. exports shipped to the trade partner. Reductions in product outputs and reductions in exports inserted into the model calculate estimated changes in prices and quantities. Those changes are used to determine changes in economic welfare.
In late 2014 and early 2015, H5N2 and H5N8 strains of highly pathogenic avian influenza appeared in commercial and backyard poultry flocks in British Columbia and the U.S. west coast. Initial epidemiological modeling for an HPAI event in the Pacific Northwest suggested a moderate commercial outbreak with geographic spread within Washington, Oregon, and California. An economic model was used to estimate the impacts of control strategies. For example, simulated control strategies assumed the removal of two million birds from existing national supplies which translated into small percentage production shocks of -0.2% or less for national broiler meat, turkey meat, and egg supplies. Consumers in the United States were assumed to react to price changes but not change their preference structure consistent with the results presented in Beach et al., 2008.
Because the responses of trading partners were not completely known, the initial assumption was that trading partners would react in a manner similar to their response to the Canadian outbreak immediately preceding the U.S. outbreak. That response signaled a greater willingness to regionalize outbreak related trade restrictions. The U.S. scenario assumed major trading partners—Canada and Mexico—would accept a state-level regionalization strategy as would eight other countries imposing restrictions. Korea was assumed to ban all U.S. exports for three months based on analyses by Johnson et al., (2012; 2104). In order to reflect state-level regionalization restrictions, the share a state contributes to national trade was assumed to be the same as its production’s share of total U.S. production. This translated into three-month reductions of 1.8% of total U.S. broiler meat exports, 0.3% of U.S. egg exports, and less than 0.1% reduction for U.S. turkey meat exports.
The willingness of importing countries to regionalize affected state’s trade previously rested on the assumption that the affected area would be quarantined from the rest of the United States. In 2013, Washington, Oregon, and California combined represented about 8% of U.S. egg production, but contained over 15% of the U.S. human population. For turkey meat, California represented 5% of 2013 U.S. turkey production with over 12% of the U.S. human population. Although state-specific trade data are not available, these numbers suggest each of the states is a net importer of these products. Because the three states involved in this simulation are deficit areas of poultry and poultry products within the United States, they were assumed to continue receiving product from the remainder of the United States when estimating the economic impacts rather than being isolated.
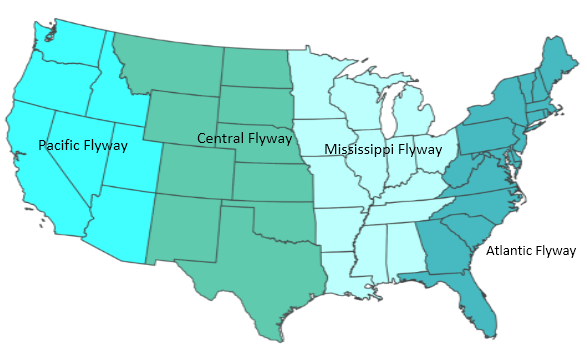
Estimated returns to the U.S. livestock and feed sector over the 2015–2017 years simulated fell by $376.8 million under this Pacific Flyway outbreak scenario. When there is no regionalization, import bans by trading partners against the states in the Pacific, Mississippi, and Atlantic Flyways (Figure 1) result in an estimated loss to the U.S. feed and livestock sector of nearly $2.2 billion. The estimated small decline in returns shows the benefits regionalization can have in mitigating impacts of disease outbreaks.
A second strain of HPAI (H5N2) was discovered in the Mississippi Flyway in early 2015, but did not spread extensively until March. Unlike the earlier cases in 2014, the 2015 HPAI cases were concentrated in states that are major turkey and egg production regions—Minnesota and Iowa. Iowa alone represented over 16% of 2013 egg production with about 1% of the human population. Minnesota accounted for over 15% of 2013 U.S. turkey meat production but had under 2% of the U.S. population. Such levels of production represent the potential for marked disruptions in supplies to other states. Volumes of eggs and turkey meat that might be confined to those states were in excess of what local residents could consume. For this scenario, the production reductions due to HPAI combined with permitted movements of lower risk product from the affected states exceeded the historic levels of exports from the affected states. In contrast, if surplus product had been “trapped” in the affected area, the analysis would have proceeded with the affected area isolated from market developments in the remainder of the country.

Note: Level at which Embargoes were applied to imports of U.S. poultry and poultry
products, April 28, 2015
The economic scenario was expanded to recognize that the large geographic spread of the HPAI incidents in the Mississippi Flyway would also result in expanded trade sanctions by trade partners. The estimated economic impacts for HPAI scenarios affecting both the Pacific and the Mississippi Flyways were based on domestic production impacts due to the disease of approximately 7% reductions in the quarterly U.S. supply of eggs and turkeys during the second quarter of 2015. The export shocks applied in the model were a 49% embargo on U.S. exports of turkey, an 18 to 21% embargo on broiler meat exports, and a 16 to 20% embargo on all egg and egg product exports each lasting 6 months. These export shocks were reduced to half of those percentages for an additional three months. These simulated embargoes recognized the large number of countries that limited trade restrictions to the affected states’ production (Figure 2).
Losses to the livestock and feed grains’ sectors in the United States for the 2015–2017 period simulated by the model under this outbreak scenario were estimated to be $1.2 billion to $1.4 billion. These changes in economic welfare for producers reflect the interaction between production losses and export declines which have opposing effects on price and the value of birds depopulated.
With the last cases of HPAI concluding in summer 2015, a third estimation of the economic impacts due to HPAI was undertaken using the production shocks derived from the total numbers of turkeys, layers, and pullets actually depopulated in 2015. As the larger outbreak progressed in the Midwest, importing countries adopted more focused regionalization schemes, some even going down to control areas. These were combined with product differentiation where processed products—originating in the infected areas and deemed to be of lower risk for HPAI spread—still flowed outside of the affected areas under permitted movements. The trade shocks used in the model resulted from the pattern of observed trade embargoes related to the HPAI outbreak in quarters one and two of 2015. In quarter three, export restrictions were half those imposed for quarter two and in quarter four of 2015, restrictions were half the quarter three export reductions to recognize the actual four month length of the outbreak and the further tightening pattern of regionalization applied.
The model estimates for eggs show that trade restrictions offset the production shock in the first quarter of 2015 causing wholesale prices to decline by less than 1%. By the second quarter, however, the larger production shocks were sufficient to outweigh the trade restrictions with egg prices increasing sharply. These higher prices from the output loss gave improved returns to the egg sector as higher returns to producers with eggs dominated lost returns to producers with infected birds (Table 1). In the third quarter of 2015, exports continued to be weak and egg production losses smaller, so sector returns declined.
For turkeys, first quarter 2015 production losses were lower than exports lost, so the turkey price fell slightly. In the second quarter, this relationship switched, leading to a small increase in turkey prices. In subsequent quarters, lost exports dominated the production loss, so turkey prices fell. Lower prices and lost output meant grower returns were lower. Output losses for broilers were less than 1%, but with exports down by up to 21% and exports representing 23% of production, prices fell slightly. As a result, returns to producers fell below the quarterly, no outbreak, baseline levels.
Reduced feed demand in the poultry sectors meant lower returns to crop producers of less than 1%. Returns to land owners adjusted slowly but also fell slightly. Lower feed costs benefitted cattle and swine producers with their returns up above baseline returns. For the feed and livestock sector, estimated losses in returns attributed to the outbreak, shown in Table 1 at $1.0 billion, were $200 million to $400 million less than the economic impact cited above. The series of analyses performed at various points of time during an actual HPAI event lead to several lessons and observations regarding regionalization of an HPAI outbreak.
Regionalization is relatively easy to implement for net importing regions as shown in the Pacific Flyway scenario because any production loss is balanced by increased imports by the state or region. This is similar to the observation that trade policy instruments to defend price support operations are easier to implement for importing nations than for exporting nations. This is the situation for the cases in Washington, Oregon, and California in late 2014.
In contrast, net exporting states fall into two categories: net exporters of small amounts of product and net exporters of larger amounts of product. If state production and consumption are close to equal and the net exporting states regionalized do not represent a large share of imports by the rest of the nation, then regionalization is similar to imposing a no-trade solution assuming low risk products are not allowed to leave the affected region under permitting. Therefore, regionalization would not be as disruptive to implement in this first category.
However, in a net exporting region with larger quantities of exports, regionalization can alter the pattern of economic welfare changes because it delinks prices. Prices for product trapped inside a region will fall to clear markets. Thus, consumers inside a region experience a gain in consumer surplus. Producers experience a loss in economic welfare beyond that associated with depopulation due to reduced income on remaining production. If exports of consumer-ready products are prohibited and consumers cannot fully consume the embargoed product, production facilities will respond with reduced shifts and production, and products which cannot be marketed may be destroyed. Given the spatial location of plants, market power may increase. Outside the region, poultry and egg product supplies are reduced, so prices increase. Price increases lead to lost consumer surplus but enhanced returns to producers in these unaffected regions. Even though lower risk products could be shipped from affected areas during the 2015 outbreak, supply disruptions for eggs led to large price increases and, in some instances, restrictions on the number of eggs purchased by consumers. If product had been trapped inside the affected states, even greater supply disruptions would have occurred.
Depending on the size of the embargoed region for net exporting regions with larger quantities of exports, contestability of the market outside of the embargoed region may be reduced which further increases price. If net exports by these regions are large relative to production and consumption is relatively small, then regionalization should be drawn more tightly around outbreak control zone areas rather than at more distant state boundaries. Or they should be augmented by permitted movement of low-risk product from the infected states to mitigate outbreak losses to producers. In situations like that seen in 2015, where states accounting for large shares of national production, such as Minnesota and Iowa, experience a disease outbreak, tighter control zones cause less supply disruption. Yet, the benefits of tighter control zones must be balanced against the risks of further disease spread beyond the zones.
Evaluating state-based regionalization requires knowing state-level trade flows. Limitations on the availability of state-level trade data hindered the analyses. Monthly production data is limited to key producing states. If outbreaks occur in other states, the only production data that may be available are those in the Census of Agriculture which is collected every five years. Data on state consumption of poultry products is also limited. In these analyses of HPAI events the assumption used is that per capita consumption is uniform across the United States, so population estimates can be used to infer state consumption levels. Consequently, state-based regionalization analyses rely on these assumptions and ignore differences in state consumption.
Control zones established at the sub-state level are virtually impossible to evaluate with the data currently available. County level production numbers are occasionally available from NASS state reports but coverage varies greatly by state due to confidentiality issues. Poultry product consumption values necessary to determine county flows must be generated from national per capita consumption and county population estimates.
The potential for regionalization linked to geography and product differentiation to reduce livestock disease outbreaks’ economic impact raises additional questions about the mix of disease control strategies applied to outbreaks of highly infectious diseases. If the overall economic impacts of disease are reduced by regionalization, the government expense and mix of response strategies could be reconsidered to determine the new optimal combinations of disease control strategies to be applied. For example, additional costs are incurred for surveillance to support regionalization and for administration of permitted movements of negligible risk product even though the outbreak size may not decrease. Regionalization does not uniformly lower economic impacts, so while many economic impacts are lowered, others are increased. Critical to implementation of regionalization is being able to understand and evaluate shifts in economic welfare as well as the total impact. Such shifts must be considered given the resources available to implement a regionalization strategy.
Earlier analyses of regionalization assumed that regionalization would embargo supplies inside the region while allowing exports to international trading partners to continue. Regionalization as implemented in the 2014 and 2015 HPAI event in the United States suggests a more nuanced approach with lessons for future events and economic impact assessments for other diseases. One lesson is the role the net trade position of the affected region plays. Net importing regions are easier to regionalize. For excess supply regions, allowing negligible risk products to flow outside a regionalized area mitigates the economic damage which might occur in an area, provided international trading partners accept these permitted movements rather than insist on full isolation of the affected region.
A second lesson is the importance of understanding how regionalization decisions alter price movements within and outside the region and consequently the impacts on economic welfare. Regionalization increases the need for state-level data in order to more accurately determine its benefits in reducing the economic impact of livestock disease outbreaks. These benefits can then be weighed against disease control responses and the associated costs which may alter the mix of disease control strategies.
Meat demand elasticities, a measure of how quantities demanded change with price, were updated from earlier published versions of the model. Elasticities for beef and pork are based on Tonsor et al., (2010). The broiler meat elasticity is an average of the values reported by Muth et al., (2006). The demand elasticity for turkey meat is constructed from elasticities reported for poultry and that used for broilers. The lamb meat elasticity is from Paarlberg and Lee (1998). The demand elasticity for eggs is the original value from Huang (1996). Elasticity of substitution values between the livestock intermediate inputs and capital for the poultry products and milk were reduced to lower the implied supply elasticities in order to give price changes consistent with those observed since the original model construction.
Beach, R.H., F. Kuchler, E. Leibtag, and C. Zhen. 2008. The Effects of Avian Influenza News on Consumer Purchasing Behavior: A Case Study of Italian Consumers’ Retail Purchases. Washington, D.C.: U.S. Department of Agriculture, Economic Research Service, Economic Research Report 65, August.
Huang, K.S. 1996. “Nutrient Elasticities in a Complete Food Demand System.” American Journal of Agricultural Economics 78(1): 21–29.
Johnson, K.K., A.D. Hagerman, J.M. Thompson, and C. Kopral. 2014. “Factors Influencing Export Revenue Recovery after Highly Pathogenic Poultry Disease Outbreaks.” International Food and Agribusiness Review, Special Issue: Factors Influencing the Global Poultry Trade, conditionally accepted.
Johnson, K.K., A. Hillberg Seitzinger, P.L. Paarlberg, K.L. Stone, and D.L. Pendell. 2012. “Export Recovery in the Face of Disease Outbreaks: A Summary of Findings for Various Diseases and Species.” Paper presented at International Symposium on Veterinary Epidemiology and Economics, Maastricht, Netherlands, August.
Johnson, K.K., P.L. Paarlberg, A. Hillberg Seitzinger, S. Ott, and D. Anderson. 2014. Analysis of Hypothetical Highly Pathogenic Avian Influenza Outbreak in Texas on the Supply Chain. Livestock Marketing Information Center (LMIC), December. Available online: www.lmic.info.
Kapombe, C.M. 1998. “Chapter 3: Broiler Exports: A Structural Time Series Approach.” Trade Policy and Competition: Forces Shaping American Agriculture Proceedings. Southern States Cooperative Series Bulletin No. 390, November.
Muth, M.K., R.H. Beach, S.A. Karns, J.L. Taylor, and C.L. Viator. 2006. Poultry Slaughter and Processing Sector Facility-Level Model. RTI International. April.
Paarlberg, P.L., A. Hillberg Seitzinger, and J.G. Lee. 2007. “Economic Impacts of Regionalization of a Highly Pathogenic Avian Influenza Outbreak in the United States.” Journal of Agricultural and Applied Economics 39(2): 325–333.
Paarlberg, P.L., A. Hillberg Seitzinger, J.G. Lee, and K.H. Mathews, Jr. 2008. Economic Impacts of Foreign Animal Disease. Washington, D.C.: U.S. Department of Agriculture, Economic Research Service, Economic Research Report 57, May.
Paarlberg, P.L. and J.G. Lee. 1998. “Import Restrictions in the Presence of a Health Risk: An Illustration Using FMD.” American Journal of Agricultural Economics 80(1): 175–183.
Patyk, K.A., J. Helm, M.K. Martin, K.N. Forde-Folle, F.J. Olea-Popelka, J.E. Hokanson, T. Fingerlin, T., and A. Reeves, 2013. “An Epidemiologic Simulation Model of the Spread and Control of Highly Pathogenic Avian Influenza (H5N1) among Commercial and Backyard Poultry Flocks in South Carolina.” Preventive Veterinary Medicine. Available online: http://dx.doi.org/10.1016/j.prevetmed.2013.01.003.
Tonsor, G.T., J.R. Minert, and T.C. Schroeder. 2010. “U.S. Meat Demand: Household Dynamics and Media Information Impacts.” Journal of Agricultural and Resource Economics. 35(1):1–17.
U.S. Department of Agriculture, National Agricultural Statistical Service (USDA-NASS). Agricultural Statistics. Washington, D.C. Various years.
U.S. Department of Agriculture, National Agricultural Statistical Service (USDA-NASS). Census of Agriculture, 2007. Washington, D.C.
Watt Poultry USA Directory. 2013. Poultry Processing, Further Processing Plants, Poultry Plants Directory. Available online: www.WattAgNet.com.

