The ongoing consolidation within the farm and credit sectors have impacted the role of the U.S. Department of Agriculture (USDA) Farm Service Agency’s (FSA) farm credit programs (USDA-FSA, 2016). These structural changes have contributed to the emergence of distinct market segments in agricultural lending, each with unique risk profiles. In the farm sector, at one end are small, non-commercial farms that are not—on average—profitable and whose operators rely on nonfarm income. At the other end are large commercial farms with complex business structures and multiple operators which depend on farm income for family living as well as debt servicing. Moreover, consolidation in the credit sector has resulted in fewer and larger institutions and may have increased the demand for FSA credit programs.
FSA direct and guaranteed loan programs are delivered through distinctly different mechanisms. Direct loans are made and serviced by FSA county office staff. Although local offices may get direction from the State and National offices, decisions regarding a direct loan are made primarily by local staff. Guaranteed loans are originated and serviced by qualified commercial, cooperative, or nonprofit lenders. Applications for a loan guarantee are made by qualified lenders to a local FSA office. Under a loan guarantee, FSA guarantees repayment of up to 95% of the principal balance. All loan guarantees are loss sharing, which means FSA will reimburse the lender for losses incurred in the case the loan goes into default, including loss of loan principal, some accrued interest, and certain liquidation costs. For more information on FSA farm loan types, maximum loan amounts, terms, and purposes, see USDA-FSA, 2015 and 2016.
FSA farm loan programs have historically provided credit to family-operated farms experiencing temporary financial difficulties. While this has not changed, consolidation has made the concept of the family farm more nebulous. The traditional family farm operated by one full-time farmer and spouse is giving way to larger farms with complex business structures and multiple operators. What may have been considered a full-time family farm a few decades ago would now likely be considered a small, noncommercial operation. Among farms with under $350,000 in gross cash farm income in 2011, a majority of household income came from nonfarm sources and two-thirds did not consider farming as their primary occupation (Hoppe, 2014). As agricultural production becomes increasingly dominated by fewer and larger farms that are presumably more economically efficient, some may question whether there is a need for FSA credit programs. Further, the prevalence of small farms which rely on nonfarm income may lead to further questions about FSA’s role as a credit source.
It may be, however, that farm consolidation actually results in a greater need for FSA credit programs. The broad policy role of all federal credit programs is to alleviate credit gaps resulting from market failures. Farm credit markets are generally considered susceptible to market failures, primarily as a result of imperfect competition or information asymmetries between the borrower and the lender (USDA, 2006). Information asymmetries occur because some lenders lack sufficient information with which to properly evaluate farm loan requests. Beginning farmers, for example, may have difficulty persuading lenders of their repayment ability because of their shorter track record.
Generally, the uniqueness of farming and its income variability and uncertainty is considered to make informational asymmetry more likely. Irrespective of the economies of size and scale gained through higher production, consolidation can increase market asymmetries as organizations become more complex and capital needs increase, resulting in a greater need for both FSA direct and guaranteed loans. And, while small farms may account for a small share of overall farm production, these farms have a large share of farm assets, represent a large share of the farm population, and are the primary channel through which beginning farmers enter farming. As such, a public policy role exists to alleviate credit gaps for small farms.
Consolidation is a global economic phenomenon driven by economies of size and scale that has resulted in farms becoming larger and accounting for an increasing share of farm production. O’Donoghue et al. (2011) show that average operating profit margin is negative for U.S. farms with under $100,000 in sales, but turns positive and continues to increase as farm sizes become larger. An increase in operating profit margin may come from efficiency gains, lower input costs, higher outputs prices, or some combination. Additional economic advantages may be achieved through tighter alignments across production and distribution chains (Gray and Boehlje, 2005).
a Farm size groups are determined using value of farm production
deflated by USDA-NASS price indices (2014 = 100).
Source: USDA-ARMS, 1996-2014.
a Farm size groups are determined using value of farm production
deflated by USDA NASS price indices (2014 = 100).
Source: USDA-ARMS, 1996-2014.
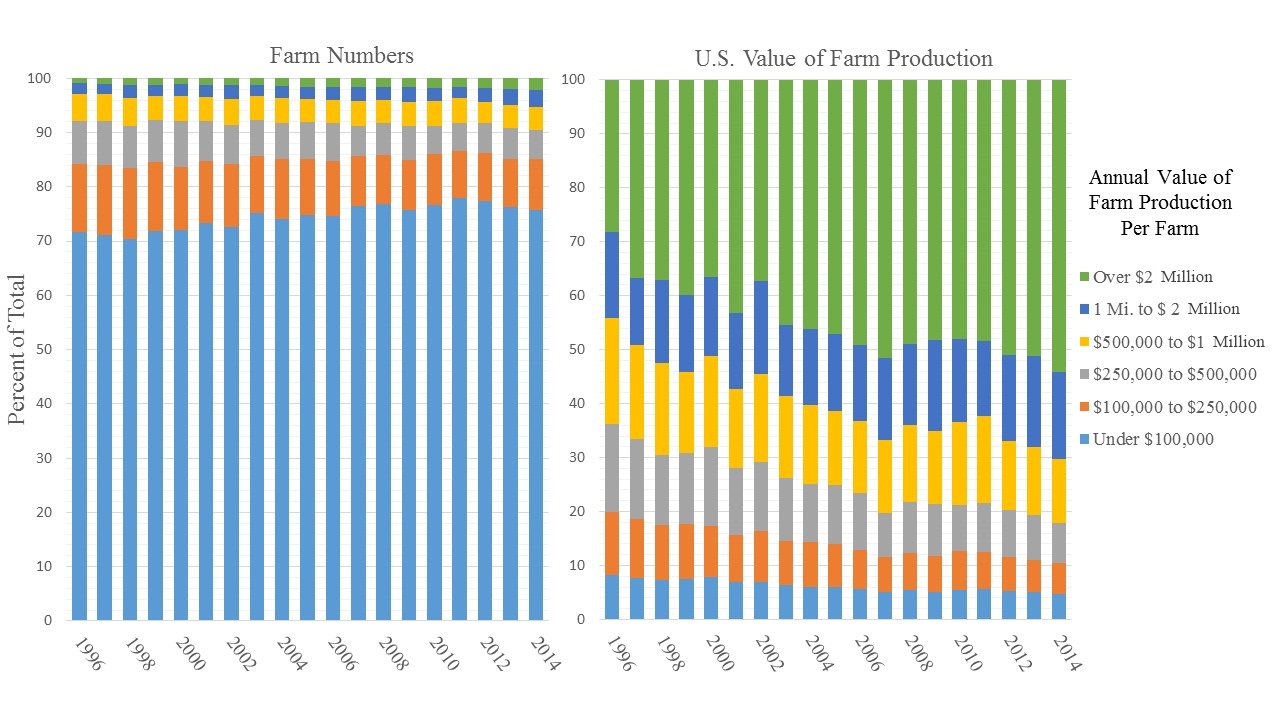
There has been a sizable shift in the value of U.S. farm production to larger farms even after commodity prices are adjusted to 2014 values (Figure 1). From 1996 to 2014, the share of farm production from farms with over $2 million in production has nearly doubled, from 28% to over 54%, and their share of total farm numbers has increased from 1% to 2%. While farms with $1 million to $2 million in farm production started and ended the period with a 16% share of total farm production, their share of farm numbers increased from 2% to 3%. The smaller farm groups experienced declines in shares of farm production and farm numbers with the exception of the smallest farms. Although small farms of under $100,000 in production also experienced a decline in their share of farm production, decreasing from 8% to 5%, their share of total farm numbers increased from 72% in 1996 to 76% in 2014.
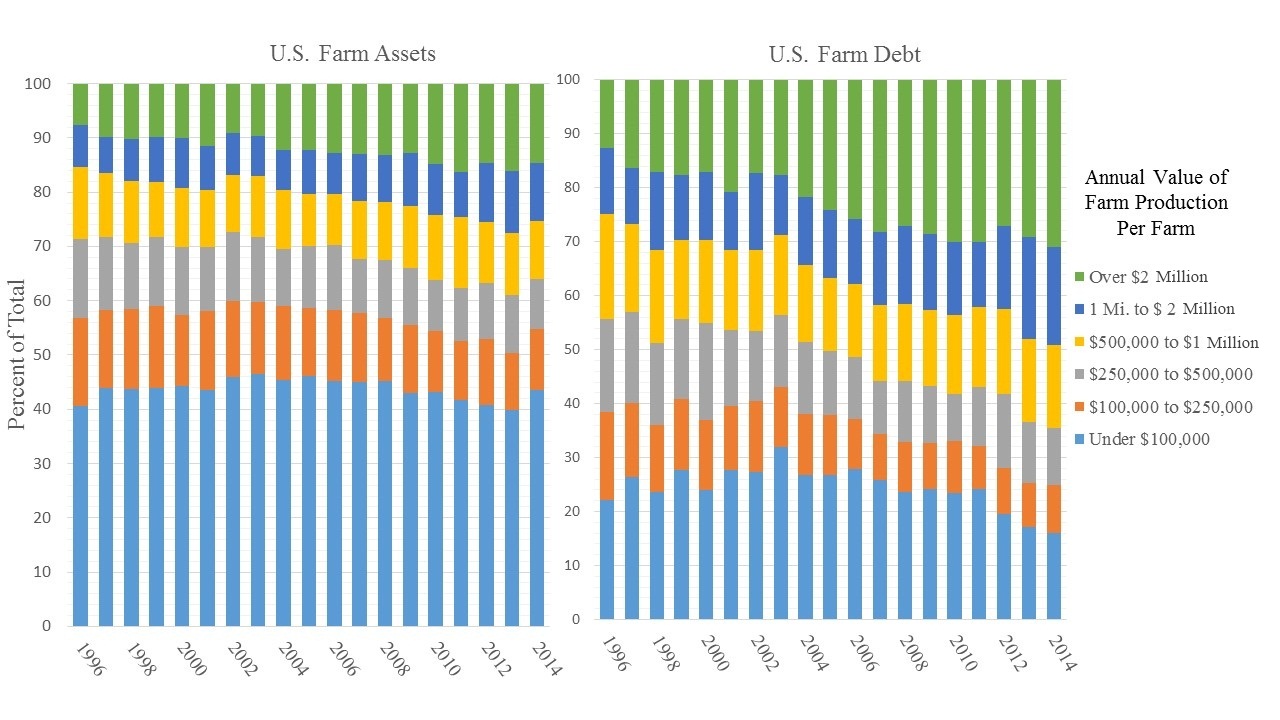
Correspondingly, there has also been a shift in different farm sizes’ shares of farm debt and assets. In 1996, 13% of farm debt was owed by farms with over $2 million in farm production, with the share increasing to 31% in 2014 (Figure 2). Although not as large of an increase, the share of assets controlled by these large farms increased from 8% to 15%. There also have been increases in the shares of farm debt and assets associated with farms having $1 million to $2 million in production. For farms with under $1 million in production, the shares of total debt and assets declined for all size categories over the past two decades, with the exception of the share of assets held by small farms. Farms with under $100,000 in farm production experienced a small increase in their share of assets, from 41% in 1996 to 43% in 2014.
While farms with less than $100,000 in production contributed only 5% to overall farm production, at 76% they represented a majority of the farm numbers and controlled the large share of farm assets at 43% in 2014. Based on the USDA's Agricultural Resource Management Survey (ARMS) data, three-fourths or more of small farm debt has been real estate debt and average farm income to these small farm households has been negative for the past 19 years. The predominance of real estate financing with repayment tied to nonfarm income makes financing this group similar to the residential mortgage market. With a reliance on nonfarm income, their risk profile is more likely to be influenced by regional factors such as unemployment and average wages.
While real estate debt as the dominant type of debt used by small farms has not changed over the past 19 years, the demand for debt by operators of small farms has declined. In fact, for all farm groups under $1 million in farm production, the shares of farms using debt has fallen (USDA-ARMS, (2016). For example, the share of farms under $1 million in farm production using debt fell from 34% in 1996 to 22% in 2014. A possible explanation is that their low or negative returns, combined with greater capital investment—often funded from nonfarm income or wealth—limits the use of debt. And, for those small farms that do not possess sufficient nonfarm income or wealth, lenders are likely to be reluctant to provide credit to operations at the margin. Even though most small farm operators neither consider farming to be their primary occupation nor do they rely on farm income, they may still be eligible for FSA credit programs. As long as an applicant supplies most of the farm labor, a part-time operator can be eligible for FSA credit provided all other loan eligibility criteria are met. The requirement that an FSA farm loan borrower be unable to obtain credit elsewhere, despite an ability to show repayment and provide adequate security, suggests the presence of credit gaps.
As a result of farm consolidation, more farm debt is now held by complex organizations with greater variability in household income and greater reliance on production contracts. Over the past 19 years, more than half of all farms with over $2 million in production have been organized as a partnership, corporation, or trust. Unlike smaller farms, farms with over $500,000 in production received more than half of household income from the farm (USDA-ARMS, 2016). This reliance on farm income implies household income is more variable for larger farms because farm income tends to be more variable than nonfarm wages and salaries.
While larger farms are more profitable, they may also be more subjected to economy-wide systematic risk. For example, farms with over $2 million in production are more reliant on production contracts than smaller farms. These contracts may provide an above-market price in return for delivery of products that satisfy quality standards set by the contractor. But, these farms could also be more vulnerable to general economic downturns, which could cause the contractor to either cancel or renegotiate the production contract—as sometimes occurs with broilers. Also, it may be possible that larger farms may increase systematic risk if their failure adversely affects other firms. For example, the fortunes of a large farm may be intertwined with other firms, such that the failure of one large farm adversely affects others in the production or distribution chain.
Sources: Federal Financial Institutions Examination Council,
Reports of Condition and Income (Call Reports), Farm Credit
Administration Call Reports, and FSA Guaranteed Loan System,
September 30, 2015.
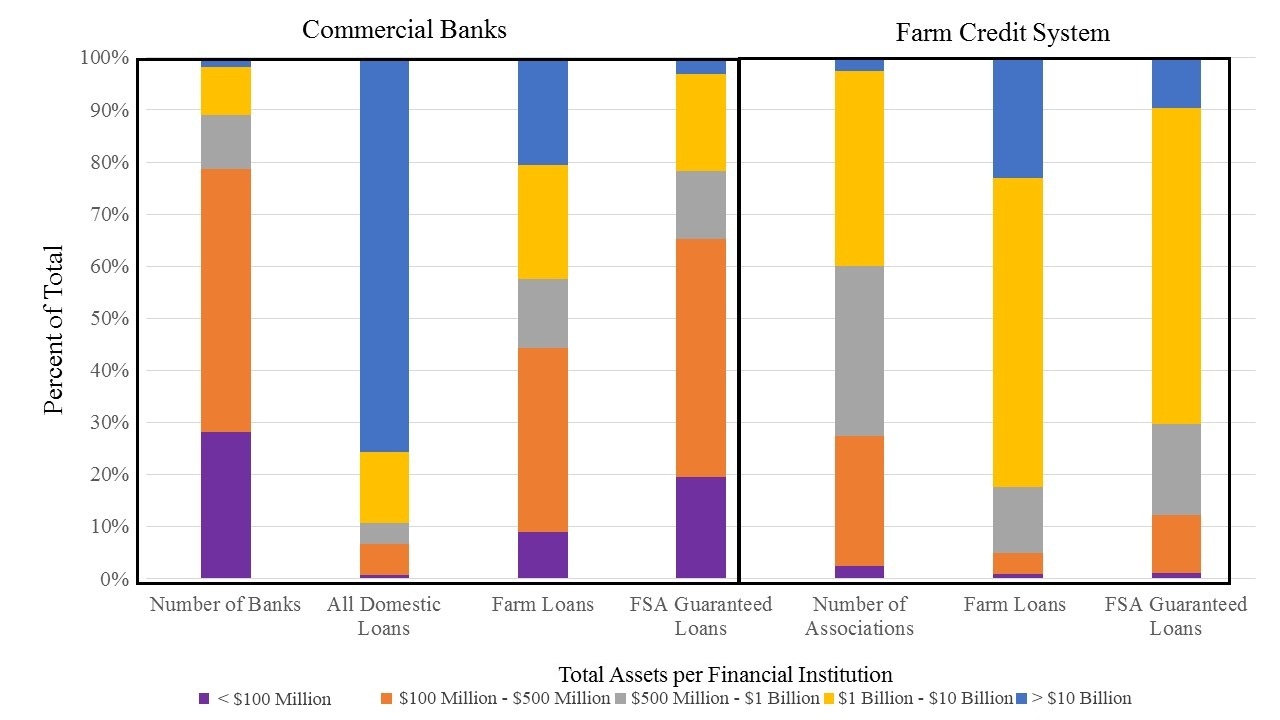
Consolidation has been especially apparent in the banking industry, where a handful of large banks now dominate. Nearly 90% of all domestic bank lending now occurs through banks with over $1 billion in assets (Figure 3). The Nation’s Farm Credit System (FCS) has also been undergoing consolidation, with 83% of all farm lending delivered by institutions with over $1 billion in assets in 2015. FSA loan guarantees are typically a small share of large financial institution lending. This is true for both banks and FCS. Banks of over $10 billion represented 21% of the banking sector’s agricultural loan portfolio but only 3% of FSA guarantees of bank debt. Likewise, FCS institutions of over $10 billion represented nearly a fourth of all FCS farm lending, but only 10% of FSA guarantees of FCS debt.
Even though the financial services sector has become increasingly consolidated, smaller institutions still supply a large share of agricultural credit and rely more heavily on FSA guarantees to do so. At 42% of the U.S. farm debt market in 2014 (USDA-ERS, 2016), commercial banks represent the largest lender to agriculture; much of this is done by small community banks with less than $500 million in assets. And at 40%, the FCS also has a significant share of the farm debt market. While FCS has greatly consolidated, a sizable amount of its lending is still undertaken by smaller institutions. Banks and FCS institutions with less than $1 billion in assets provided over 40% of the credit supplied by banks and the FCS.
Small community banks, in particular, are the most dependent on FSA guarantees. In 2015, 65% of FSA guarantees of commercial bank loans were through institutions with less than $500 million in assets (Figure 3). This reliance on guarantees reflects the challenges faced by smaller community banks in handling risk associated with the large credit needs of today’s commercial farms. Relative to large banks, the potential losses from larger loans are more likely to adversely affect a small bank’s capital position. As was hypothesized for farm consolidation, lender consolidation may also increase demand for FSA credit programs. As banks consolidate, a greater share of farm lending may be undertaken by smaller community banks. Correspondingly, as farms consolidate and loan size increases, these smaller community banks may have to rely more heavily on FSA guarantees to manage their risk.
Policy responses to consolidation have mostly focused on loan limits and the targeting of loan funds to specific groups. Over the past 25 years, the average indebtedness of both direct and guaranteed borrowers has increased. Since 1996, guaranteed loan limits have been indexed to the NASS price index and in 2016 the limit was $1.4 million in total guarantee indebtedness. Loan limits for direct programs are set by statute at $300,000 each for Farm Ownership (FO) and Operating (OL) loan programs and were last increased with the 2008 Farm Bill. But these loan limits, even for the guaranteed program, restrict the ability to meet the credit demands of some large farms. Since federal fiscal year 2000, about 3% of all guaranteed borrowers were at the loan limits for new loans according to FSA data. Despite annual increases in the loan limits for the guaranteed program, the share has remained between 3% and 4%. Over the same period, 5.6% of borrowers receiving direct FO or OL loans were at the maximum. While a small percentage of borrowers were affected by loan limits, these loans represented 9.3% of all new guaranteed loan obligations and 10.8% of direct FO and OL loan obligations.
Since some farms are at the maximum FSA loan limits and use a disproportionate share of the credit available, joint financing of commercial and FSA loans may be used to meet credit needs and further extend the use of FSA credit. If there is sufficient collateral to securitize the loan, FSA can subordinate their lien position when joint financing is used, resulting in FSA having a greater exposure to losses than the commercial lender.
Capital requirements can be onerous for beginning and socially-disadvantaged farmers, who are likely to be small and capital constrained. Accordingly, the share of loans targeted to specific groups has increased, especially for FSA direct programs, where over 80% of borrowers belonged to a targeted group in 2015. As commercial lenders focused on lending to larger commercial farms, many smaller farms have found it more difficult to obtain financing. This is because loan sizes requested by small farms may not be economical for commercial lenders. Consequently, operations desiring smaller loan amounts may be forced to use credit cards or other similar high-cost debt instruments. In response to these issues, FSA introduced a direct OL microloan program in 2013 for these purposes.
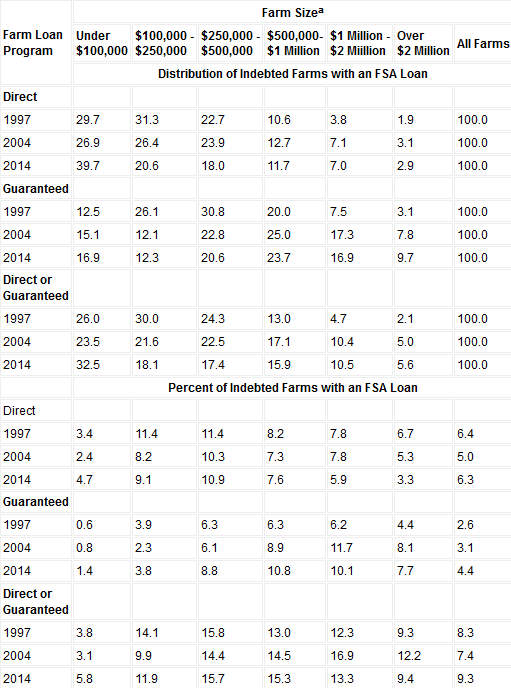
As a consequence of consolidation and resulting policy responses, the market segments served through each program have become more distinct, with the FSA direct loan program serving more small farms while the guaranteed loan program tends to serve larger farms. From 1997 to 2014, the shares of both FSA direct loan borrowers and guaranteed loan borrowers from farms with $100,000 to $500,000 in production declined (Table 1). Among farms with a direct loan, lending shifted to farms with under $100,000 in production, which increased from 30% in 1997 to 40% in 2014. Among farms with an FSA guaranteed loan, lending shifted toward farms with over $500,000 in production, where the share of farms with a guaranteed loan increased from 31% in 1997 to 50% in 2014.
The segmentation of FSA direct and guaranteed borrowers reflects statutory and other phenomena. By statute, the FSA direct loan program is mostly targeted to beginning and socially-disadvantaged groups, who are more likely to operate small, non-commercial size farms. The FSA guaranteed loan program, which has larger loan limits, less targeting, and a greater creditworthiness threshold, is more likely to serve commercial-sized family farms.
Guaranteed loan borrowers are much more likely to have a direct loan than vice-versa. At the end of fiscal year 2015, only 9.5% of all FSA direct and guaranteed borrowers had both direct and guaranteed loans outstanding. Most of the overlap was among guaranteed loan borrowers, where one in four guaranteed loan borrowers also had a direct loan. In contrast, only 12.6% of direct loan borrowers also had a guaranteed loan. This suggests that direct loans actually serve a broader spectrum of farms than guaranteed loans, and that direct loans serve a group of farms less likely to receive commercial credit.
Even though the largest share of FSA direct lending went to farms with less than $100,000 in farm production in 2014, less than 5% of all indebted farms of this size had a direct loan (Table 1). The greatest share of indebted farms with an FSA direct loan had between $100,000 and $500,000 in production. In contrast, the greatest share of farms with an FSA guaranteed loan had $500,000 to $2 million in production. In 2014, over 10% of indebted farms with $100,000 to $2 million in production had either a direct or guaranteed loan. While most farms with an FSA direct or guaranteed loan had less than $250,000 in production, larger farms are more dependent on FSA programs for their credit needs. Due to their income variability and tight profit margins, farms in these size groups may be especially vulnerable to credit constraints.
While farm consolidation implies greater economic efficiency, it does not necessarily imply a reduced demand for FSA credit. Farms with under $100,000 in production have been increasing in number, and FSA’s presence among those farms has been growing. While these farms contribute little to total U.S. farm production and are not generally profitable, they represent the largest population of U.S. farms and control a substantial share of farm assets.
Larger farms, especially those of over $250,000 in annual production, tend to be much more reliant on both direct and guaranteed FSA credit and are likely to become more dependent on FSA for several reasons. As farms continue to become larger, commercial lenders are likely to increase their demand for Federal guarantees, especially if smaller community banks continue to be a major provider of agricultural credit. With greater concern for managing the economy-wide systematic risk associated with serving larger farms, there may be a greater propensity to pursue guarantees, even among more creditworthy farms—especially given that expectations of lower farm incomes and softening land values will likely result in more farm businesses pursuing both direct and guaranteed loans.
Limited budgetary resources, however, may make it difficult to meet any increase in loan demand. Strong farm incomes and increasing asset values have resulted in limited losses in recent years, which in turn, have enabled FSA to deliver these loan programs at low cost to the government. The subsidy cost—which measures the government’s budget cost—has fallen from 4.8% in 1996 to 0.8% in 2017 according to the Office of Management and Budget. Consequently, Congress has been able to fund FSA lending programs with less budget authority. With expectations of lower farm incomes, loan losses are likely to increase in upcoming years, which would increase subsidy costs. Also, farm loan staffing levels have been declining since 2010, placing additional constraints on FSA’s ability to meet any increase in demand.
Without increased resources, policy makers and FSA may need to examine options for extending limited resources. Federal guaranteed loans are typically significantly less costly to deliver than loans made and serviced directly by a government agency (Gale, 1991). Hence, one possibility would be to transfer resources from direct to guaranteed lending. Given the distinct market segments served by each program, this could adversely affect beginning farmers and other groups served by the direct program.
Another alternative would be to focus lending resources on those groups that are most dependent on FSA credit. These groups include direct borrowers with annual production between $100,000 and $500,000 and guaranteed borrowers with annual production between $500,000 and $2 million. However, this implies reducing service to smaller farms who have historically been the focus of direct lending.
While FSA has made substantial use of loan participations with other lenders in recent years to leverage direct farm ownership loan funds, expansion of their use in other farm loan programs would enable FSA to further leverage its lending resources. Provided there is sufficient collateral to securitize a loan, FSA may subordinate to another lender who provides a portion of the loan funds. Since subordination would result in FSA being the first lender to absorb any losses, this strategy would increase risk exposure. In addition, greater streamlining of microloans could reduce loan delivery costs, but care would need to be taken to minimize any potential for increased losses.
Gale, W.G. 1991. “Economic Effects of Federal Credit Programs.” American Economic Review 81(1):133-152.
Gray, A.W., and M. Boehlje. 2005. “Risk Sharing and Transactions Costs in Producer-Processor Supply Chains.” Choices. Quarter 4. Available online: http://www.choicesmagazine.org/2005-4/supplychain/2005-4-13.htm
Hoppe, R.A. 2014. “Structure and Finances of U.S. Farms: Family Farm Report, 2014 Edition.” U.S. Department of Agriculture, Economic Research Service, Economic Information Bulletin 132. Available online: http://www.ers.usda.gov/publications/eib-economic-information-bulletin/eib132.aspx.
MacDonald, J. 2014. “Family Farming in the United States.” Amber Waves, U.S. Department of Agriculture, Economic Research Service. Available online: http://www.ers.usda.gov/amber-waves/2014-march/family-farming-in-the-united-states.aspx.
O’Donoghue, E.J., R.A. Hoppe, D.E. Banker, R. Ebel, K. Fuglie, P. Korb, M. Livingston, C. Nickerson, and C. Sandretto. 2011. “The Changing Organization of U.S. Farming.” U.S. Department of Agriculture, Economic Research Service, Economic Information Bulletin 88. Available online: http://www.ers.usda.gov/media/176816/eib88_1_.pdf.
Office of Management and Budget (OMB). 1996-2017 “Budget of the United States Government, Federal Credit Supplement”. U.S. Government Printing Office, Washington D.C. Available online: https://www.gpo.gov/fdsys/browse/collectionGPO.action?collectionCode=BUDGET.
Peel, D., D. Doye, and M. Ahearn. 2013. “Drivers of Agricultural Transition.” Choices. Quarter 2. Available online: http://www.choicesmagazine.org/choices-magazine/theme-articles/transitions-in-agriculture/drivers-of-agricultural-transition
U.S. Department of Agriculture (USDA). 2006. “Report to Congress: Evaluating the Relative Cost Effectiveness of the Farm Service Agency’s Farm Loan Programs.” Farm Service Agency, Economic Policy Analysis Staff . Available online: http://www.fsa.usda.gov/Assets/USDA-FSA-Public/usdafiles/EPAS/PDF/farm_loan_study_august_06.pdf.
U.S. Department of Agriculture, Agricultural Resource Management Survey (USDA-ARMS). 2016. “ARMS Farm Financial and Crop Production Practices.” Available online: http://www.ers.usda.gov/data-products/arms-farm-financial-and-crop-production-practices.aspx.
U.S. Department of Agriculture, Economic Research Service (USDA-ERS). 2016. “Farm Income and Wealth Statistics.” Available online: http://www.ers.usda.gov/data-products/farm-income-and-wealth-statistics/balance-sheet.aspx.
U.S. Department of Agriculture, Farm Service Agency (USDA-FSA). 2015. “Farm Loans: 2014 Farm Bill Fact Sheet.” Available online: http://www.fsa.usda.gov/Assets/USDA-FSA-Public/usdafiles/FactSheets/2015/farmlnchart_current_nov2015.pdf.
U.S. Department of Agriculture, Farm Service Agency (USDA-FSA). 2016. “Farm Loan Programs.” Available online: http://www.fsa.usda.gov/programs-and-services/farm-loan-programs/index

