Over much of the United States, agricultural farmland prices have increased dramatically since 2005. Between 2005 and 2010, annual cropland price increases in the lower 48 states averaged 5.6% (U.S.D.A. 2009, 2010). Higher rates occurred in the Corn Belt, where returns are more directly impacted by ethanol use. For example, both Iowa and Illinois cropland values increased 8.2% annually between 2005 and 2010 (U.S.D.A. 2009, 2010). More recent observations suggest farmland growth rates have accelerated. An Iowa State survey found increases of 10% from 2009 to 2010 in many counties (Duffy, 2010). The Illinois Society of Farm Managers and Rural Appraisers collected sales data on Illinois farmland and found that prices increased approximately 15% from the beginning to end of 2010.
Sharply increasing prices lead to concerns of a repeat of the experiences of the 1980s, where a rapid price increase was followed by the sharpest price decline in modern history. Sheila Bair, Chairperson of the Federal Deposit Insurance Corporation (FDIC), indicated that signs of instability exist in the farmland market similar to those that occurred before prices declined in the housing and stock markets (Gillam,2010) and used the term “bubble” in her comments, setting off a chain of related investigations by farm lenders and policymakers. In March 2011, FDIC held a conference entitled “Don’t Bet the Farm: Assessing the Boom in U.S. Farmland”, at which the general impression was that a classic bubble is not imminent, but that significant concerns about valuation revisions exist. Noted economist Robert Shiller, recently indicated that farmland is his dark horse candidate for a bubble, again fanning the flames in the popular press over the possibility of a farmland price crash.
Is farmland at risk for a rapid and substantial price decline? Here we argue that the answer depends primarily on two factors. The first is the extent to which commodity prices have reached new, sustainably higher levels. Factors contributing to recent higher prices have been increased use of corn in producing ethanol and growing demands for meat and grains in developing countries. The second factor is whether historically low capitalization rates continue into the future. Currently, interest rates are at low levels, and returns on competing assets are viewed as low by historic standards. The resulting lower capitalization rates translate to higher farmland prices. However, if interest rates increase, downward pressure would be expected on farmland prices.
These factors are more fully discussed after describing the determinants of farmland prices. Then we examine the impacts that rising commodity prices have on farmland returns and prices, followed by an analysis of the impact of interest rates on farmland prices. Examples related to Illinois farmland are presented. While the examples are specific to Illinois, results of this analysis are generally applicable to the greater corn-belt.
The general consensus of agricultural economists is that farmland prices equal their discounted future returns. Present value models based on this principle can be fairly simple including only the level of current farmland returns, an expected growth rate in returns, and a discount factor (see, for example, Melichar, 1979). Other models segregate return factors among transaction costs, capital gains rates, property taxes, and income tax rates (Lee and Rask, 1979), or account for spatial relationships to nonincome benefits of ownership (Huang, et.al, 2006). Whether simple or complex, the basics are the same: farmland price equals its discounted future returns. Increases in farmland returns or growth rates in farmland returns will increase farmland prices. Decreases in the discount factor, usually represented by interest rates, result in increases in farmland prices.
There is, however, one obvious problem with direct evaluation of the present value approach—expectations are not directly observable. Because expectations are not observable, investors are faced with evaluating factors influencing expectations, often relying on current return and interest rate levels as proxies for expectations. Burt established this linkage in a capitalization model econometrically estimated for central Illinois farmland. One important implication of Burt’s research is that using a simple growth rate on future returns is not supported—expectations are formed in a more complicated way. Complex expectation formations can lead to lagged relationships between farmland returns and farmland prices, frustrating those looking for a simple explanation for the current prices of farmland.
In any case, it is not controversial that as expectations of farmland returns increase, farmland prices increase. A commodity price level increase that leads to higher farmland returns would thus cause higher farmland prices, most likely in a lagged fashion. It thus follows that an understanding of commodity price dynamics helps to establish an interpretation of the recent farmland price movements.

Since the mid-2000s, rapidly increasing quantities of corn have been used in ethanol production, leading to the need for more corn acres, contributing to corn price increases. Illustrative of these increases are national, season-average-prices (SAPs) for corn from 2005-09, as shown in Figure 1. Between 1975 through 2005, corn prices did not trend up or down, but varied around an average of $2.33 per bushel. Since 2005, average corn prices have been much higher. Including the preliminary SAP of $5.40 for 2010 results in a corn price average for 2006-10 of $4.05, an increase of 73% over the $2.33 per bushel average from 1975-2005. Furthermore, rising prices are not restricted to corn, as prices of other commodities also increase to maintain their acreage. Hence, corn use in ethanol also impacts returns to other crops.
A significant question for the future of farmland prices relates to long-term commodity prices. Given the large use of corn in ethanol, Irwin and Good suggest fundamental factors support a longer term corn price near $4.60 per bushel. At a $4.60 price, supply responses could be large leading to lower prices. Moreover, energy and ethanol policies could change. Babcock notes that plausible ethanol policy alternatives could have an impact of over $2.00 per bushel on farm-level corn prices. Moreover, the impact of crude oil prices is more direct than in that past, as corn prices are now tied to crude oil prices through the ethanol market (Good and Irwin, 2009). These linkages introduce new risks to farmland values that reside entirely outside the food and feed sector and often are a byproduct of other political wrangling in energy and environmental debates that frame ethanol policy.
All else constant, higher commodity prices lead to higher returns to farming. To illustrate, operator and farmland returns were computed to represent average returns to Illinois farmland from 2000 to 2010. Actual returns and costs for Illinois were used in computation (Schnitkey, 2010, October). This data originated from Illinois Farm Business Farm Management (FBFM), a farm accounting and financial consulting service operated as a cooperative in Illinois. Operator and farmland returns equal gross revenue minus non-land costs, and represent a return to both owning and operating the farmland. The return to farmland varies depending on whether the farmland is owned, share rented, or cash rented. If farmland is cash rented, subtracting the cash rent from operator and farmland returns yields the return to farming while the cash rent represents the return to the land ownership.
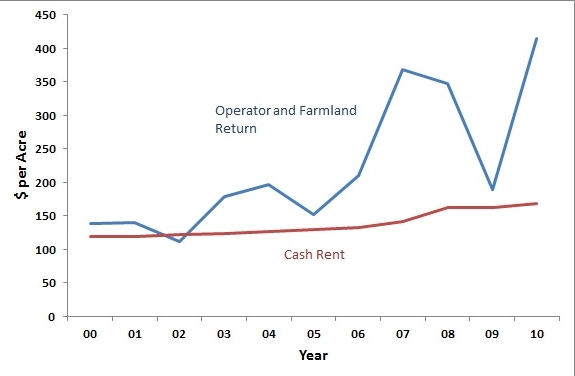
As shown in Figure 2, operator and farmland returns for Illinois have averaged higher since 2006, the period after which commodity prices rose. Between 2000 and 2005, returns averaged $153 per acre. Since 2006, operator and farmland return averaged $306 per acre, a doubling of operator and farmland return. During the 2006 period, corn prices averaged $4.05, suggesting that a $4 per bushel corn price is roughly consistent with a $300 operator and farmland return.
Higher operator and farmland returns, which provides a return to both operating and owning the farmland, then provides for higher returns to owning farmland. Indeed, farmland returns as measured by average Illinois cash rents reported by USDA have increased. USDA cash rents averaged $126 per acre between 2000 and 2005 and $153 per acres between 2006 and 2010. Note however that the 24% in cash rents lags the doubling of operator and farmland returns. This then caused cash rent to be a declining proportion of operator and farmland returns. From 2000 through 2005, cash rent averaged 82% of operator and farmland return from 2000 through 2005 compared to 55% between 2006 through 2009.
These proportional declines suggest lags in the cash rental market. Like lags observed by Burt in the farmland market, there likely are lags in the rental market, thus leading to a slower adjustment in cash rents than in operator and farmland returns. It is likely that if commodity prices continue to average around $4 per bushel, cash rents will continue to increase. If cash rents equilibrate to 82% of operator and farmland price returns, average cash rents would average $250 per acre, an increase of 47% from their $169 per acre level in 2010.

Nominal interest rates have experienced a general decline since the early 1980s, as illustrated by the yields on 10-year constant-maturity Treasury notes (CMT-10) shown in Figure 3. In 1981, the interest rate on CMT-10 was 13.9%. From this high, rates reached a low of 3.2% interest rate in 2010. As interest rates fall, asset prices increase as future cash are discounted at a lower rate. Farmland is a long-lived asset, having cash flows that often are modeled as occurring into perpetuity. Because of its long life, farmland price is much more sensitive to interest rates than shorter lived assets.
The impacts of interest rate declines can be illustrated by calculating capitalized values. A capitalized value equals the discounted present value of all future cash flows. Assuming an asset with an infinite life and constant cash rents and discount rates, a capitalized value equals cash rent divided by interest rate—a constant growth rate on income can be assumed in the net capitalization rate for convenience. The $169 per acre average Illinois cash rent from 2010 is used to illustrate. The capitalized value given the 1981 CMT-10 rate of 13.9% is $1,215 per acre ($1,215 = $169 per acre / 13.9% rate). The 2010 CMT-10 rate of 3.2% results in a capitalized value of $5,281. The decline from a 13.5% CMT-10 rate to a 3.2% rate results in an increase of 343% in the capitalized value. As can be seen, declining interest rates have been a large factor in driving capitalized values higher. This increase in capitalized values likely then led to higher farmland prices.
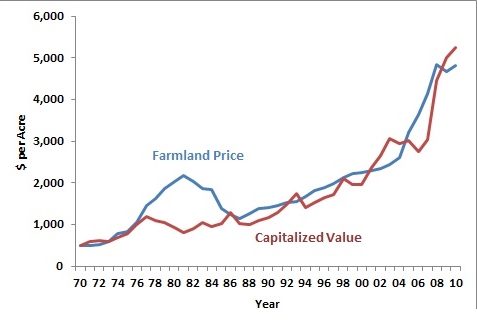
The simple capitalization model of cash rent divided by CMT-10 rates provides capitalized values that closely follow Illinois farmland prices, as can be seen in Figure 4. The last time farmland prices experienced major divergence from capitalized values was during the early and mid-1980s. At its largest divergence in 1981, the farmland price of $2,188 per acre exceeded the capitalized value of $818 per acre by a factor of 1.67. Between 1981 through 1986, farmland prices declined from $2,188 per acre to $1,232 per acre. The $1,232 per acre value was slightly below the capitalized value of $1,300 per acre. During the early 1980s, capitalized values suggested that prices were too high relative to underlying returns and interest rates. The farmland price adjustment during the mid-1980s brought prices and capitalized values into close alignment.
Since 1986, prices and capitalized values have tracked each other closely, with farmland prices averaging 5% higher than capitalized values from 1986 through 2010. Since the commodity price increase, farmland prices increased from $3,210 per acre in 2005 up to $4,820 per acre in 2010, an increase of 50%. During this same period, capitalized values increased at a faster rate than farmland prices. In 2010, capitalized value of $5,258 per acre was above the farmland price of $4,820 per acre, unusual given that farmland prices typically are higher than capitalized values.
While farmland prices have increased dramatically in recent years, underlying factors have contributed to this increase. Farmland returns have increased and interest rates have fallen. As of yet, farmland prices have not overshot capitalized values as occurred in the 1980s. Before farmland prices decline, first capitalized values likely have to decline. Capitalized values will fall if interest rates increase or farmland returns decrease.
| 10-year Treasury Note Rate |
Cash Rent Per Acre | |||
| $120 | $145 | $169 | $195 | |
| 3.2% | $3,750 | $4,531 | $5,281 | $6,094 |
| -29.0% | -14.2% | 0.0% | 15.4% | |
| 3.7% | $3,243 | $3,919 | $4,568 | $5,270 |
| -38.6% | -25.8% | -13.5% | -0.2% | |
| 4.2% | $2,857 | $3,452 | $4,024 | $4,643 |
| -45.9% | -34.6% | -23.8% | -12.1% | |
| 4.7% | $2,553 | $3,085 | $3,596 | $4,149 |
| -51.7% | -41.6% | -31.9% | -21.4% | |
| 5.2% | $2,308 | $2,788 | $3,250 | $3,750 |
| -56.3% | -47.2% | -38.5% | -29.0% | |
| 5.7% | $2,105 | $2,544 | $2,965 | $3,421 |
| -60.1% | -51.8% | -43.9% | -35.2% | |
Note: The dollar value in each cell is the capitalized value (cash rent / interest rate) for the cash rent and interest rate combination. Percentages give changes from the 2010 capitalized value of $5,281 per acre ($169 per acre cash rent and 3.2 percent Treasury note rate).
Table 1 shows capitalized values for different cash rents and CMT-10 rates. The 2010 capitalized value of $5,281 per acre associated with a $169 per acre cash rent and 3.2% CMT-10 is used as a base. The percent changes in capitalized values are reported as a percent of the 2010 capitalized value.
A 0.5% increase results in a CMT-10 rate increase from 3.2% to 3.7%. This rate increase would cause a 13.5% decline in capitalized value from $5,281 per acre to $4,568 per acre. This is a fairly dramatic fall from what can be viewed as a modest rise in interest rates. A more pronounced rise to a 5.7% CMT-10 rate, near the average rate from 1990 through 2010, results in a 43.9% decrease in capitalized values. These large impacts occur because increasing interest rates have a much larger impact on capitalized values at lower interest rates than at higher interest rates. Hence, today’s low interest rates could be a contributing cause to price declines when interest rates increase in the future.
A legitimate concern relates to the interest rate environment and impressions that recent Federal Reserve quantitative easing has resulted in excess short term liquidity, and hence capitalization rates that are “too low”. Given current short term rates, it is unclear how they could go lower, and it is also unclear what form of an “exit strategy” could be employed by the Federal Reserve that would not result in higher rates. Resulting increases in interest rates would in turn place downward pressure on farmland prices, along with downward pressure on other assets as well. Importantly, the effects of a rate change of a given magnitude are amplified when the starting rates are lowest. Thus, even modest increases in interest rates would have a larger impact on farmland prices today than several years ago when interest rates were higher.
Heightening this interest rate concerns is an observation from the 1980s. A large reason for the divergence in capitalized values and prices in the early 1980s was because of a sharp rise in interest rates during the late 1970s and early 1980s. Relatively speaking, declines in farmland returns played a much smaller role in the divergence.
A decrease in cash rent also lowers capitalized values. For example, the $5,281 per acre capitalized value for 2010 is associated with a $169 per acre cash rent. From 2000 through 2005, cash rents averaged $120 per acre. Capitalized values based on that average rent would decline by 29% to $3,750 per acre. Developing scenarios where cash rents fall to the $120 level likely would require corn prices to fall to the preethanol levels of $2.30 per bushel and this in turn would likely require dramatic changes to ethanol policies, as well as reduction in crude oil prices.
With regard to cash rents, it is important to note that there is considerable momentum for continued increases in cash rents in the future if corn prices continue to exceed $4.00 per bushel. Currently, cash rents are a smaller portion of operator and farmland return than during the 2000 through 2005 period. Bidding among farmers likely will push up cash rents to higher levels unless corn prices fall below the $4.00 per bushel price level that is implicitly justified in current rent levels and could be interpreted as a new norm.
Despite the large increases experienced recently, farmland prices appear to be supported by higher returns and lower interest rates. The two most likely candidates to cause a price decline are decreasing commodity prices or rising interest rates. The same could be said at any point in history, but what differs now is that Federal policy could be the trigger that causes a farmland price decline. Changes in ethanol policy could cause commodity price declines and changes in FED policy could lead to rising interest rates, ironically both sourced in Federal policy circles where much of the concern about farmland potential bubbles have emanated.
Babcock, B.A. (2008). When will the bubble burst? Iowa Ag Review, 14(1), 1-3. Available online: http://www.card.iastate.edu/iowa_ag_review/winter_08/IAR.pdf.
Burt, O. (1986). Econometric modeling of the capitalization formula for farmland prices. American Journal of Agricultural Economics, 68(1), 10-26.
Duffy, M. (2010). Iowa Land Value Survey Results in 2010. Iowa State University. Available online: http://www.extension.iastate.edu/landvalue/.
Gillman, C. (2010, Oct. 18). FDIC chair warns of possible US farmland ‘bubble’. Reuters. Available online: http://www.reuters.com/article/2010/10/18/fdic-farmland-idUSN1828495320101018.
Good, D. and Irwin, S. (2008). The new era of corn, soybean, and wheat prices. Marketing Outlook Briefs, MOBR 08-04. Department of Agricultural and Consumer Economics, University of Illinois. Available online: http://www.farmdoc.illinois.edu/marketing/mobr/mobr_08-04/mobr_08-04.html.
Huang, H., G. Miller, B. Sherrick, and Gomez, M. (2006). Factors influencing Illinois farmland values. American Journal of Agricultural Economics, 88(2), 458-470.
Irwin, S.H. and Good, D.L. (2009). Market instability in a new era of corn, soybean, and wheat prices. Choices: The Magazine of Food, Farm, and Resource Issues, 24(1). Available online: http://www.choicesmagazine.org/magazine/article.php?article=56.
Illinois Society of Professional Farm Managers and Rural Appraisers. (2011). ISPFMRA annual farmland values and lease trends, Publication, 2011. Available online: http://www.ispfmra.org/land-values.html.
Lee, W.F. and Rask, N. (1976). Inflation and crop profitability: How much can farmers pay for land? American Journal of Agricultural Economics, 58(5), 984-990.
Melichar, E. (1979). Capital gains versus current income in the farming sector. American Journal of Agricultural Economics, 61(5), 1085-1092.
Schnitkey, G. (2010). Farmland price outlook: Are farmland prices too high relative to returns and interest rates. Illinois Farm Economics: Facts and Opinions, FEFO 10-17. Department of Agricultural and Consumer Economics, University of Illinois. Available online: http://www.farmdoc.illinois.edu/manage/newsletters/fefo10_17/fefo10_17.html.
Schnitkey, G. (2010, October). Revenue and Costs for Corn, Soybeans, Wheat, and Double Crop Soybeans, actual for 2004 through 2009, projected for 2010 and 2011. Department of Agricultural and Consumer Economics, University of Illinois. Available online: http://www.farmdoc.illinois.edu/manage/actual_projected_costs.pdf
Shiller, R.J. (2011, March 22). Bubble spotting. Project Syndicate: A World of Ideas. Available online: http://www.project-syndicate.org/commentary/shiller76/English.
United States Department of Agriculture National Agricultural Statistical Service. (2009). Land values and cash rent 2009 summary. ISSN: 1949-1867. Available online: http://usda.mannlib.cornell.edu/MannUsda/viewDocumentInfo.do?documentID=1446
United States Department of Agriculture National Agricultural Statistical Service. (2010). Land values and cash rent 2010 summary. ISSN: 1949-1867. Available online: http://usda.mannlib.cornell.edu/MannUsda/viewDocumentInfo.do?documentID=1446

