From December 2007 to June 2009, the U.S. economy suffered the longest and deepest downturn since the Great Depression. Now aptly referred to as the Great Recession, the catalyst for this 18-month contraction was the bursting of a housing bubble that had become a profit center for the U.S. economy in the earlier part of the decade. As housing prices plummeted, mortgage defaults and foreclosures soared, and a systemic crisis took hold in the financial sector due to staggering losses on mortgage-backed securities and related products. The crisis created severe economic hardship for many Americans, including high and long-term unemployment, increases in the ranks of discouraged and involuntary part-time workers, and the greatest number of people in poverty in over 50 years. Given the magnitude of the crisis, the federal government responded with a series of bailout and stimulus programs aimed at mitigating the damage wrought by the downturn, the scale of which were unprecedented in the post-Depression era (Grusky, Western, and Wimer, 2011).
As the toll of the Great Recession mounted, another consequence was record-high levels of participation in the Supplemental Nutrition Assistance Program (SNAP). Formerly the Food Stamp Program (known most commonly simply as “food stamps”), SNAP is the nation’s largest food assistance program and one of the longest-standing components of the U.S. social safety net. While SNAP participation was widespread in the year leading up to the recession, averaging roughly 26 million people a month in 2007 (one in 11 Americans), by 2011, in the wake of the downturn, about 45 million people were enrolled in the program on a monthly basis (one in seven Americans) (U.S. Congressional Budget Office, 2012).
While the lion’s share of research on SNAP participation has reasonably focused on individual/household-level characteristics at one end of the continuum and state-level considerations at the other, several recent studies have drawn attention to the middle-range influence of local place-based factors (Goetz, Rupasingha, and Zimmerman, 2004; and Slack and Myers, 2012 and 2014). Focusing on counties, these studies demonstrate that places with high SNAP receipt are typically not geographically isolated, but instead tend to be members of regional clusters characterized by similar levels of SNAP use. For example, persistently poor multicounty regions such as Central Appalachia, the Lower Mississippi Delta, and the Rio Grande Valley stand out for having especially high levels of SNAP receipt (Slack and Myers, 2012).
We also know that the impacts of the Great Recession were geographically uneven. Take, for instance, one of the Great Recession’s signature features, the collapse of the residential housing market. During the downturn nearly half the states in the country actually had their housing prices hold steady. But in five states, median home values fell more than 30%: Nevada (-49%), Florida (-38%), Arizona (-38%), California (-37%), and Michigan (-34%) (Taylor et al., 2011). The same five states were plagued by some of the highest unemployment rates during the recession, with Nevada again ranking at the top of the list (+9.8%) (Walden, 2012).
The unevenness of the geographic impacts of the Great Recession and the record-high levels of food stamp receipt by the downturn’s end led researchers to extend earlier work on the county-level prevalence of SNAP participation (Slack and Myers, 2012) to examine changes in county-level SNAP receipt over the course of the crisis (Slack and Myers, 2014). The more recent study drew on data from the U.S. Department of Agriculture (USDA), U.S. Census Bureau, and other secondary sources. Available data allowed for the analysis of the percentage-point change in SNAP receipt between 2007 and 2009 in the contiguous United States for a total sample of 2,485 counties in 32 states and the District of Columbia (county-level SNAP data are not available from the USDA for 16 states, primarily located in the Northeast and Northwest).

County-level SNAP receipt climbed an average of 2.3 percentage-points between 2007 and 2009, with counties ranging from a decrease of 5.3 points to an increase of 11.3. As illustrated in Figure 1, the geographic distribution of changes in SNAP participation was not geographically random. Of special note in the figure are counties that are more than one standard deviation above the mean—places with “above average” changes in SNAP receipt—and counties that are more than one standard deviation below the mean—places with “below average” changes in SNAP receipt. The map shows that counties where SNAP use climbed highest tend to be regionally clustered, with counties in Arizona and Florida standing out in particular. As pointed out earlier, during the Great Recession these were two states where the impact of the crisis was particularly severe.
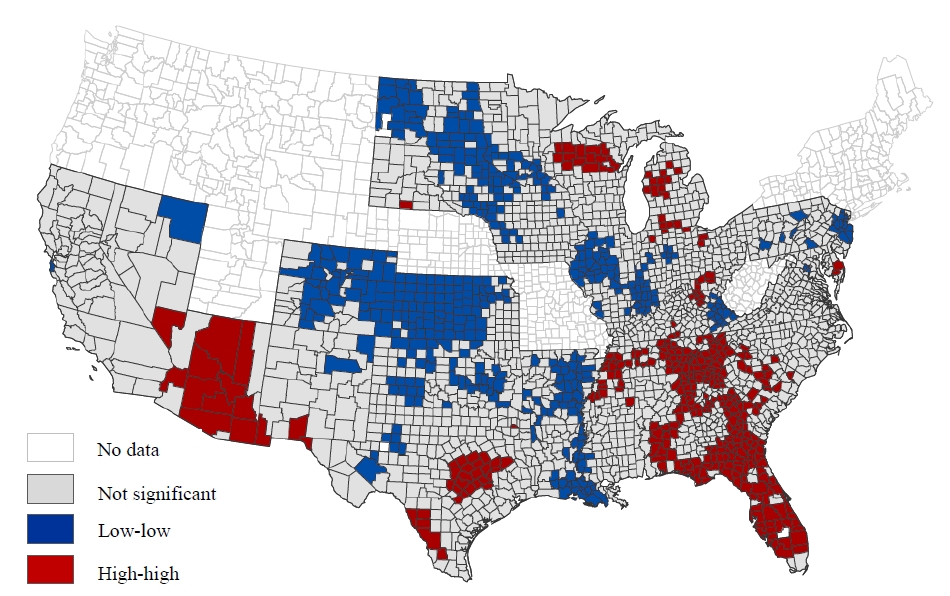
Figure 2 puts this geographic clustering in even clearer relief. It shows a Local Indicators of Spatial Association (LISA) map of county-level change in SNAP receipt which highlights places at the center of statistically significant concentrations of changes in SNAP use. The terminology used in LISA maps for significant spatial clustering of high values is “high-high” (i.e., counties with high levels of SNAP change surrounded by neighboring counties with similarly high levels of SNAP change), while significant spatial clustering of low values is referred to as “low-low” (i.e., counties with low levels of SNAP change surrounded by neighboring counties with similarly low levels of SNAP change). What stands out in the LISA map is the significant regional clustering of places with high (N=349) and low (N=427) levels of change in SNAP receipt. Especially apparent is the significant clustering of high SNAP change in Arizona, Florida, and parts of Michigan—again places hit hard during the recession—as well as to parts of the southeastern United States and areas in Texas and Wisconsin. Equally striking is the significant clustering among counties with little change (or even reductions) in SNAP receipt over the course of the downturn. Areas that stand out in this regard include parts of Kansas, Colorado, and the Dakotas (the latter being in the midst of an energy boom), as well as regions with historically high levels of SNAP participation like the Lower Mississippi Delta and Central Appalachia.
Slack and Myers (2014) specified models to assess how various characteristics of counties were linked to local changes in food stamp receipt, including measures tapping a county’s poverty experience, labor market characteristics, population structure, human capital, and residential context. (See Box for more about the statistical models employed by Slack and Myers (2014) and described in this article.) Consistent with expectations, the results showed that places where the impacts of the Great Recession were most pronounced also witnessed the most significant increases in SNAP receipt. Increased SNAP participation was associated with increases in poverty, unemployment, and home foreclosures. The study also found that SNAP receipt also jumped significantly in areas where the Latino population is growing—potentially reflecting the particular hardship the Great Recession inflicted on the construction sector, a part of the labor market where Latino labor factors prominently, as well as the disproportionate impact of the downturn on states with major Latino populations (e.g., Arizona, California, and Nevada)—and also showed the positive “neighbor effect” continued to hold in the presence of other variables. In addition, the results showed that changes in SNAP receipt were significantly lower in persistently poor regions of the country—places where SNAP participation has historically been highest—potentially due to the fact that the housing bubble was most pronounced in growing and more affluent locales and that SNAP use has already reached its “ceiling” in places with high long-term poverty.
Counter to expectations, increases in the share of female-headed families, older populations, black populations, and less educated populations—groups that are often more vulnerable to economic hardship—were shown to be associated with significantly less change in food stamp receipt during the recession. In addition, residential segregation between poor and non-poor populations, an indicator of barriers to social and economic integration, was shown to be associated with significantly less change in SNAP receipt. And, finally, small-town America (micropolitan areas) was found to have experienced greater SNAP increases compared to other residential settings. Given the prominence of major metropolitan areas, like Phoenix and Las Vegas, in media accounts of the fallout from the recession, that SNAP use jumped most in small towns was not anticipated.
Significantly More Change in Places Characterized By:
Increases in poverty
Increases in unemployment
More home foreclosures
Increases in Latino populations
Micropolitan (small town) settings
Increases in SNAP receipt among neighboring counties
Significantly Less Change in Places Characterized By:
Persistent poverty
Increases in single female family headship
Increases in older populations
Increases in black populations
Increases in less educated populations
Increases in poor/non-poor segregation
Overall, research suggests that the impacts of the Great Recession (in particular, poverty, unemployment, and home foreclosures) played a pivotal role in driving up county-level SNAP receipt, while factors that have traditionally been linked to high SNAP participation (such as persistent poverty) were not associated with rising SNAP use during the crisis. Moreover, the study demonstrated that counties where SNAP use jumped most were not spatially random or geographically isolated places, but, rather, members of multi-county regional clusters. In sum, research showed that increased SNAP receipt was geographically uneven during the Great Recession and that local and regional configurations were at play in shaping this variation.
The Agricultural Act of 2014, more commonly known as the 2014 Farm Bill, was signed into law on February 7, 2014, after much legislative theatre. Most of the bill will remain in force until 2018, with some elements extending beyond that time. According to the USDA’s Economic Research Service (2014), the farm bill contains $489 billion in total outlays, about 80% of which is budgeted for the nutrition title. SNAP, which represents the bulk of nutrition program spending, will see few changes in its eligibility requirements under the agreement. The bill does seek to clarify some resource guidelines related to eligibility and provides funds for innovation in the use of information technology to root out fraud. It also directs money toward the development of programs aimed at connecting more SNAP recipients to gainful employment as well as new provisions to help facilitate healthy food choices among those on SNAP. Perhaps especially important given the research outlined in this article, the new farm bill will provide increased resources for the Community Food Projects Competitive Grants Program, which provides funding for local-level efforts that seek to improve food security in low-income areas through nutrition education.
Slack and Myers’ (2012 and 2014) research suggests there may be opportunities for targeted regional approaches to SNAP outreach and education. Building regional networks among SNAP providers and affiliated groups could allow for the better alignment of resources, increased capacity, and more effective sharing of best practices. Moreover, because key local-level factors show significant associations with changes in SNAP receipt, policymakers could use this information in the development of community profiles to identify and anticipate demand for food assistance. Administrative innovation and modernization efforts at the state level are being encouraged by the USDA. Efforts aimed at engaging local community partners on SNAP outreach and education and building inter-state regional collaborations might be fruitful in this regard as well.
Regarding the Great Recession and future downturns, SNAP was especially responsive to the increased economic hardship wrought by the crisis. In short, the program did what it is designed to do. This is especially notable since Temporary Assistance for Needy Families (that is, cash assistance) showed no response to the downturn, continuing the steady downward caseload trajectory the program has been on since the welfare reform bill of 1996. It is also important to note that SNAP not only mitigates food insecurity, it also acts as an efficient and effective form of local economic stimulus. Spending on SNAP yields a substantial local multiplier effect, with every $1 of SNAP benefits spent in a community generating an additional $1.80 in local spending (USDA Food and Nutrition Service, 2011). This means investing in SNAP not only helps millions of Americans feed their families, it is also good stimulus policy in the context of an economic crisis.
Goetz, S.J., A. Rupasingha, and J.N. Zimmerman. (2004). Spatial Food Stamp Program participation dynamics in U.S. counties. Review of Regional Studies 34: 172-190.
Grusky, D.B., B. Western, and C. Wimer. (2011). The Great Recession. New York, NY: Russell Sage.
Slack, T., and C.A. Myers. (2014). The Great Recession and the changing geography of food stamp receipt. Population Research and Policy Review, 33, 63-79.
Slack, T., and C.A. Myers. (2012). Understanding the geography of Food Stamp Program participation: Do space and place matter? Social Science Research, 41, 263-275.
Taylor, P., R. Kochhar, R. Frey, G. Velasco, and S. Motel. (2011). Twenty-to-one: wealth gaps rise to record highs between whites, blacks, and Hispanics. Pew Research Center. Washington, D.C.
U.S. Congressional Budget Office. (2012). The supplemental nutrition assistance program. Available online: http://www.cbo.gov/sites/default/files/cbofiles/ attachments/04-19-SNAP.pdf.
U.S. Department of Agriculture Economic Research Service. (2014). Agricultural Act of 2014: Highlights and implications. Available online: http://www.ers.usda.gov/agricultural-act-of-2014-highlights-and-implications.aspx#.UzGwyPldXz8.
U.S. Department of Agriculture Food and Nutrition Service. (2011). The benefits of increasing Supplemental Nutrition Assistance Program (SNAP) participation in your state. Available online: http://www.fns.usda.gov/snap/outreach/pdfs/bc_facts.pdf.
Walden, M.L. (2012). Explaining the differences in state unemployment rates during the Great Recession. The Journal of Regional Analysis and Policy 42: 251-257.

