With the massive loss of employment during “The Great Recession,” many regions, states, counties, and communities have initiated or strengthened their economic development activities. These efforts often involve recruiting specific businesses or training programs for local entrepreneurs. The development goals of the local populace or considerations of local development capacity in terms of space, infrastructure and other assets are often ignored. With little or no input from the local populace, these efforts are not as likely to have a benefit in the long term. For example, a community may be successful in attracting a new firm with tax breaks or other concessions, but the firm may quickly move away once the tax breaks expire. The Area Sector Analysis Process (ASAP) offers a decision support system for economic development that incorporates community preferences for development goals, the quantity and quality of local land and other assets, as well as the requirements of industries/businesses and their expected benefit to the community. ASAP builds upon the Community Business Matching (CBM) process (Hunker, 1974; Buescher, 1999; and Buescher et al., 2001) with community goals that reflect the concept of sustainable development, a refined asset assessment process, a nationwide profile of industries, and a series of recent pilots in Western communities.
Figure 1 (reproduced from Cox et al., 2009, as adapted from Buescher, 1999) describes the ASAP process starting with identifying community development goals and asset availability (Community Profile) and measuring business benefits to the community and business asset requirements (Business Profile). Based on these inputs, desirability of different industries to the community and compatibility of the industries’ requirements with the community asset availability are determined (Analysis Process). Industries identified as both desirable and compatible are starting points for communities looking to expand and/or recruit businesses. However, some desirable industries may not be compatible because one or more community assets are lacking. A long-term development plan designed to improve these deficit assets could be developed (Economic Development Strategies). The community may then take actions based on the strategies (Community Action). The ASAP process could also be used by businesses to identify communities whose assets are most compatible to their needs and whose goals are most consistent with the benefits they offer.
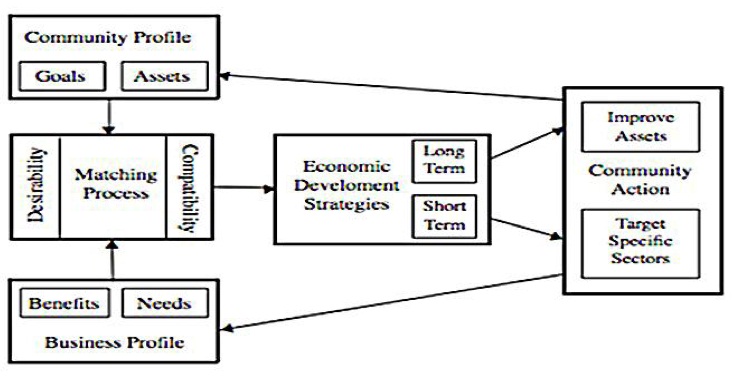
Source: Reproduced from Cox et al., 2009, as
Adapted from Buescher, 1999.
The ASAP concept was first proposed by Hunker (1974) and a pilot CBM model was developed in Vermont much later (Buescher, 1999; Buescher et al., 2001). In 2002, a group of community development extension specialists from Montana State University, University of Nevada, and University of Hawaii began to adapt the CBM process for use in the Western United States. This group has grown since 2009 to include Arizona and Utah. The original pilot model by Buescher et al. (2001) served as the starting point for the ASAP model developed by the Western extension team and a number of modifications and refinements were made to every step of the process shown in Figure 1. Technical papers that detail the model specifications are in preparation.
ASAP begins with the formulation of a local advisory committee that assists in leading the community through the entire process. The committee meets regularly to address the required steps in the process. These steps include conveying an understanding of the ASAP process, a review of socio-economic trends in the community, and ranking of economic development goals based on community members’ preferences.
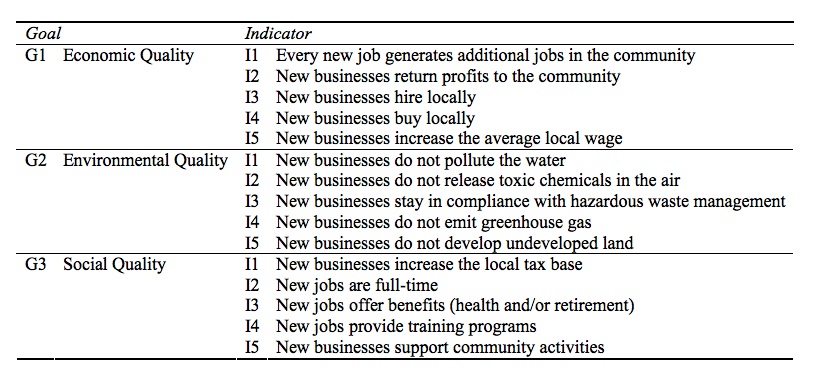
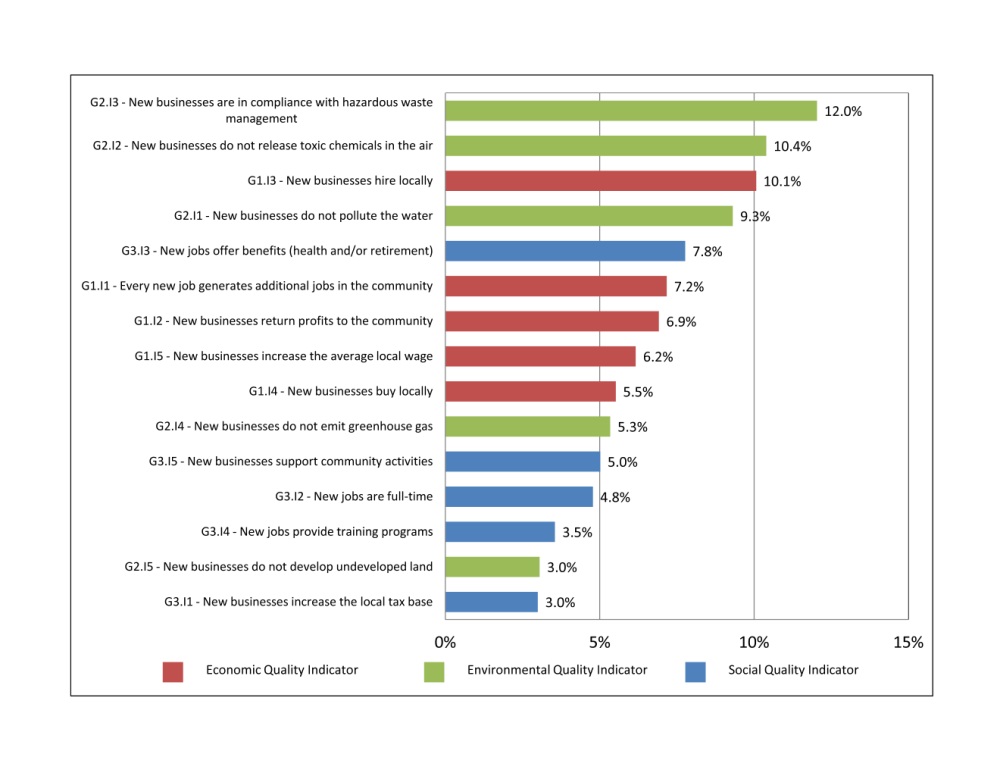
Information on community development goals is collected through a survey of community members. A questionnaire asks respondents to rate the relative importance among three primary goals: Economic Quality, Environmental Quality, and Social Quality. Each goal has five indicators and respondents are asked to rate a total of 15 indicators (Figure 2). Weights for the three goals and the 15 indicators are derived from the survey data using the Analytical Hierarchy Process (AHP). The average weights, which must all add to one, represents the community’s choices among the goals and indicators. Figure 3 provides an example of indicator weights.
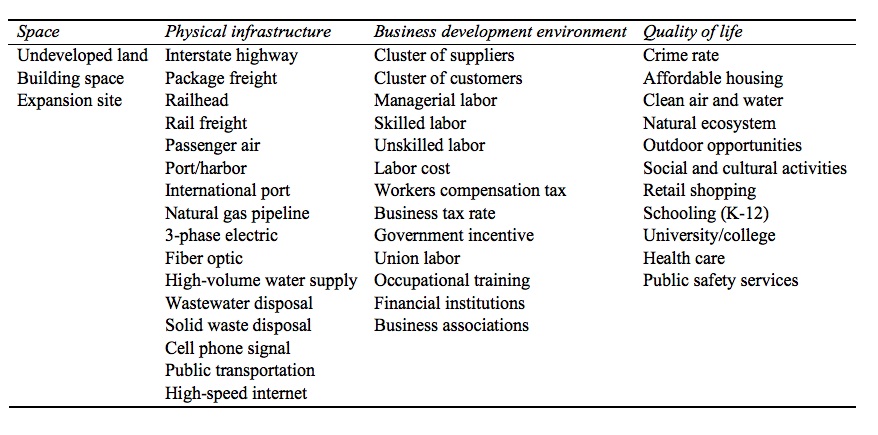
The community advisory committee completes an inventory of community assets and assesses the likelihood that they will change in the future. The information is crucial to identify which industries the community has the capacity to attract. For example, one industry may require sites near a major airport while another may demand a highly skilled labor force. Communities that lack these assets will likely face challenges in targeting these industries, but could decide to develop the assets.
The asset questionnaire has proven to be an area where the ability to complete the task varies greatly across communities. If a community has an organized economic development authority with a skilled administrator, information such as square feet of available manufacturing space may be readily available and accessible. However, without an organized development authority, accessing and compiling local asset data is usually difficult. This process of asset assessment often becomes a teaching opportunity for an extension educator to show community leaders the importance of community asset information and how this knowledge can lead to more effective community economic development efforts.
The next task in the process is to evaluate (1) to what extent businesses are likely to be of benefit to the communities in terms of the goals and indicators found in Figure 2, and (2) to identify businesses’ asset requirements as listed in Figure 4. A combination of secondary data from multiple sources and a survey of individual businesses are used to complete this task. A business profile database has been developed with 1,756 entries as of September 2012 and will continue to expand as more questionnaires are completed. Secondary data are used primarily to measure businesses’ benefits to community.
A computer program is used to calculate desirability and compatibility indices and rank the matches. The desirability index measures how well a business aligns with community development preferences. The compatibility index measures to what extent a firm’s asset needs are satisfied with what the community currently possesses.
Figure 5 provides an example of calculated desirability and compatibility indices presented in a scatter diagram—only the part corresponding with both indices exceeding 0.6 is shown. Indices are aggregated and displayed at the industry level; the numbers in the figure indicate 4-digit North American Industry Classification System (NAICS) codes. The example also shows whether firms in the industries currently exist in this community.

Industries that receive high desirability and compatibility index scores are typically identified as the most promising for the community. The results of ASAP also identify why certain industries received high or low index scores. In the case of a low compatibility index score, ASAP identifies deficiencies in community assets that could be addressed, if the community could access the resources needed to obtain the asset. Alternatively, in the case of a low desirability index score, the community can investigate why a highly compatible industry is not desirable. The community may decide that some firms in the industry are in fact desirable and work with these types of firms to recruit them. Community organizers have repeatedly expressed that ‘average’ citizens are capable of understanding the economic structure of their communities (Highlander Research and Education Center, 1997). Thus, community members and leaders should be able to systematically define and prioritize their development goals and evaluate their assets to complete ASAP.
Anaconda County in Montana faced many challenges when a copper smelter closed in 1980. In 2002, when presented with the concept of the CBM process as it was then labeled, the community leaders became interested in its implementation. They felt that, while effective programs to address the development of entrepreneurship and business retention and expansion were already in place, more was needed. Subsequently, interested local residents developed a community profile summary through meetings and research, which led to the initiation of an ASAP project. The first set of meetings involved a small group as an executive team: an extension educator as a community facilitator, a county economic development professional, and a small business owner who was knowledgeable and committed to the project and the community at large. The community facilitator served as an interface between the community and the University of Nevada, Reno faculty, who were responsible for computing the ASAP indices. A larger ASAP steering committee was later formed with 15 members, which included additional community and business leaders.
In Anaconda, the output of ASAP—especially the high ranking of wholesale firms supplying the building and construction sector—suggested that key opportunities existed in the construction sector. In the past, construction firms had not been viewed as being members of a desirable, compatible industry sector, but ASAP indicated to the steering committee that they should reconsider. While the steering committee members were interested in recruiting new companies from this industry, they also met with local construction firm owners who were already members of this sector and assessed the possibilities for growth. The group quickly recognized that a critical mass of construction projects did not exist in the county, but it did exist in nearby counties. Subsequently the local firms formed a construction business association that developed into a builders association. After pooling resources—including space, human capital, and funds of local businesses and the Anaconda Local Development Corporation (ALDC)—cooperative agreements that included sub-contractor templates were initiated. A “plan exchange” was formulated, and a blueprint copy service was set up at the ALDC. The plan exchange gave greater access to local contractors to bid on projects outside their immediate area. The association also put together a marketing campaign aimed at general contractors to position association members as major sub-contractors. Web sites, DVD demos and brochures aimed at new residents interested in building custom homes were developed. Traditionally, builders located in larger communities in which architects reside won these contracts. Since the ASAP effort was initiated, Anaconda’s construction businesses have grown and are also working in other communities. Some have been competitive with larger contractors and have won multi-million dollar contracts.
The benefits of the ASAP can be contrasted with those of a retention and expansion program that had previously been developed in the Montana community. A critical difference was that ASAP identified the sectors, rather than specific businesses, to focus on. After identifying the construction sector as a target, the community spent considerable time examining forward and backward linkages—industries that supply inputs and purchase the outputs of the construction industry. Thus, the cluster of activities associated with construction and the positive agglomeration externalities within the industry were explicitly considered. The increase in development skills that a community gains by implementing ASAP supports the arguments stressed by Porter (1990) and others on the importance of this process. In this case, the community was able to better understand the economies of scale associated with industry clusters.
Another outcome of the ASAP effort in Anaconda has been the ALDC’s recruitment of firms that supply the inputs and services needed by the local construction industry. As a result, three such firms have relocated to the area, including two that manufacture homes and one supplier of insulation products. While all of these businesses are small—with fewer than 14 employees—the community hopes that they will grow to firms of 25 to 50 employees.
The Anaconda steering committee felt that completing ASAP provided them with additional insight into what processes are necessary for Anaconda businesses to pool resources and grow together. Identification of the community development goals helped them understand what is important and how to direct their focus, which in turn led to the understanding of how to partner within the county and surrounding counties to successfully attract new business. The success of the Anaconda pilot led to a six county regional ASAP project. This regional initiative is unique, given that these counties have a history of working independently. ASAP brought about an understanding of how a regional effort would produce more effective and efficient economic development strategies for the six-county area.
The ASAP process (which was initially the CBM process until the process was adapted by the Western community development extension team and renamed ASAP) has also been implemented in Arizona and Nevada. After the closure of the Mohave Power Plant, the communities of Laughlin, Nevada and Bullhead City, Arizona employed ASAP to develop a cross-state economic development strategy and plan (Borden et al., 2008). In addition, ASAP has been applied to Lander County, Nevada in its unique county economic development effort called Future Industrial Needs Discovery (FIND). Project FIND targets economic development efforts for mining sites where the ore body has been depleted. An ASAP study for Lander County was employed to determine potential economic sectors that could use these mining sites and their infrastructure (Castledine et al., 2010).
Currently new observations are being added to the business database so that the database will represent a wider range of firms and industries and the ASAP model developed by the Western Regional extension team will generate more robust matches. Phone surveys to collect information about missing industries or industries with too few firms are underway and will be completed by December, 2012.
Training materials for community facilitators and community steering community members will also be prepared by December, 2012. A workshop sponsored by the Western Rural Development Center aimed at training community ASAP facilitators is being planned for April, 2013. This event will launch a self-financing, nation-wide ASAP program. A cost recovery system will be implemented for all facilitator workshops, process support and model output generation, which will help generate funds to support business data collection and analysis, while also supporting the collection and analysis of the data about the goals and assets from communities that engage in the ASAP process.
The community and business data will provide insight into how sustainable community development occurs over the long term. Further research can be conducted using this information and the ASAP team is now actively looking for interested researchers. At the same time, communities can network with each other and with the ASAP team in order to share techniques for assisting the community with implementing ASAP, identify the outcomes associated with using ASAP, and agree on additional changes needed in the process and the model specifications. Publicizing the positive ASAP outcomes experienced at the community level is expected to increase the demand for the process and ensure its continued use.
Borden, G., Harris, T., Alevy, J., and Grumbles, R. (2008). Colorado River Region Targeted Economic Development Analysis: A Community Business Matching Model Approach. University of Nevada, Reno, Department of Economics, Reno, NV: University Center Technical Report UCED 2007/08-05.
Buescher, M. (1999). Effective Rural Development Strategies: A Framework for Optimizing Community-Business Matches. Unpublished Master’s Thesis, Department of Community Development and Applied Economics, University of Vermont: Burlington, Vermont.
Buescher, M., Sullivan, P., Halbrendt, C., and Lucus, M. (2001). The Community Business Matching Project: New Tool for Rural Development. Journal of Sustainable Agriculture, 17(4): 57-74.
Castledine, A., Yolyan, R., Fadali, E., Davis, R., Kobayashi, M., Landis, M., Borden, G., and Harris, T. (2011). Lander County, Nevada: Demographic/Economic Trends, Industrial and Occupational Targeting Analysis, and Community Business Matching Model Analysis. University of Nevada, Reno, Department of Economics, Reno, NV: University Center Technical Report UCED 2010/11-06.
Cox, L., Alvey, J., Harris, T., Andreozzi, B., Wright, J., and Borden, G. (2009). The Community Business Matching Model: Combining Community and Business Goals and Assets to Target Regional Economic Development, pp: 255-278. Editors S. Goetz, S. Deller, and T. Harris, Targeting Regional Economic Development, Taylor and Frances Group: New York.
Highlander Research and Education Center. (1997). A Very Popular Economic Education Sampler. New Market, TN.
Hunker, H. (1974). Industrial Development: Concepts and Principles. Lexington, MA: D.C. Heath.
Porter, M. (1990). The Competitive Advantage of Nations. New York: The Free Press.
An earlier version of this article titled "Community Business Matching Model Aids Local Decisionmakers and Developers" improperly cited data. The article has since been corrected. The version currently published online and in the available PDF is most current and correct version. The publisher apologizes for any inconveniences caused.

